|
|
市場調査レポート
商品コード
1420802
欧州のTOPCon太陽電池市場:分析・予測 (2023-2032年)Europe TOPCon Solar Cells Market: Analysis and Forecast, 2023-2032 |
||||||
|
|||||||
カスタマイズ可能
|
|||||||

| 欧州のTOPCon太陽電池市場:分析・予測 (2023-2032年) |
|
出版日: 2024年02月06日
発行: BIS Research
ページ情報: 英文 120 Pages
納期: 1~5営業日
|

全表示
- 概要
- 図表
- 目次
欧州のTOPCon太陽電池市場:イントロダクション
| 主要市場統計 | |
|---|---|
| 予測期間 | 2023-2032年 |
| 2023年評価 | 13億8,000万米ドル |
| 2032年予測 | 61億6,000万米ドル |
| CAGR | 18.1% |
英国を除く欧州のTOPCon太陽電池の市場規模は、2023年の13億8,000万米ドルから、予測期間中は18.1%のCAGRで推移し、2032年には61億6,000万米ドルの規模に成長すると予測されています。
欧州のTOPCon太陽電池の市場は、TOPConセルを提供する企業数の急増を特徴とする急成長段階を現在経験しています。この拡大は、太陽光発電の技術の進歩と、住宅および商業部門におけるユーティリティプロジェクトの展開が増加していることに起因しており、大陸全体でTOPCon太陽電池の採用を促進しています。さらに、この地域の再生可能エネルギーへの投資の高まりも、重要な推進力となっています。TOPCon太陽電池は、その特殊な設計と製造技術により、優れた効率で差別化されています。欧州では、特に電力会社、住宅、商業部門からの需要が増加しているため、既存および新興のTOPCon太陽電池プロバイダー間の競争が激化し、市場の勢いにさらに拍車がかかると予想されます。
当レポートでは、欧州のTOPCon太陽電池の市場を調査し、市場概要、市場成長への各種影響因子の分析、法規制環境、市場規模の推移・予測、主要国別の詳細分析、主要企業の分析などをまとめています。
市場の分類:
セグメンテーション1:エンドユーザー別
- 住宅用
- 商業用
- ユーティリティ
- 農業
- その他
セグメンテーション2:タイプ別
- Nタイプ
- Pタイプ
セグメンテーション3:設置場所別
- 地上設置
- 屋上
セグメンテーション4:国別
- ドイツ
- スペイン
- フランス
- イタリア
- その他
目次
エグゼクティブサマリー
調査範囲
第1章 市場
- 業界の展望
- 動向:現在と未来
- サプライチェーン分析
- TOPCon太陽電池市場のエコシステム
- TOPCon太陽電池市場へのCOVID-19の影響
- TOPCon、ヘテロ接合、ペロブスカイト太陽電池の比較分析
- TOPConセルとPERCセルの比較分析
- 太陽電池とパネルの潜在効率
- TOPCon太陽電池の大幅な進歩
- TOPCon太陽電池市場への最近の投資
- TOPCon太陽電池市場の新興スタートアップ企業
- 事業力学
- 事業促進要因
- 事業上の課題
- 事業戦略
- 経営戦略
- 事業機会
- スタートアップの情勢
- エコシステムにおける主要なスタートアップ企業
第2章 地域
- 欧州
- 市場
- 用途
- 製品
- 欧州(国別)
- 英国
- 市場
- 用途
- 製品
第3章 市場:競合ベンチマーキング・企業プロファイル
- 競合ベンチマーキング
- 企業プロファイル
- AESOLAR
- CARBON
- RENA Technologies GmbH
- Exiom Solution SA
- REC Solar Holdings AS
- Hanwha QCells
- LUXOR SOLAR
- FuturaSun srl
- SoliTek
第4章 調査手法
List of Figures
- Figure 1: Europe TOPCon Solar Cells Market, $Billion, 2022, 2023, and 2032
- Figure 2: Europe TOPCon Solar Cells Market (by End User), $Billion, 2022 and 2032
- Figure 3: Europe TOPCon Solar Cells Market (by Type), $Billion, 2022 and 2032
- Figure 4: Europe TOPCon Solar Cells Market (by Installation), $Billion, 2022 and 2032
- Figure 5: TOPCon Solar Cells Market (by region), $Billion, 2022 and 2032
- Figure 6: Estimated Efficiency Level of TOPCon Solar Cells, 2022-2024
- Figure 7: Top 10 PV Markets by Installed Capacity
- Figure 8: Top Ten Countries for PV Installation and Total Installed PV Capacity in 2022
- Figure 9: Supply Chain Analysis of the TOPCon Solar Cells Market
- Figure 10: Clean Energy Investment in the Net Zero Pathway, $Trillion, 2016-2050
- Figure 11: Renewable Power Generation Based on Technology (Solar) in the Net-Zero Scenario, 2016-2030
- Figure 12: Research Methodology
- Figure 13: Top-Down and Bottom-Up Approach
- Figure 14: TOPCon Solar Cells Market: Influencing Factors
- Figure 15: Assumptions and Limitations
List of Tables
- Table 1: Comparative Analysis of Different Types of Solar Cells
- Table 2: List of Regulatory/Certification Bodies
- Table 3: List of Government Programs for TOPCon Solar Cells Market
- Table 4: List of Programs by Research Institutions and Universities
- Table 5: Key Product Developments
- Table 6: Key Market Developments
- Table 7: Key Mergers and Acquisitions, Partnerships, Collaborations, and Joint Ventures
- Table 8: TOPCon Solar Cells Market (by region), GW, 2022-2032
- Table 9: TOPCon Solar Cells Market (by region), $Billion, 2022-2032
- Table 10: Europe TOPCon Solar Cells Market (by End User), GW, 2022-2032
- Table 11: Europe TOPCon Solar Cells Market (by End User), $Billion, 2022-2032
- Table 12: Europe TOPCon Solar Cells Market (by Type), GW, 2022-2032
- Table 13: Europe TOPCon Solar Cells Market (by Type), $Billion, 2022-2032
- Table 14: Europe TOPCon Solar Cells Market (by Installation), GW, 2022-2032
- Table 15: Europe TOPCon Solar Cells Market (by Installation), $Billion, 2022-2032
- Table 16: Germany TOPCon Solar Cells Market (by End User), GW, 2022-2032
- Table 17: Germany TOPCon Solar Cells Market (by End User), $Billion, 2022-2032
- Table 18: Germany TOPCon Solar Cells Market (by Type), GW, 2022-2032
- Table 19: Germany TOPCon Solar Cells Market (by Type), $Billion, 2022-2032
- Table 20: Germany TOPCon Solar Cells Market (by Installation), GW, 2022-2032
- Table 21: Germany TOPCon Solar Cells Market (by Installation), $Billion, 2022-2032
- Table 22: France TOPCon Solar Cells Market (by End User), GW, 2022-2032
- Table 23: France TOPCon Solar Cells Market (by End User), $Billion, 2022-2032
- Table 24: France TOPCon Solar Cells Market (by Type), GW, 2022-2032
- Table 25: France TOPCon Solar Cells Market (by Type), $Billion, 2022-2032
- Table 26: France TOPCon Solar Cells Market (by Installation), GW, 2022-2032
- Table 27: France TOPCon Solar Cells Market (by Installation), $Billion, 2022-2032
- Table 28: Italy TOPCon Solar Cells Market (by End User), GW, 2022-2032
- Table 29: Italy TOPCon Solar Cells Market (by End User), $Billion, 2022-2032
- Table 30: Italy TOPCon Solar Cells Market (by Type), GW, 2022-2032
- Table 31: Italy TOPCon Solar Cells Market (by Type), $Billion, 2022-2032
- Table 32: Italy TOPCon Solar Cells Market (by Installation), GW, 2022-2032
- Table 33: Italy TOPCon Solar Cells Market (by Installation), $Billion, 2022-2032
- Table 34: Spain TOPCon Solar Cells Market (by End User), GW, 2022-2032
- Table 35: Spain TOPCon Solar Cells Market (by End User), $Billion, 2022-2032
- Table 36: Spain TOPCon Solar Cells Market (by Type), GW, 2022-2032
- Table 37: Spain TOPCon Solar Cells Market (by Type), $Billion, 2022-2032
- Table 38: Spain TOPCon Solar Cells Market (by Installation), GW, 2022-2032
- Table 39: Spain TOPCon Solar Cells Market (by Installation), $Billion, 2022-2032
- Table 40: Rest-of-Europe TOPCon Solar Cells Market (by End User), GW, 2022-2032
- Table 41: Rest-of-Europe TOPCon Solar Cells Market (by End User), $Billion, 2022-2032
- Table 42: Rest-of-Europe TOPCon Solar Cells Market (by Type), GW, 2022-2032
- Table 43: Rest-of-Europe TOPCon Solar Cells Market (by Type), $Billion, 2022-2032
- Table 44: Rest-of-Europe TOPCon Solar Cells Market (by Installation), GW, 2022-2032
- Table 45: Rest-of-Europe TOPCon Solar Cells Market (by Installation), $Billion, 2022-2032
- Table 46: U.K. TOPCon Solar Cells Market (by End User), GW, 2022-2032
- Table 47: U.K. TOPCon Solar Cells Market (by End User), $Billion, 2022-2032
- Table 48: U.K. TOPCon Solar Cells Market (by Type), GW, 2022-2032
- Table 49: U.K. TOPCon Solar Cells Market (by Type), $Billion, 2022-2032
- Table 50: U.K. TOPCon Solar Cells Market (by Installation), GW, 2022-2032
- Table 51: U.K. TOPCon Solar Cells Market (by Installation), $Billion, 2022-2032
- Table 52: Product Matrix for Key Companies (by Type)
- Table 53: Market Shares of Key Companies, 2021
“The Europe TOPCon Solar Cells Market (excluding U.K.) Expected to Reach $6.16 Billion by 2032.”
Introduction to Europe TOPCon Solar Cells Market
| KEY MARKET STATISTICS | |
|---|---|
| Forecast Period | 2023 - 2032 |
| 2023 Evaluation | $1.38 Billion |
| 2032 Forecast | $6.16 Billion |
| CAGR | 18.1% |
The Europe TOPCon solar cells market (excluding U.K.) was valued at $1.38 billion in 2023 and is anticipated to reach $6.16 billion by 2032, witnessing a CAGR of 18.1% during the forecast period 2023-2032. The TOPCon solar cells market is anticipated to grow due to increased requests for solar cells characterized by high efficiency levels and a versatile manufacturing approach facilitated by TOPCon technology.
Market Introduction
The Europe TOPCon solar cells market is currently experiencing a phase of rapid growth, characterized by a surge in the number of companies offering TOPCon cells. This expansion is attributed to the latest technological advancements in photovoltaics and the increasing deployment of utility projects in residential and commercial sectors, driving the adoption of TOPCon solar cells across the continent. Additionally, the region's heightened investments in renewable energy are a key driver, given its minimal carbon footprint and competitive manufacturing costs. TOPCon solar cells distinguish themselves by their superior efficiency, owing to their specialized design and production techniques. With growing demand in Europe, particularly from the utility, residential, and commercial sectors, the competition among established and emerging TOPCon solar cell providers is expected to intensify, further fueling the market's momentum.
Market Segmentation:
Segmentation 1: by End User
- Residential
- Commercial
- Utility
- Agriculture
- Others
Segmentation 2: by Type
- N-Type
- P-Type
Segmentation 3: by Installation
- Ground-Mounted
- Rooftop
Segmentation 4: by Country
- Germany
- Spain
- France
- Italy
- Rest-of-Europe
How can this report add value to an organization?
Product/Innovation Strategy: The product segment helps the reader to understand the different types involved in TOPCon solar cells. Moreover, the study provides the reader with a detailed understanding of the Europe TOPCon solar cells market based on the end user (residential, commercial, utility, agriculture, and others). TOPCon solar cells are gaining traction in end-user industries on the back of sustainability concerns and their higher efficiency properties. They are also being used for controlling GHG emissions. Moreover, partnerships and collaborations are expected to play a crucial role in strengthening market position over the coming years, with the companies focusing on bolstering their technological capabilities and gaining a dominant market share in the TOPCon solar cells industry.
Growth/Marketing Strategy: The Europe TOPCon solar cells market has been growing at a rapid pace. The market offers enormous opportunities for existing and emerging market players. Some of the strategies covered in this segment are mergers and acquisitions, product launches, partnerships and collaborations, business expansions, and investments. The strategies preferred by companies to maintain and strengthen their market position primarily include partnerships, agreements, and collaborations.
Competitive Strategy: The key players in the Europe TOPCon solar cells market analyzed and profiled in the study include TOPCon solar cells providers that develop, maintain, and market TOPCon solar cells. Moreover, a detailed competitive benchmarking of the players operating in the Europe TOPCon solar cells market has been done to help the reader understand the ways in which players stack against each other, presenting a clear market landscape. Additionally, comprehensive competitive strategies such as partnerships, agreements, and collaborations will aid the reader in understanding the untapped revenue pockets in the market.
Key Market Players and Competition Synopsis
The companies that are profiled have been selected based on inputs gathered from primary experts and analyzing company coverage, product portfolio, and market penetration.
Some prominent names established in this market are:
|
|
Table of Contents
Executive Summary
Scope of the Study
1. Markets
- 1.1. Industry Outlook
- 1.1.1. Trends: Current and Future
- 1.1.1.1. Emergence of TOPCon Solar Cells as New PV Module Technology in the Solar Industry
- 1.1.1.2. Rising Photovoltaics Demand in Emerging Markets
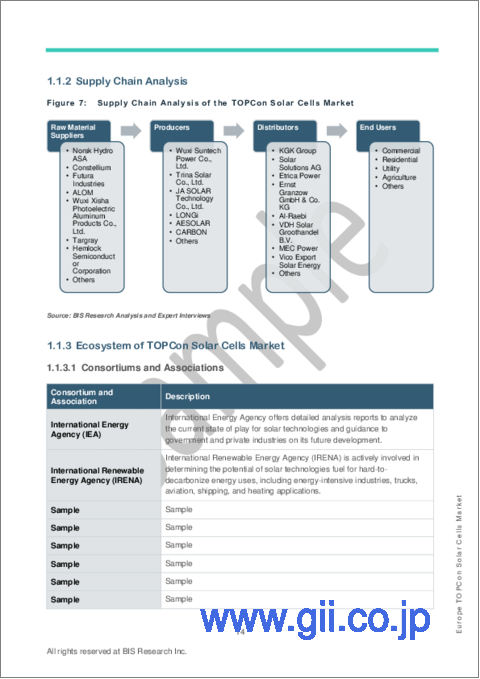
- 1.1.2. Supply Chain Analysis
- 1.1.3. Ecosystem of TOPCon Solar Cells Market
- 1.1.3.1. Consortiums and Associations
- 1.1.3.2. Regulatory/Certification Bodies
- 1.1.3.3. Government Programs
- 1.1.3.4. Programs by Research Institutions and Universities
- 1.1.4. Impact of COVID-19 on the TOPCon Solar Cells Market
- 1.1.5. Comparative Analysis between TOPCon, Heterojunction, and Perovskite Solar Cells
- 1.1.6. Comparative Analysis between TOPCon and PERC Cells
- 1.1.7. Potential Efficiency of Solar Cells and Panels
- 1.1.8. Significant Advancements in TOPCon Solar Cells
- 1.1.9. Recent Investments Made in TOPCon Solar Cells Market
- 1.1.10. Emerging Start-Up Companies of TOPCon Solar Cells Market
- 1.1.1. Trends: Current and Future
- 1.2. Business Dynamics
- 1.2.1. Business Drivers
- 1.2.1.1. Increasing Investment in Renewable Energy Sources for Power Generation
- 1.2.1.2. Flexible Manufacturing Process with TOPCon Technology
- 1.2.1.3. Growing Demand for TOPCON Solar Cells Due to Increased Upper Level of Efficiency
- 1.2.2. Business Challenges
- 1.2.2.1. Increased Need for Silver to Print the Contacts on the Cell
- 1.2.2.2. Constrained Market Acceptance and High Competition
- 1.2.3. Business Strategies
- 1.2.3.1. Product Developments
- 1.2.3.2. Market Developments
- 1.2.4. Corporate Strategies
- 1.2.4.1. Mergers and Acquisitions, Partnerships, Collaborations, and Joint Ventures
- 1.2.5. Business Opportunities
- 1.2.5.1. Growing Research and Development Activities for TOPCon Solar Cells
- 1.2.5.2. Growing Concern for the Environment and Carbon Neutrality Targets
- 1.2.1. Business Drivers
- 1.3. Start-Up Landscape
- 1.3.1. Key Start-Ups in the Ecosystem
2. Regions
- 2.1. Europe
- 2.1.1. Markets
- 2.1.1.1. Key Producers and Suppliers in Europe
- 2.1.1.2. Business Drivers
- 2.1.1.3. Business Challenges
- 2.1.2. Application
- 2.1.2.1. Europe TOPCon Solar Cells Market (by End User), Volume and Value Data
- 2.1.3. Product
- 2.1.3.1. Europe TOPCon Solar Cells Market (by Type), Volume and Value Data
- 2.1.3.2. Europe TOPCon Solar Cells Market (by Installation), Volume and Value Data
- 2.1.4. Europe (by Country)
- 2.1.4.1. Germany
- 2.1.4.1.1. Markets
- 2.1.4.1.1.1. Buyer Attributes
- 2.1.4.1.1.2. Key Producers and Suppliers in Germany
- 2.1.4.1.1.3. Regulatory Landscape
- 2.1.4.1.1.4. Business Drivers
- 2.1.4.1.1.5. Business Challenges
- 2.1.4.1.2. Application
- 2.1.4.1.2.1. Germany TOPCon Solar Cells Market (by End User), Volume and Value Data
- 2.1.4.1.3. Product
- 2.1.4.1.3.1. Germany TOPCon Solar Cells Market (by Type), Volume and Value Data
- 2.1.4.1.3.2. Germany TOPCon Solar Cells Market (by Installation), Volume and Value Data
- 2.1.4.1.1. Markets
- 2.1.4.2. France
- 2.1.4.2.1. Markets
- 2.1.4.2.1.1. Buyer Attributes
- 2.1.4.2.1.2. Key Producers and Suppliers in France
- 2.1.4.2.1.3. Regulatory Landscape
- 2.1.4.2.1.4. Business Drivers
- 2.1.4.2.1.5. Business Challenges
- 2.1.4.2.2. Application
- 2.1.4.2.2.1. France TOPCon Solar Cells Market (by End User), Volume and Value Data
- 2.1.4.2.3. Product
- 2.1.4.2.3.1. France TOPCon Solar Cells Market (by Type), Volume and Value Data
- 2.1.4.2.3.2. France TOPCon Solar Cells Market (by Installation), Volume and Value Data
- 2.1.4.2.1. Markets
- 2.1.4.3. Italy
- 2.1.4.3.1. Market
- 2.1.4.3.1.1. Buyer Attributes
- 2.1.4.3.1.2. Key Producers and Suppliers in Italy
- 2.1.4.3.1.3. Regulatory Landscape
- 2.1.4.3.1.4. Business Drivers
- 2.1.4.3.1.5. Business Challenges
- 2.1.4.3.2. Application
- 2.1.4.3.2.1. Italy TOPCon Solar Cells Market (by End User), Volume and Value Data
- 2.1.4.3.3. Product
- 2.1.4.3.3.1. Italy TOPCon Solar Cells Market (by Type), Volume and Value Data
- 2.1.4.3.3.2. Italy TOPCon Solar Cells Market (by Installation), Volume and Value Data
- 2.1.4.3.1. Market
- 2.1.4.4. Spain
- 2.1.4.4.1. Markets
- 2.1.4.4.1.1. Buyer Attributes
- 2.1.4.4.1.2. Key Producers and Suppliers in Spain
- 2.1.4.4.1.3. Regulatory Landscape
- 2.1.4.4.1.4. Business Drivers
- 2.1.4.4.1.5. Business Challenges
- 2.1.4.4.2. Application
- 2.1.4.4.2.1. Spain TOPCon Solar Cells Market (by End User), Volume and Value Data
- 2.1.4.4.3. Product
- 2.1.4.4.3.1. Spain TOPCon Solar Cells Market (by Type), Volume and Value Data
- 2.1.4.4.3.2. Spain TOPCon Solar Cells Market (by Installation), Volume and Value Data
- 2.1.4.4.1. Markets
- 2.1.4.5. Rest-of-Europe (RoE)
- 2.1.4.5.1. Market
- 2.1.4.5.1.1. Buyer Attributes
- 2.1.4.5.1.2. Key Producers and Suppliers in Rest-of-Europe
- 2.1.4.5.1.3. Business Drivers
- 2.1.4.5.1.4. Business Challenges
- 2.1.4.5.2. Application
- 2.1.4.5.2.1. Rest-of-Europe TOPCon Solar Cells Market (by End User), Volume and Value Data
- 2.1.4.5.3. Product
- 2.1.4.5.3.1. Rest-of-Europe TOPCon Solar Cells Market (by Type), Volume and Value Data
- 2.1.4.5.3.2. Rest-of-Europe TOPCon Solar Cells Market (by Installation), Volume and Value Data
- 2.1.4.5.1. Market
- 2.1.4.1. Germany
- 2.1.1. Markets
- 2.2. U.K.
- 2.2.1. Market
- 2.2.1.1. Buyer Attributes
- 2.2.1.2. Key Producers and Suppliers in the U.K.
- 2.2.1.3. Regulatory Landscape
- 2.2.1.4. Business Drivers
- 2.2.1.5. Business Challenges
- 2.2.2. Application
- 2.2.2.1. U.K. TOPCon Solar Cells Market (by End User), Volume and Value Data
- 2.2.3. Product
- 2.2.3.1. U.K. TOPCon Solar Cells Market (by Type), Volume and Value Data
- 2.2.3.2. U.K. TOPCon Solar Cells Market (by Installation), Volume and Value Data
- 2.2.1. Market
3. Markets - Competitive Benchmarking & Company Profiles
- 3.1. Competitive Benchmarking
- 3.1.1. Competitive Position Matrix
- 3.1.2. Product Matrix for Key Companies (by Type)
- 3.1.3. Market Share Analysis of Key Companies, 2021
- 3.2. Company Profiles
- 3.2.1. AESOLAR
- 3.2.1.1. Company Overview
- 3.2.1.2. Role of AESOLAR in the TOPCon Solar Cells Market
- 3.2.1.2.1. Product Portfolio
- 3.2.1.2.2. Production Sites
- 3.2.1.3. Analyst View
- 3.2.2. CARBON
- 3.2.2.1. Company Overview
- 3.2.2.2. Role of CARBON in the TOPCon Solar Cells Market
- 3.2.2.2.1. Product Portfolio
- 3.2.2.2.2. Production Sites
- 3.2.2.2.3. Business Strategies
- 3.2.2.2.3.1. Market Developments
- 3.2.2.3. Analyst View
- 3.2.3. RENA Technologies GmbH
- 3.2.3.1. Company Overview
- 3.2.3.2. Role of RENA Technologies GmbH in the TOPCon Solar Cells Market
- 3.2.3.2.1. Product Portfolio
- 3.2.3.2.2. Production Sites
- 3.2.3.2.3. Business Strategies
- 3.2.3.2.3.1. Market Developments
- 3.2.3.2.4. Corporate Strategies
- 3.2.3.2.4.1. Mergers, Acquisitions, Partnerships, and Joint Ventures
- 3.2.3.3. Analyst View
- 3.2.4. Exiom Solution SA
- 3.2.4.1. Company Overview
- 3.2.4.2. Role of Exiom Solution SA in the TOPCon Solar Cell Market
- 3.2.4.2.1. Product Portfolio
- 3.2.4.2.2. Production Sites
- 3.2.4.2.3. Business Strategies
- 3.2.4.2.3.1. Product Developments
- 3.2.4.2.4. Corporate Strategies
- 3.2.4.2.4.1. Mergers, Acquisitions, Partnerships, and Joint Ventures
- 3.2.4.3. Analyst View
- 3.2.5. REC Solar Holdings AS
- 3.2.5.1. Company Overview
- 3.2.5.2. Role of REC Solar Holdings AS in the TOPCon Solar Cell Market
- 3.2.5.2.1. Product Portfolio
- 3.2.5.2.2. Production Sites
- 3.2.5.2.3. Business Strategies
- 3.2.5.2.3.1. Product Developments
- 3.2.5.2.4. Corporate Strategies
- 3.2.5.2.4.1. Mergers, Acquisitions, Partnerships, and Joint Ventures
- 3.2.5.3. Analyst View
- 3.2.6. Hanwha QCells
- 3.2.6.1. Company Overview
- 3.2.6.2. Role of Hanwha QCells in the TOPCon Solar Cell Market
- 3.2.6.2.1. Product Portfolio
- 3.2.6.2.2. Production Sites
- 3.2.6.2.3. Business Strategies
- 3.2.6.2.3.1. Market Developments
- 3.2.6.2.4. Corporate Strategies
- 3.2.6.2.4.1. Mergers, Acquisitions, Partnerships, and Joint Ventures
- 3.2.6.3. Analyst View
- 3.2.7. LUXOR SOLAR
- 3.2.7.1. Company Overview
- 3.2.7.2. Role of LUXOR SOLAR in the TOPCon Solar Cell Market
- 3.2.7.2.1. Product Portfolio
- 3.2.7.2.2. Production Sites
- 3.2.7.3. Analyst View
- 3.2.8. FuturaSun srl
- 3.2.8.1. Company Overview
- 3.2.8.2. Role of FuturaSun srl in the TOPCon Solar Cell Market
- 3.2.8.2.1. Product Portfolio
- 3.2.8.2.2. Production Sites
- 3.2.8.2.3. Business Strategies
- 3.2.8.2.3.1. Market Development
- 3.2.8.3. Analyst View
- 3.2.9. SoliTek
- 3.2.9.1. Company Overview
- 3.2.9.2. Role of SoliTek in the TOPCon Solar Cell Market
- 3.2.9.2.1. Product Portfolio
- 3.2.9.2.2. Production Sites
- 3.2.9.3. Analyst View
- 3.2.1. AESOLAR
4. Research Methodology
- 4.1. Primary Data Sources
- 4.2. BIS Data Sources
- 4.3. Assumptions and Limitations

