|
|
市場調査レポート
商品コード
1403552
アジア太平洋のリグノ燃料市場:分析と予測(2023年~2032年)Asia-Pacific Lignofuels Market: Analysis and Forecast, 2023-2032 |
||||||
|
|
|||||||
|
● お客様のご希望に応じて、既存データの加工や未掲載情報(例:国別セグメント)の追加などの対応が可能です。 詳細はお問い合わせください。 |
|||||||


| アジア太平洋のリグノ燃料市場:分析と予測(2023年~2032年) |
|
出版日: 2024年01月08日
発行: BIS Research
ページ情報: 英文 83 Pages
納期: 1~5営業日
|
- 全表示
- 概要
- 図表
- 目次
アジア太平洋のリグノ燃料の市場規模(中国を除く)は、2023年の2億380万米ドルから2032年には4億560万米ドルに達し、予測期間の2023年~2032年のCAGRは7.95%になると予測されています。
継続的な研究開発努力により、リグノ燃料を生産するためのより高度な技術が生み出され、コスト効率と有効性が向上し、市場拡大を後押ししています。フィンランドのNeste Porvoo Refineryのような総合バイオリファイナリーにおける最新技術は、バイオ燃料生産におけるリグノセルロース系原料の利用を実証しています。リグノ燃料産業の急成長を後押ししているのは、世界的に支持されている法律とインセンティブです。例えば米国の再生可能燃料基準(RFS)は、セルロース系バイオ燃料を含む再生可能燃料を輸送用燃料に含めることを義務付けており、リグノ燃料の安定した市場を保証しています。再生可能エネルギー指令(RED II)は、欧州連合(EU)全域における輸送用燃料の再生可能エネルギー目標を定めており、バイオ燃料とリグノ燃料の利用を奨励しています。
| 主要市場統計 | |
|---|---|
| 予測期間 | 2023年~2032年 |
| 2023年の評価 | 2億380万米ドル |
| 2032年予測 | 4億560万米ドル |
| CAGR | 7.95% |
アジア太平洋のリグノ燃料市場とは、農業残渣、林業廃棄物、特定のエネルギー作物などのリグノセルロース系バイオマスを原料とする再生可能燃料の市場を指します。リグノ燃料は先進バイオ燃料としても知られ、従来の化石燃料に代わる実行可能な代替燃料として、温室効果ガスの排出削減に貢献しています。
気候変動への懸念と持続可能なエネルギー源への需要から、アジア太平洋地域全体でリグノ燃料への関心が高まっています。再生可能エネルギーの利用を奨励する政府の取り組みや法律が、この地域の豊富なバイオマス資源とともに、APACリグノ燃料産業の拡大に拍車をかけています。
リグノ燃料は、炭素排出量の削減、エネルギー安全保障の強化、地元で入手可能なバイオマス原料を使用することによる農村部の経済発展の可能性など、さまざまなメリットをもたらします。さらに、リグノ燃料は従来の燃料の直接的な代替燃料として利用できるため、既存のインフラや自動車へのシームレスな移行が可能です。
関心が高まっているとはいえ、APACのリグノ燃料市場は、生産コストの高さ、商業規模の導入の制限、バイオマス変換プロセスにおける技術的ブレークスルーの必要性といった制約に直面しています。しかし、研究開発への投資が増加し、政府の法整備が整えば、APACリグノ燃料市場は大きな成長の可能性を秘めています。
当レポートでは、アジア太平洋のリグノ燃料市場について調査し、市場の概要とともに、エンドユーザー別、原料別、加工技術別、地域別の動向、および市場に参入する企業のプロファイルなどを提供しています。
目次
エグゼクティブサマリー
調査範囲
第1章 市場
- 業界の見通し
- ビジネスダイナミクス
- ビジネスの促進要因
- ビジネスの課題
- 企業戦略
- ビジネスの機会
- スタートアップの情勢
- エコシステムにおける主要なスタートアップ企業
第2章 地域
- 中国
- アジア太平洋と日本
第3章 市場-競合ベンチマーキングと企業プロファイル
- 競合ベンチマーキング
- 競合地位マトリックス
- 企業プロファイル
- Praj Industries
第4章 調査手法
List of Figures
- Figure 1: Lignofuels Market, $Million, 2022, 2023, and 2032
- Figure 2: Lignofuels Market (by End User), $Million, 2022 and 2032
- Figure 3: Lignofuels Market (by Source), $Million, 2022 and 2032
- Figure 4: Lignofuels Market (by Processing Technology), $Million, 2022 and 2032
- Figure 5: Lignofuels Market (by Region), $Million, 2022 and 2032
- Figure 6: Supply Chain Analysis of the Lignofuels Market
- Figure 7: China Lignofuels Market, $Million, 2022-2032
- Figure 8: China Market (by End User), Volume
- Figure 9: China Market (by End User), Value
- Figure 10: China Market (by Source), Volume
- Figure 11: China Market (by Source), Value
- Figure 12: China Market (by Processing Technology), Volume
- Figure 13: China Market (by Processing Technology), Value
- Figure 14: Asia-Pacific and Japan Lignofuels Market, $Million, 2022-2032
- Figure 15: Asia-Pacific and Japan Market (by End User), Volume
- Figure 16: Asia-Pacific and Japan Market (by End User), Value
- Figure 17: Asia-Pacific and Japan Market (by Source), Volume
- Figure 18: Asia-Pacific and Japan Market (by Source), Value
- Figure 19: Asia-Pacific and Japan Market (by Processing Technology), Volume
- Figure 20: Asia-Pacific and Japan Market (by Processing Technology), Value
- Figure 21: Japan Lignofuels Market, $Million, 2022-2032
- Figure 22: Japan Market (by End User), Volume
- Figure 23: Japan Market (by End User), Value
- Figure 24: Japan Market (by Source), Volume
- Figure 25: Japan Market (by Source), Value
- Figure 26: Japan Market (by Processing Technology), Volume
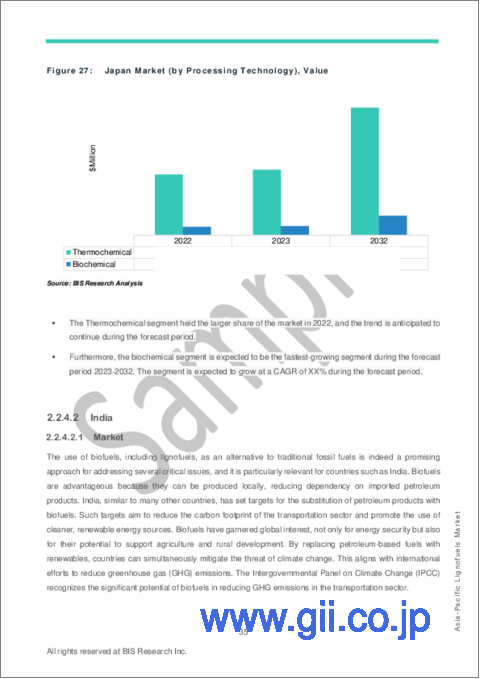
- Figure 27: Japan Market (by Processing Technology), Value
- Figure 28: India Lignofuels Market, $Million, 2022-2032
- Figure 29: India Market (by End User), Volume
- Figure 30: India Market (by End User), Value
- Figure 31: India Market (by Source), Volume
- Figure 32: India Market (by Source), Value
- Figure 33: India Market (by Processing Technology), Volume
- Figure 34: India Market (by Processing Technology), Value
- Figure 35: ASEAN Lignofuels Market, $Million, 2022-2032
- Figure 36: ASEAN Market (by End User), Volume
- Figure 37: ASEAN Market (by End User), Value
- Figure 38: ASEAN Market (by Source), Volume
- Figure 39: ASEAN Market (by Source), Value
- Figure 40: ASEAN Market (by Processing Technology), Volume
- Figure 41: ASEAN Market (by Processing Technology), Value
- Figure 42: Rest-of-Asia-Pacific and Japan Lignofuels Market, $Million, 2022-2032
- Figure 43: Rest-of-Asia-Pacific and Japan Market (by End User), Volume
- Figure 44: Rest-of-Asia-Pacific and Japan Market (by End User), Value
- Figure 45: Rest-of-Asia-Pacific and Japan Market (by Source), Volume
- Figure 46: Rest-of-Asia-Pacific and Japan Market (by Source), Value
- Figure 47: Rest-of-Asia-Pacific and Japan Market (by Processing Technology), Volume
- Figure 48: Rest-of-Asia-Pacific and Japan Market (by Processing Technology), Value
- Figure 49: Research Methodology
- Figure 50: Top-Down and Bottom-Up Approach
- Figure 51: Lignofuels Market: Influencing Factors
- Figure 52: Assumptions and Limitations
List of Tables
- Table 1: Key Product and Market Developments
- Table 2: Key Mergers and Acquisitions, Partnerships, and Joint Ventures
- Table 3: Lignofuels Market (by Region), Mn Liters, 2022-2032
- Table 4: Lignofuels Market (by Region), $Million, 2022-2032
“The Asia-Pacific Lignofuels Market (excluding China) Expected to Reach $405.6 Million by 2032.”
Introduction to Asia-Pacific (APAC) Lignofuels Market
The Asia-Pacific lignofuels market (excluding China) is projected to reach $405.6 million by 2032 from $203.8 million in 2023, growing at a CAGR of 7.95% during the forecast period 2023-2032. Ongoing research and development efforts have resulted in more advanced techniques for producing lignofuels, increasing their cost efficiency and efficacy and thereby pushing market expansion. Modern technologies in integrated biorefineries, such as Finland's Neste Porvoo Refinery, demonstrate the use of lignocellulosic feedstock for biofuel production. Globally supportive legislation and incentives are propelling the lignofuels industry's rapid growth. The Renewable Fuel Standard (RFS) in the United States, for example, requires the inclusion of renewable fuels, including cellulosic biofuels, into transportation fuel, assuring a steady market for lignofuels. The Renewable Energy Directive (RED II) specifies targets for renewable energy in transportation throughout the European Union, encouraging the use of biofuels and lignofuels.
| KEY MARKET STATISTICS | |
|---|---|
| Forecast Period | 2023 - 2032 |
| 2023 Evaluation | $203.8 Million |
| 2032 Forecast | $405.6 Million |
| CAGR | 7.95% |
Market Introduction
The APAC lignofuel market refers to the Asia-Pacific region's market for renewable fuels derived from lignocellulosic biomass sources such as agricultural leftovers, forestry waste, and specific energy crops. Lignofuels, also known as advanced biofuels, are a viable alternative to traditional fossil fuels that help to reduce greenhouse gas emissions.
Concerns about climate change and the demand for sustainable energy sources have led to a rise in interest in lignofuels throughout the Asia-Pacific area. Government initiatives and legislation encouraging the use of renewable energy, together with the region's plentiful biomass resources, have spurred the expansion of the APAC lignofuel industry.
Lignofuels provide various benefits, including lower carbon emissions, increased energy security, and the possibility for rural economic development by employing locally accessible biomass feedstocks. Furthermore, lignofuels can be utilized as a direct substitute for traditional fuels, allowing for a seamless transition in existing infrastructure and automobiles.
Despite increased interest, the APAC lignofuel market is still confronted with constraints such as high production costs, limited commercial-scale implementation, and the need for technological breakthroughs in biomass conversion processes. However, with increased investments in R&D and favorable government legislation, the APAC lignofuel market has great growth potential.
Market Segmentation:
Segmentation 1: by End User
- Automotive
- Aerospace
- Marine
Segmentation 2: by Source
- Dedicated Energy Crops
- Agricultural Residue
- Forest Residue
- Urban Waste
Segmentation 3: by Processing Technology
- Thermochemical
- Biochemical
Segmentation 4: by Region
- Asia-Pacific and Japan - Japan, India, ASEAN, and Rest-of-Asia-Pacific and Japan
How can this report add value to an organization?
Product/Innovation Strategy: The product segment helps the reader to understand the different sources and processing technology involved in the lignofuels market. The source segment has been segmented into dedicated energy crops, agricultural residue, forest residue, and urban waste. The processing technology segment has been segmented into thermochemical and biochemical. Moreover, the study provides the reader with a detailed understanding of the lignofuels market based on end users, including automotive, aerospace, and marine. The increasing adoption of lignofuels in renewable diesel and sustainable aviation fuel is expected to fuel market growth in the future.
Growth/Marketing Strategy: The Asia-Pacific lignofuels market has seen major development by key players operating in the market, such as business expansions, partnerships, collaborations, mergers and acquisitions, and joint ventures. The favored strategy for the companies has been business partnerships to strengthen their position in the lignofuels market.
Competitive Strategy: Key players in the Asia-Pacific lignofuels market analyzed and profiled in the study involve lignofuels manufacturers and the overall ecosystem. Moreover, a detailed competitive benchmarking of the players operating in the lignofuels market has been done to help the reader understand how players stack against each other, presenting a clear market landscape. Additionally, comprehensive competitive strategies such as partnerships, agreements, acquisitions, and collaborations will aid the reader in understanding the untapped revenue pockets in the market.
Table of Contents
Executive Summary
Scope of the Study
1. Market
- 1.1. Industry Outlook
- 1.1.1. Trends: Current and Future
- 1.1.1.1. Market Competitiveness Promoting Commercial Deployment of Low-Cost Lignofuels
- 1.1.1.2. Sustainability Standards Playing a Vital Role in Promoting Lignofuels
- 1.1.2. Supply Chain Analysis
- 1.1.3. Cost Break-Up of Lignofuels (Cellulosic Ethanol) Plant
- 1.1.1. Trends: Current and Future
- 1.2. Business Dynamics
- 1.2.1. Business Drivers
- 1.2.1.1. Government Policies Benefiting Lignofuels
- 1.2.1.2. Collaborative Efforts of Government and Manufacturers for Promoting Sustainable Biofuels
- 1.2.1.3. Availability of Waste and Residues Feedstock to Benefit Lignofuels
- 1.2.2. Business Challenges
- 1.2.2.1. Slower Commercialization of Lignofuels
- 1.2.2.2. Variation in Feedstock Prices Across Regions and Countries
- 1.2.3. Business Strategies
- 1.2.3.1. Product and Market Developments
- 1.2.4. Corporate Strategies
- 1.2.4.1. Mergers and Acquisitions, Partnerships, and Joint Ventures
- 1.2.5. Business Opportunities
- 1.2.5.1. Trade Opportunities to Benefit Lignofuels
- 1.2.5.2. Mandates for Blending of Bioethanol
- 1.2.1. Business Drivers
- 1.3. Start-Up Landscape
- 1.3.1. Key Start-Ups in the Ecosystem
2. Regions
- 2.1. China
- 2.1.1. Market
- 2.1.1.1. Business Drivers
- 2.1.1.2. Business Challenges
- 2.1.2. Application, Volume and Value Data
- 2.1.2.1. End User
- 2.1.3. Product, Volume and Value Data
- 2.1.3.1. Source
- 2.1.3.2. Processing Technology
- 2.1.1. Market
- 2.2. Asia-Pacific and Japan
- 2.2.1. Market
- 2.2.1.1. Business Drivers
- 2.2.1.2. Business Challenges
- 2.2.2. Application, Volume and Value Data
- 2.2.2.1. End User
- 2.2.3. Product, Volume and Value Data
- 2.2.3.1. Source
- 2.2.3.2. Processing Technology
- 2.2.4. Asia-Pacific and Japan (by Country)
- 2.2.4.1. Japan
- 2.2.4.1.1. Market
- 2.2.4.1.2. Application, Volume and Value Data
- 2.2.4.1.2.1. End User
- 2.2.4.1.3. Product, Volume and Value Data
- 2.2.4.1.3.1. Source
- 2.2.4.1.3.2. Processing Technology
- 2.2.4.2. India
- 2.2.4.2.1. Market
- 2.2.4.2.2. Application, Volume and Value Data
- 2.2.4.2.2.1. End User
- 2.2.4.2.3. Product, Volume and Value Data
- 2.2.4.2.3.1. Source
- 2.2.4.2.3.2. Processing Technology
- 2.2.4.3. ASEAN
- 2.2.4.3.1. Market
- 2.2.4.3.2. Application, Volume and Value Data
- 2.2.4.3.2.1. End User
- 2.2.4.3.3. Product, Volume and Value Data
- 2.2.4.3.3.1. Source
- 2.2.4.3.3.2. Processing Technology
- 2.2.4.4. Rest-of-Asia-Pacific and Japan
- 2.2.4.4.1. Market
- 2.2.4.4.2. Application, Volume and Value Data
- 2.2.4.4.2.1. End User
- 2.2.4.4.3. Product, Volume and Value Data
- 2.2.4.4.3.1. Source
- 2.2.4.4.3.2. Processing Technology
- 2.2.4.1. Japan
- 2.2.1. Market
3. Market - Competitive Benchmarking and Company Profiles
- 3.1. Competitive Benchmarking
- 3.1.1. Competitive Position Matrix
- 3.2. Company Profiles
- 3.2.1. Praj Industries
- 3.2.1.1. Overview
- 3.2.1.2. Top Products / Product Portfolio
- 3.2.1.3. Top Competitors
- 3.2.1.4. Target Clients/End User
- 3.2.1.5. Market Share
- 3.2.1.6. Analyst View
- 3.2.1.7. Key Personnel
- 3.2.1. Praj Industries
4. Research Methodology
- 4.1. Primary Data Sources
- 4.2. BIS Data Sources
- 4.3. Assumptions and Limitations