|
|
市場調査レポート
商品コード
1397506
IoB (Internet of Behavior) の世界市場Global Internet of Behavior Market |
||||||
|
|
|||||||


| IoB (Internet of Behavior) の世界市場 |
|
出版日: 2023年11月22日
発行: BCC Research
ページ情報: 英文 109 Pages
納期: 即納可能
|
- 全表示
- 概要
- 図表
- 目次
世界のIoB (Internet of Behavior) の市場規模は、2023年の3,001億米ドルから、予測期間中は23.7%のCAGRで推移し、2028年末には8,693億米ドルの規模に成長すると予測されています。
地域別では、北米地域が2023年の1,093億米ドルから、24.1%のCAGRで推移し、2028年末には3,212億米ドルに達すると予測されています。また、アジア太平洋地域は2023年の765億米ドルから、25.8%のCAGRで推移し、2028年末には2,409億米ドルに達すると予測されています。
当レポートでは、世界のIoB (Internet of Behavior) の市場を調査し、市場の定義・概要、市場影響因子および市場機会の分析、市場規模の推移・予測、各種区分・地域別の詳細分析、技術開発の動向、ESGの展開、競合情勢、主要企業のプロファイルなどをまとめています。
目次
第1章 イントロダクション
第2章 サマリー・ハイライト
- 市場の見通し
- 市場ハイライト
第3章 市場概要
- 概要
- IoB技術の重要な側面
- デバイスとセンサーからのデータ収集
- データの処理と分析
- データ統合と行動に関する洞察
- パーソナライゼーション
- IoBの歴史
- 市場に影響を与えるマクロ経済的要因
- 経済成長とパンデミック後の市場への影響
- ポーターのファイブフォース分析
- 規制の影響
第4章 市場力学
- 概要
- 市場促進要因
- IoTデバイスの数の増加
- 企業によるデータを利用した分析目的のユーザー行動モデルの開発
- 正確なユーザー行動モデルを生成するためのeコマース企業によるIoBソリューションの利用の増加
- 市場の課題
- 規制遵守、データの所有と管理
- データプライバシーとサイバーセキュリティの問題
- 市場機会
- パーソナライズされたマーケティングと広告への需要の増加
- IoBにより、部門間の連携強化が促進され、より適切かつ迅速な意思決定が可能に
第5章 新たな技術と開発
- 概要
- IoBにおける主要な新たな動向と技術
- ビッグデータアナリティクス
- AIと機械学習
- エッジコンピューティング
- IoT
- デジタルツイン
- IoBの発展
第6章 市場内訳:用途別
- 概要
- 広告キャンペーン
- デジタルマーケティング
- コンテンツ配信
- ブランドプロモーション
- その他
第7章 市場内訳:エンドユーザー産業別
- 概要
- BFSI
- ヘルスケア
- 通信・IT
- メディア・エンターテイメント
- 観光・旅行
- 小売・eコマース
- その他
- 教育
- ユーティリティ
- 食品・飲料
- 政府
第8章 市場内訳:企業規模別
- 中小企業
- 大企業
第9章 市場内訳:地域別
- 概要
- 北米
- 欧州
- アジア太平洋
- その他の地域
- 南米
- 中東・アフリカ
第10章 持続可能性:ESGの観点
- 概要
- IoB市場における主要なESG問題
- カーボンフットプリント
- プライバシーとデータセキュリティ
- データの倫理的使用
- IoB市場におけるESGパフォーマンス
- ケーススタディ
- 環境への影響
- 公平性と社会的影響
- 倫理とガバナンスへの影響
- BCCによる総論
第11章 競合情報
- 概要
- ベンダー情勢
第12章 企業プロファイル
- ALTERYX INC.
- AMAZON.COM INC.
- ASSETFLOOW
- AWARE INC.
- CAPILLARY TECHNOLOGIES INDIA LTD.
- COGNITIVESCALE
- COVEO SOLUTIONS INC.
- IBM CORP.
- MASTERCARD INC.
- MICROSOFT CORP.
- NICE LTD.
- OPENTEXT CORP.
- POPULI INC.
- RIVERBED TECHNOLOGY LLC.
- ROVE
- SALESFORCE INC.
- SWEET ANALYTICS LTD.
- TRACEABLE INC.
第13章 付録:頭字語
List of Tables
- Summary Table : Global Market for the Internet of Behavior, by Region, Through 2028
- Table 1 : Global Market for the Internet of Behavior, by Application, Through 2028
- Table 2 : Global Market for the Internet of Behavior, by End-User Industry, Through 2028
- Table 3 : Global Market for the Internet of Behavior, by Enterprise Size, Through 2028
- Table 4 : Global Market for the Internet of Behavior, by Region, Through 2028
- Table 5 : North American Market for the Internet of Behavior, by Country, Through 2028
- Table 6 : North American Market for the Internet of Behavior, by Application, Through 2028
- Table 7 : North American Market for the Internet of Behavior, by End-User Industry, Through 2028
- Table 8 : North American Market for the Internet of Behavior, by Enterprise Size, Through 2028
- Table 9 : European Market for the Internet of Behavior, by Country, Through 2028
- Table 10 : European Market for the Internet of Behavior, by Application, Through 2028
- Table 11 : European Market for the Internet of Behavior, by End-User Industry, Through 2028
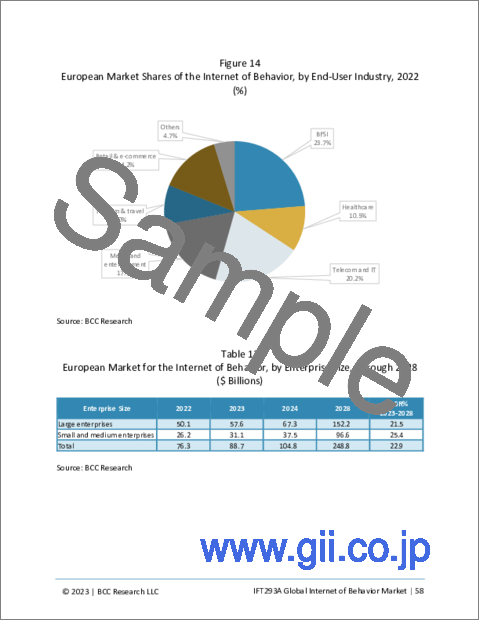
- Table 12 : European Market for the Internet of Behavior, by Enterprise Size, Through 2028
- Table 13 : Asia-Pacific Market for the Internet of Behavior, by Country, Through 2028
- Table 14 : Asia-Pacific Market for the Internet of Behavior, by Application, Through 2028
- Table 15 : Asia-Pacific Market for the Internet of Behavior, by End-User Industry, Through 2028
- Table 16 : Asia-Pacific Market for the Internet of Behavior, by Enterprise Size, Through 2028
- Table 17 : RoW Market for the Internet of Behavior, by Subregion, Through 2028
- Table 18 : RoW Market for the Internet of Behavior, by Application, Through 2028
- Table 19 : RoW Market for the Internet of Behavior, by End-User Industry, Through 2028
- Table 20 : RoW Market for the Internet of Behavior, by Enterprise Size, Through 2028
- Table 21 : Global Market for the Internet of Behavior, Vendor Landscape
- Table 22 : Recent Developments in the Global Internet of Behavior Market, April 2021-June 2023
- Table 23 : Alteryx Inc.: Annual Revenue, 2022
- Table 24 : Alteryx Inc.: Product and Service Portfolio
- Table 25 : Amazon.com Inc.: Annual Revenue, 2022
- Table 26 : Amazon.com Inc.: Product and Service Portfolio
- Table 27 : AssetFloow: Products and Services Portfolio
- Table 28 : Aware Inc.: Annual Revenue, 2022
- Table 29 : Aware Inc.: Product and Service Portfolio
- Table 30 : Capillary Technologies India Ltd.: Product and Service Portfolio
- Table 31 : CognitiveScale: Product and Service Portfolio
- Table 32 : Coveo Solutions Inc.: Annual Revenue, 2022
- Table 33 : Coveo Solutions Inc.: Product and Service Portfolio
- Table 34 : IBM Corp.: Annual Revenue, 2022
- Table 35 : IBM Corp.: Product and Service Portfolio
- Table 36 : Mastercard Inc.: Annual Revenue, 2022
- Table 37 : Mastercard Inc.: Product and Service Portfolio
- Table 38 : Microsoft Corp.: Annual Revenue, 2022
- Table 39 : Microsoft Corp.: Product and Service Portfolio
- Table 40 : NICE Ltd.: Annual Revenue, 2022
- Table 41 : NICE Ltd.: Products/Services Portfolio
- Table 42 : OpenText Corp.: Annual Revenue, 2022
- Table 43 : OpenText Corp.: Product and Service Portfolio
- Table 44 : Populi Inc.: Product and Service Portfolio
- Table 45 : Riverbed Technology LLC: Product and Service Portfolio
- Table 46 : Rove: Product and Service Portfolio
- Table 47 : Salesforce Inc.: Annual Revenue, 2022
- Table 48 : Salesforce Inc.: Product and Service Portfolio
- Table 49 : Sweet Analytics Ltd.: Product and Service Portfolio
- Table 50 : Traceable Inc: Product and Service Portfolio
- Table 51 : Acynoms Used in the Report
List of Figures
Figure A : Research Methodology Used in the Report on the Global Market for the Internet of Behavior
- Summary Figure : Global Market Shares of the Internet of Behavior, by Region, 2022
- Figure 1 : Internet of Things and Internet of Behavior Pyramid
- Figure 2 : Porter's Five Forces Analysis: Global Internet of Behavior Market
- Figure 3 : Internet of Behavior Market Dynamics
- Figure 4 : Global Market Shares of the Internet of Behavior, by Application, 2022
- Figure 5 : Global Market Shares of the Internet of Behavior, by End-User Industry, 2022
- Figure 6 : Global Market Shares of the Internet of Behavior, by Enterprise Size, 2022
- Figure 7 : Global Market Shares of the Internet of Behavior, by Region, 2022
- Figure 8 : North American Market Shares of the Internet of Behavior, by Country, 2022
- Figure 9 : North American Market Shares of the Internet of Behavior, by Application, 2022
- Figure 10 : North American Market Shares of the Internet of Behavior, by End-User Industry, 2022
- Figure 11 : North American Market Shares of the Internet of Behavior, by Enterprise Size, 2022
- Figure 12 : European Market Shares of the Internet of Behavior, by Country, 2022
- Figure 13 : European Market Shares of the Internet of Behavior, by Application, 2022
- Figure 14 : European Market Shares of the Internet of Behavior, by End-User Industry, 2022
- Figure 15 : European Market Shares of the Internet of Behavior, by Enterprise Size, 2022
- Figure 16 : Asia-Pacific Market Shares of the Internet of Behavior, by Country, 2022
- Figure 17 : Asia-Pacific Market Shares of the Internet of Behavior, by Application, 2022
- Figure 18 : Asia-Pacific Market Shares of the Internet of Behavior, by End-User Industry, 2022
- Figure 19 : Asia-Pacific Market Shares of the Internet of Behavior, by Enterprise Size, 2022
- Figure 20 : RoW Market Shares of the Internet of Behavior, by Subregion, 2022
- Figure 21 : RoW Market Shares of the Internet of Behavior, by Application, 2022
- Figure 22 : RoW Market Shares of the Internet of Behavior, by End-User Industry, 2022
- Figure 23 : RoW Market Shares of the Internet of Behavior, by Enterprise Size, 2022
- Figure 24 : Strategies Shares by Companies in the Global Market for the Internet of Behavior, 2020-2023
- Figure 25 : Alteryx Inc.: Annual Revenue, 2021 and 2022
- Figure 26 : Alteryx Inc.: Revenue Share, by Business Unit, 2022
- Figure 27 : Alteryx Inc.: Revenue Share, by Country/Region, 2022
- Figure 28 : Amazon.com Inc.: Annual Revenue, 2021 and 2022
- Figure 29 : Amazon.com Inc.: Revenue Share, by Business Unit, 2022
- Figure 30 : Amazon.com Inc.: Revenue Share, by Country/Region, 2022
- Figure 31 : Aware Inc.: Annual Revenue, 2021 and 2022
- Figure 32 : Aware Inc.: Revenue Share, by Country/Region, 2022
- Figure 33 : Coveo Solutions Inc.: Annual Revenue, 2021 and 2022
- Figure 34 : Coveo Solutions Inc.: Revenue Share, by Business Unit, 2022
- Figure 35 : IBM Corp.: Annual Revenue, 2021 and 2022
- Figure 36 : IBM Corp.: Revenue Share, by Business Unit, 2022
- Figure 37 : IBM Corp.: Revenue Share, by Country/Region, 2022
- Figure 38 : Mastercard Inc.: Annual Revenue, 2021 and 2022
- Figure 39 : Mastercard Inc.: Revenue Share, by Business Unit, 2022
- Figure 40 : Mastercard Inc.: Revenue Share, by Country/Region, 2022
- Figure 41 : Microsoft Corp.: Annual Revenue, 2021 and 2022
- Figure 42 : Microsoft Corp.: Revenue Share, by Business Unit, 2022
- Figure 43 : Microsoft Corp.: Revenue Share, by Country/Region, 2022
- Figure 44 : NICE Ltd.: Annual Revenue, 2021 and 2022
- Figure 45 : NICE Ltd.: Revenue Share, by Business Unit, 2022
- Figure 46 : NICE Ltd.: Revenue Share, by Country/Region, 2022
- Figure 47 : OpenText Corp.: Annual Revenue, 2021 and 2022
- Figure 48 : OpenText Corp.: Revenue Share, by Country/Region, 2022
- Figure 49 : Salesforce Inc.: Annual Revenue, 2021 and 2022
- Figure 50 : Salesforce Inc.: Revenue Share, by Business Unit, 2022
- Figure 51 : Salesforce Inc.: Revenue Share, by Country/Region, 2022
Highlights:
The global market for internet of behavior is expected to increase from $300.1 billion in 2023 to $869.3 billion by the end of 2028, with a compound annual growth rate (CAGR) of 23.7% during the forecast period of 2023-2028.
The North American market for internet of behavior is expected to increase from $109.3 billion in 2023 to $321.2 billion by the end of 2028, with a CAGR of 24.1% during the forecast period of 2023-2028.
The Asia-Pacific market for internet of behavior is expected to increase from $76.5 billion in 2023 to $240.9 billion by the end of 2028, with a CAGR of 25.8% during the forecast period of 2023-2028.
Report Scope:
This report segments the IoB market based on application, end-user industry, enterprise size and geography. The report provides an overview of the global IoB market and analyzes market trends. Using 2022 as the base year, the report provides estimated market data for the forecast period 2023 through 2028.
Revenue forecasts for this period are segmented into -
- Application: Advertising campaign, digital marketing, content delivery and brand promotion.
- End-user industry: BFSI, healthcare, telecom and IT, media and entertainment, tourism and travel, and retail and e-commerce.
- Enterprise size: Small and medium enterprises (SMEs) and large enterprises.
- Region: North America is segmented into the U.S., Canada and Mexico; Europe is segmented into the U.K., France, Germany and Rest of Europe; Asia-Pacific (APAC) is segmented into China, Japan, India and Rest of Asia-Pacific; Rest of World is segmented into Middle East, Africa and South America.
This report has been prepared in a simple, easy-to-understand format, with several tables and charts/figures. The report's scope includes a detailed study of global and regional markets for the IoB, with reasons given for variations in the industry's growth in certain regions. The report examines each IoB technology component, determines its current market size and estimates its future market. The report also analyzes the market from the manufacturers' viewpoint and the final consumer's. Several technical issues arising from the utilization of IoB technologies are discussed and solutions are indicated.
Please note that the report does not include the costs of hardware devices used by IoB applications.
Report Includes:
- 31 data tables and 21 additional tables
- An overview of the global market for the Internet of Behaviors (IoB)
- Estimates of the market size and analyses of market trends, with data from 2022 and 2023, estimates for 2024, and projections of compound annual growth rates (CAGRs) through 2028
- Assessments of factors driving the industry, current trends, market opportunities and restraints, and technological advances that will shape the future marketplace
- Discussions of the current and future market potential and breakdowns of the market by application, enterprise size, end-user industry and region
- Evaluations of technologies such as AI, machine learning, IoT and AR, and discussions on how they drive the market, and the possible practical applications of the IoB
- Analysis of ESG developments
- Discussions of patents, mergers and acquisitions (M&A) and venture funding
- Company profiles of major players within the industry, including CognitiveScale, Riverbed Technology LLC, NICE Ltd., Mastercard Inc., and Sweet Analytics Ltd.
Table of Contents
Chapter 1 Introduction
- Study Goals and Objectives
- Reasons for Doing This Study
- Scope of Report
- Methodology
- Information Sources
- Geographic Breakdown
- Segmentation Breakdown
Chapter 2 Summary and Highlights
- Market Outlook
- Market Highlights
Chapter 3 Market Overview
- Overview
- Key Aspects of the Internet of Behavior Technologies
- Data Collection from Devices and Sensors
- Data Processing and Analysis
- Data Integration and Behavioral Insights
- Personalization
- History of the Internet of Behavior
- Macroeconomic Factors Impacting the Market
- Economic Growth and Post-Pandemic Impact on the Market
- Porter's Five Forces Analysis
- Regulatory Implications
Chapter 4 Market Dynamics
- Overview
- Market Drivers
- Rising Number of the Internet of Things Devices
- Companies Utilizing Data to Develop User Behavior Models for Analytical Purposes
- Increasing Use of the Internet of Behavior Solutions by E-Commerce Companies to Generate Accurate User Behavior Models
- Market Challenges
- Regulatory Compliance, Data Ownership and Control
- Data Privacy and Cybersecurity Issues
- Market Opportunities
- Increasing Demand for Personalized Marketing and Advertising
- Internet of Behavior Promoting Greater Collaboration between Departments for Better and Faster Decision Making
Chapter 5 Emerging Technologies and Developments
- Overview
- Key Emerging Trends and Technologies in the Internet of Behavior
- Big Data Analytics
- Artificial Intelligence and Machine Learning
- Edge Computing
- Internet of Things
- Digital Twin
- Developments in Internet of Behavior
Chapter 6 Market Breakdown by Application
- Overview
- Advertising Campaign
- Digital Marketing
- Content Delivery
- Brand Promotion
- Others
Chapter 7 Market Breakdown by End-User Industry
- Overview
- BFSI
- Healthcare
- Telecom and IT
- Media and Entertainment
- Tourism and Travel
- Retail and E-commerce
- Others
- Education
- Utility
- Food and Beverage
- Government
Chapter 8 Market Breakdown by Enterprise Size
- Introduction
- Small and Medium Enterprises
- Large Enterprises
Chapter 9 Market Breakdown by Region
- Overview
- North American Market Outlook
- European Market Outlook
- Asia-Pacific Market Outlook
- Rest of the World Market Outlook
- South America
- Middle East and Africa
Chapter 10 Sustainability: An ESG Perspective
- Overview
- Key ESG Issues in the Internet of Behavior Market
- Carbon Footprint
- Privacy and Data Security
- Ethical Use of Data
- ESG Performance in the Internet of Behavior Market
- Case Study
- Environmental Impact
- Equitable and Social Impact
- Ethical and Governance Impact
- Concluding Remarks from BCC Research
Chapter 11 Competitive Intelligence
- Overview
- Vendor Landscape
- Recent Developments
Chapter 12 Company Profiles
- ALTERYX INC.
- AMAZON.COM INC.
- ASSETFLOOW
- AWARE INC.
- CAPILLARY TECHNOLOGIES INDIA LTD.
- COGNITIVESCALE
- COVEO SOLUTIONS INC.
- IBM CORP.
- MASTERCARD INC.
- MICROSOFT CORP.
- NICE LTD.
- OPENTEXT CORP.
- POPULI INC.
- RIVERBED TECHNOLOGY LLC.
- ROVE
- SALESFORCE INC.
- SWEET ANALYTICS LTD.
- TRACEABLE INC.