|
|
市場調査レポート
商品コード
1078446
アフリカのB2C Eコマース・決済市場(2022年)Africa B2C E-Commerce and Payment Market 2022 |
||||||
| アフリカのB2C Eコマース・決済市場(2022年) |
|
出版日: 2022年05月25日
発行: yStats.com
ページ情報: 英文 90 Pages
納期: 即日から翌営業日
|
- 全表示
- 概要
- 目次
アフリカにおけるB2C eコマースの売上と、インターネット普及率の急速な拡大が予測されています。現在のアフリカの総小売販売に占めるeコマースの割合はわずかですが、今後の成長が見込まれており、これは、アフリカでのインターネット普及率上昇、アフリカの新興消費者のオンラインショッピング利用に起因しています。
当レポートでは、アフリカのB2C eコマース・決済市場について調査し、インターネット普及率、決済方法、販売シェア、国別の分析などの情報を提供しています。
当レポートで言及している企業
Alibaba, Aliexpress, Amazon.com, ASOS, Avito, B tech, Carrefour, Gumtree, Ikea, Jumia, Kazyon, Kepios, Konga, Lucky Ten, Makro.co.za., OLX, Olx.co.za, Shein, Souq, Takealot, ThankUCash, Ubereats, Wish, Woolworth、など
目次
第1章 管理の概要
第2章 地域
- アフリカのインターネットユーザーおよび世界のインターネットユーザーのシェア(2021年~2025年)
- アフリカのB2Cインターネット普及率:サブリージョン別(2022年2月)
- アフリカのインターネット普及率:国別(エジプト、ケニア、モロッコ、ナイジェリア、南アフリカ)(2021年3月)
- サハラ以南アフリカのモバイルインターネットユーザーとモバイルインターネット普及率(2020年~2025年)
- アフリカのインターネットトラフィックの内訳:デバイス別、国別(エジプト、ガーナ、ケニア、マダガスカル、モロッコ、ナイジェリア、ルワンダ、南アフリカ、トーゴ、チュニジア、ザンビア、アフリカ)、世界との比較(2022年1月~3月)
- 世界の他の地域と比較した、中東・アフリカにおけるmコマースの販売シェア(2021年5月)
- B2C eコマースでの決済方法の内訳:国別(エジプト、ケニア、モロッコ、ナイジェリア、南アフリカ)(2021年)
第3章 南アフリカ
- B2C eコマース市場概要(2021年12月)
- インターネットトラフィックの内訳:デバイス別(2022年第1四半期)
- 国内および越境B2C eコマースの販売内訳(2020年)
- B2C eコマース販売額、および前年比(2018年~2022年)
- 総小売販売に占めるB2C eコマースのシェア(2020年~2022年)、など
第4章 ナイジェリア
- B2C eコマース市場概要と国際比較(2022年4月)
- インターネットトラフィックの内訳:デバイス別(2022年第1四半期)
- 国内および越境B2C eコマースの販売内訳(2020年)
- B2C eコマース売上高(2020年および2021年)
- インターネット普及率、人口の割合(2017年~2021年、2022年1月)、など
第5章 エジプト
- B2C eコマース市場概要と国際比較(2022年4月)
- インターネットトラフィックの内訳:デバイス別(2022年第1四半期)
- 国内および越境B2C eコマースの販売内訳(2020年)
- オンラインショッピングに使用されるプラットフォームタイプの内訳、オンラインショッパーの割合(2021年9月)
- B2C eコマース売上高(2021年~2024年)、など
第6章 モロッコ
- B2C eコマース市場概要と国際比較(2022年4月)
- インターネットトラフィックの内訳:デバイス別(2022年第1四半期)
- 地域および世界と比較したスマートフォンの普及率(2021年)
- 地域および世界と比較した、モバイル経由で購入するオンライン買い物客の割合(2021年)、など
第7章 ケニア
- B2C eコマース市場概要と国際比較(2022年4月
- インターネットトラフィックの内訳:デバイス別(2022年第1四半期)
- B2C eコマース販売(2022年~2024年)
- 総小売販売に占めるB2C eコマースのシェア(2021年)
- インターネット普及率(2017年~2021年、2022年1月)、など
"Africa's B2C E-Commerce growth boosted by mobile technology", says yStats.com.
Rapid B2C E-Commerce sales and Internet penetration growth in Africa projected
E-Commerce currently accounts for a small percentage share of total retail sales in Africa, indicating a major potential for future growth. Most of this growth comes from the rising Internet penetration across all countries in Africa, bringing a higher adoption of online shopping practices by Africa's emerging consumers.
South Africa and Nigeria display a higher card adoption than Egypt, Kenya and Morocco
Africa's largest B2C E-Commerce markets include South Africa and Nigeria, having the highest E-Commerce sales values in comparison to Egypt, Kenya and Morocco. In both countries, the majority of payments were conducted with cards, compared to a bigger share of the total payments stemming from cash-based payments in Egypt, Morocco and Kenya. In terms of local competition, one of the leading companies in these markets includes Nigeria-based Jumia. Jumia and other regional players face strong competition from cross-border online shopping platforms such as AliExpress and Amazon, which are gaining popularity among digital consumers in Africa.
Covered Regions:
Africa.
Companies Mentioned:
Alibaba, Aliexpress, Amazon.com, ASOS, Avito, B tech, Carrefour, Gumtree, Ikea, Jumia, Kazyon, Kepios, Konga, Lucky Ten, Makro.co.za., OLX, Olx.co.za, Shein, Souq, Takealot, ThankUCash, Ubereats, Wish, Woolworth.
Table of Contents
1. Management Summary
2. Regional
- Internet Users in Africa, in millions, and Share of Worldwide Internet Users, in %, 2021e-2025f
- B2C Internet Penetration in Africa, in % of Population, by Sub-Region, February 2022
- Internet Penetration in Africa, by Selected Countries, incl. Egypt, Kenya, Morocco, Nigeria, South Africa, in % of Population, March 2021
- Mobile Internet Users in Sub-Saharan Africa, in millions, and Mobile Internet Penetration, in % of Population, 2020-2025f
- Breakdown of Internet Traffic in Africa, by Device, in %, by Country, incl. Egypt, Ghana, Kenya, Madagascar, Morocco, Nigeria, Rwanda, South Africa, Togo, Tunisia, Zambia, Compared to Africa and Worldwide, January-March 2022
- M-Commerce Sales Share in the Middle East and Africa, in % of Total Retail E-Commerce Sales, Compared to other Regions Worldwide, May 2021
- Breakdown of Payment Methods Used in B2C E-Commerce, in %, by Selected Countries, incl. Egypt, Kenya, Morocco, Nigeria and South Africa, 2021e
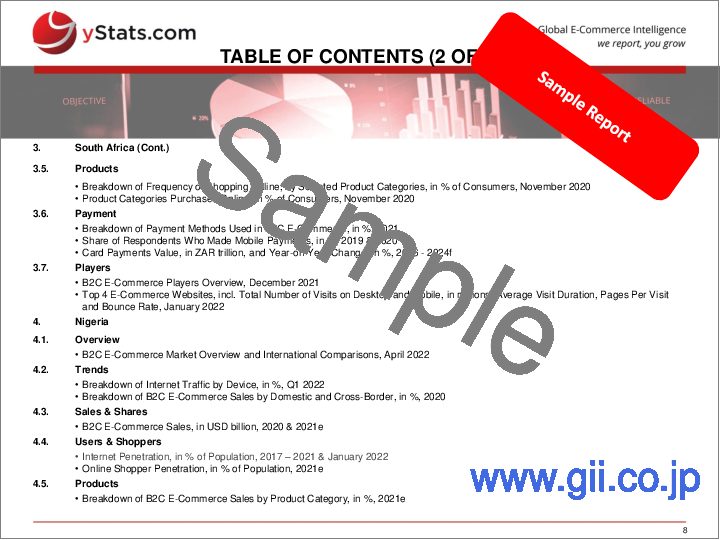
3. South Africa
- B2C E-Commerce Market Overview, December 2021
- Breakdown of Internet Traffic by Device, in %, Q1 2022
- Breakdown of B2C E-Commerce Sales by Domestic and Cross-Border, in %, 2020
- B2C E-Commerce Sales, in ZAR billion, and Year-on-Year Change, in %, 2018 - 2022f
- B2C E-Commerce Share of Total Retail Sales, in %, 2020 - 2022f
- Number of Monthly Internet Users, in millions, 2019 & 2020
- Online Shopper Penetration, in % of Internet Users, 2019 & 2020
- Top Reasons for Accelerated Online Shopping Behavior, in % of Consumers, November 2020
- Breakdown of Frequency of Shopping Online, by Selected Product Categories, in % of Consumers, November 2020
- Product Categories Purchased Online, in % of Consumers, November 2020
- Breakdown of Payment Methods Used in B2C E-Commerce, in %, 2021
- Share of Respondents Who Made Mobile Payments, in %, 2019 & 2020
- Card Payments Value, in ZAR trillion, and Year-on-Year Change, in %, 2016 - 2024f
- B2C E-Commerce Players Overview, December 2021
- Top 4 E-Commerce Websites, incl. Total Number of Visits on Desktop and Mobile, in millions, Average Visit Duration, Pages Per Visit and Bounce Rate, January 2022
4. Nigeria
- B2C E-Commerce Market Overview and International Comparisons, April 2022
- Breakdown of Internet Traffic by Device, in %, Q1 2022
- Breakdown of B2C E-Commerce Sales by Domestic and Cross-Border, in %, 2020
- B2C E-Commerce Sales, in USD billion, 2020 & 2021e
- Internet Penetration, in % of Population, 2017 - 2021 & January 2022
- Online Shopper Penetration, in % of Population, 2021e
- Breakdown of B2C E-Commerce Sales by Product Category, in %, 2021e
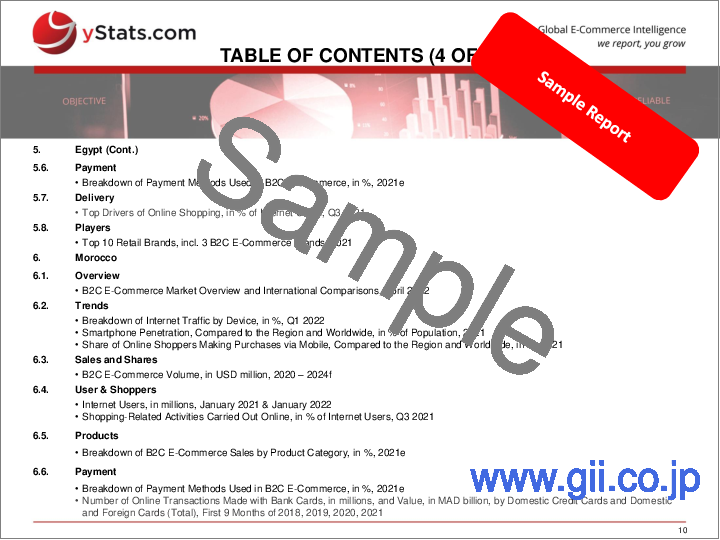
- Breakdown of Payment Methods Used in B2C E-Commerce, in %, 2021e
- Number of Mobile Payment Transactions, in millions, and Value, in NGN billion, 2017 - 2021
- Payment Options Offered by Two Major B2C E-Commerce Players, March 2022
- Delivery Options Offered by Two Major B2C E-Commerce Players, March 2022
- Top 5 Online Shopping Apps, by Downloads in Google Play Store, Apple App Store (iPhone and iPad), March 2022
- Jumia Key Performance Indicators, incl. Annual Active Customers, Orders, GMV, TPV, JumiaPay Transactions, and Loss, 2019 - 2021
5. Egypt
- B2C E-Commerce Market Overview and International Comparisons, April 2022
- Breakdown of Internet Traffic by Device, in %, Q1 2022
- Breakdown of B2C E-Commerce Sales by Domestic and Cross-Border, in %, 2020
- Breakdown of Platform Types Used for Online Shopping, in % of Online Shoppers, September 2021
- B2C E-Commerce Sales, in USD billion, 2021 - 2024f
- Number of Internet Users, in millions, January 2019 - January 2022
- Shopping-Related Activities Carried Out Online, in % of Internet Users, Q3 2021
- Breakdown of B2C E-Commerce Sales by Product Category, in %, 2021e
- Breakdown of Payment Methods Used in B2C E-Commerce, in %, 2021e
- Top Drivers of Online Shopping, in % of Internet Users, Q3 2021
- Top 10 Retail Brands, incl. 3 B2C E-Commerce Brands, 2021
6. Morocco
- B2C E-Commerce Market Overview and International Comparisons, April 2022
- Breakdown of Internet Traffic by Device, in %, Q1 2022
- Smartphone Penetration, Compared to the Region and Worldwide, in % of Population, 2021
- Share of Online Shoppers Making Purchases via Mobile, Compared to the Region and Worldwide, in %, 2021
- B2C E-Commerce Volume, in USD million, 2020 - 2024f
- Number of Online Transactions Made with Bank Cards, in millions, and Value, in MAD billion, by Domestic Credit Cards and Domestic and Foreign Cards (Total), First 9 Months of 2018, 2019, 2020, 2021
- Internet Users, in millions, January 2021 & January 2022
- Shopping-Related Activities Carried Out Online, in % of Internet Users, Q3 2021
- Breakdown of B2C E-Commerce Sales by Product Category, in %, 2021e
- Breakdown of Payment Methods Used in B2C E-Commerce, in %, 2021e
- Top 3 Online Shopping Websites, incl. Total Number of Visits on Desktop and Mobile, in millions, Average Visit Duration, Pages Per Visit and Bounce Rate, February 2022
7. Kenya
- B2C E-Commerce Market Overview and International Comparisons, April 2022
- Breakdown of Internet Traffic by Device, in %, Q1 2022
- B2C E-Commerce Sales, in USD billion, 2022f-2024f
- B2C E-Commerce Share of Total Retail Sales, in %, 2021
- Internet Penetration, in % of Population, 2017 - 2021 & January 2022e
- Internet Users, in millions, January 2021 & January 2022
- Preferred Shopping Method, in % of Respondents, 2021
- Top 3 Online Payment Methods, in % of B2C E-Commerce Payments, 2021
- Mobile Payment Statistics, incl. Number of Transactions, in Millions, Value of Transactions, in KES Billion, Number of Accounts, in Millions, and Number of Agents, in Thousands, 2011 - 2021
- Top 5 Online Shopping Apps, by Downloads from Google Play Store, Apple App Store (iPhone and iPad), March 2022


