|
|
市場調査レポート
商品コード
1068512
BNPL (Buy Now Pay Later) の世界市場:上位企業 (2022年)Global Buy Now Pay Later Top Market Players 2022 |
||||||
| BNPL (Buy Now Pay Later) の世界市場:上位企業 (2022年) |
|
出版日: 2022年04月05日
発行: yStats.com
ページ情報: 英文 49 Pages
納期: 即日から翌営業日
|
- 全表示
- 概要
- 目次
世界のBNPL (Buy Now Pay Later:後払い決済) の取引件数は急速に増加しており、今後5年間はさらに増加すると予想されています。また、他業種からの参入やBNPL専門企業への挑戦により、競争は激化しています。その結果、既存の市場リーダーは消費者金融の枠を超え、新たな銀行・決済・ショッピングサービスを立ち上げています。
当レポートでは、世界のBNPL (Buy Now Pay Later) 市場における上位企業について分析し、世界全体および各地域の市場ランキングの構造や、上位企業3社のプロファイル・業績動向について調査しております。
分析対象地域
アジア、欧州、中東・アフリカ、北アメリカ
当レポートで言及された企業
Affirm、Afterpay、Amazon、Atome、Clearpay、Flipkart、Grab Paylater、Hoolah、Klarna、Mastercard、Monzo、Pace、Paypal、Paytm、Rely、Revolut、Visa
目次
第1章 分析概要
第2章 世界のBNPL企業のランキング
- 世界
- BNPL市場の概要と動向 (2022年3月)
- BNPLサービスの市場シェア:決済手段としてBNPLをサポートする大手eコマースの割合 (2022年3月)
- 北米
- 最も利用されたBNPLプラットフォーム上位3種:BNPLユーザーの割合、2021年5月
- 最も利用されたBNPLアプリ上位6種:BNPLカテゴリのダウンロード件数の割合 (2021年第1四半期)
- 欧州
- 主要BNPLプロバイダーの平均顧客債務 (単位:英ポンド、2020年・2021年)
- 使用されたBNPLサービス:回答者の割合 (2020年・2021年)
- eコマースWebサイト上位100社のうち、KlarnaとAfterpay/Clearpayを受け入れた企業の比率 (2021年5月)
- 使用されたKlarnaサービスの内訳:Klarnaユーザーの割合 (2022年3月)
- アジア太平洋
- B2C eコマースの売上高に対する後払い方式のシェア (2020年・2021年)
- BNPLの売上高・ユーザー数 (単位:10億米ドル/100万人、2021年・2026年)、主要なBNPLプロバイダー (2022年2月)
- 主要BNPLプロバイダーの後払い期間と延滞料 (2022年1月)
- 中東・北アフリカ (MENA)
- 主要BNPLプロバイダーの概要:創業時期、本拠地、従業員数、資金供給額、分割回数、主なパートナーシップ (2021年10月)
第3章 BNPL企業上位3社のプロファイル
- Klarna
- 企業プロファイル (2022年4月)
- ユーザー数 (単位:100万人、2019年~2021年)
- 加盟店の件数 (単位:1,000件、2019年~2021年)
- GMV (流通取引総額) (単位:10億スウェーデンクローナ、2019年~2021年)
- 純営業利益の内訳:主要国・収入カテゴリー別 (2020年・2021年)
- Afterpay
- 企業プロファイル (2022年4月)
- 消費者向け/小売業者向け料金の概要:オーストラリア・米国・英国 (2022年3月)
- アクティブな顧客数:地域別(単位:100万人、2020年度・2021年度)
- アクティブな加盟店数:地域別(単位:1,000件、2020年度・2021年度)
- 基礎的な売上高:地域別、チャネル別・企業別等の内訳 (単位:100万豪ドル、2020年度・2021年度)
- Affirm
- 企業プロファイル (2022年3月)
- 融資消費の概要:加盟店割引率、APR、返済期間、決済頻度、代表的なAOVなど (2022年3月)
- GMV、総収益、取引コスト差引収益・CAGR (単位:100万米ドル、2019年度~2022年度)
- アクティブな加盟店数(単位:1,000件、2020年・2021年の6月・12月)
- アクティブなユーザー数(単位:100万人、2020年・2021年の6月・12月)
Leading BNPL market players ranked in a report by yStats.com
The Buy Now Pay Later (BNPL) transaction volume has been rising rapidly, with still more growth to come over the next five years, according to a forecast cited in the yStats.com report. Competition is becoming more intense, as companies from other sectors join the race and challenge the BNPL specialists. As a result, established market leaders expand beyond consumer lending and launch new banking, payment and shopping services.
Klarna, Afterpay and Affirm are revealed as the world's largest BNPL companies in the yStats.com report. All three boast millions of users, with Klarna leading both by number of consumers and retailers using its services. Sweden-based company also has the largest GMV, rising at a strong double-digit rate between 2020 and 2021. The strongest sales growth, however, was recorded by Australia's Afterpay. In early 2022, this BNPL specialist was acquired by a leading payments company Block (formerly Stripe). Together, Afterpay and Block will create synergies between their respective BNPL and payments offerings. Another fast-growing market leader is Affirm. Due to its cooperation with the leading online retailers, Affirm's services cover more than half of the B2C E-Commerce market in the U.S.
The yStats.com report also lists several regional BNPL providers that are successful in their respective markets. These include Tamara and Tabby in the Middle East, PayLater by Grab in Singapore and by Flipkart in India, among others
Covered Regions:
Asia, Europe, Middle East and Africa, North America.
Companies Mentioned:
Affirm, Afterpay, Amazon , Atome , Clearpay, Flipkart, Grab Paylater, Hoolah, Klarna, Mastercard, Monzo, Pace, Paypal, Paytm, Rely, Revolut, Visa.
Table of Contents
1. Management Summary
2. Global BNPL Player Rankings
- 2.1. Global
- BNPL Market Overview and Trends, March 2022
- Market Shares of BNPL Services, in % of Top E-Commerce Websites Supporting BNPL as a Payment Method, March 2022
- 2.2.North America
- Top 3 BNPL Platforms Used, in % of BNPL Users, May 2021
- Top 6 Most Used BNPL Apps, in % of Downloads in the BNPL Category, Q1 2021
- 2.3. Europe
- Average Customer Debt, in GBP, by Selected BNPL Providers, 2020 & 2021
- BNPL Services Used, in % of Respondents, 2020 & 2021
- Share of Top 100 E-Commerce Websites Accepting Klarna and Afterpay/Clearpay, in %, May 2021
- Breakdown of Klarna Services Used, in % of Klarna Users, March 2022
- 2.4.Asia-Pacific
- Afterpay's Share of B2C E-Commerce Sales, 2020 & 2021e
- BNPL Sales, in USD billion, Number of Users, in million, 2021e & 2026, and Selected BNPL Providers, February 2022
- Tenure and Late Fee of Selected BNPL Providers, January 2022
- 2.5.MENA
- Overview of Selected BNPL Providers, incl. Launch Year, Country of Origin, Number of Employees, Total Funding Received, Installments, and Key Partnerships, October 2021
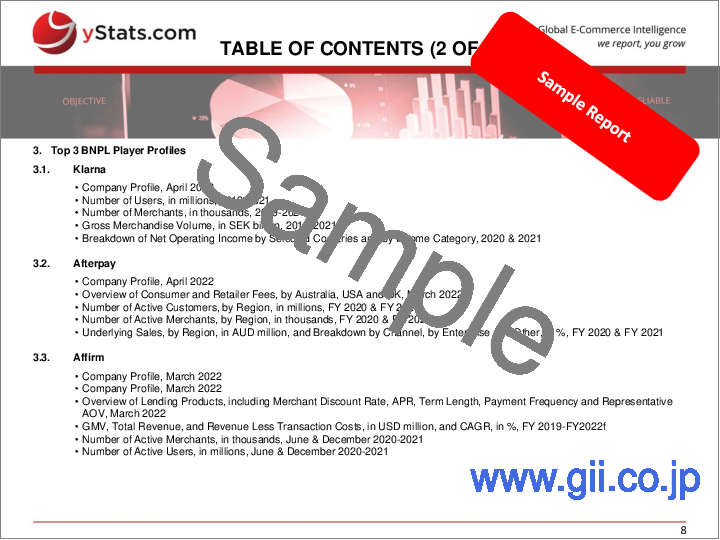
3. Top 3 BNPL Player Profiles
- 3.1.Klarna
- Company Profile, April 2022
- Number of Users, in millions, 2019-2021
- Number of Merchants, in thousands, 2019-2021
- Gross Merchandise Volume, in SEK billion, 2019-2021
- Breakdown of Net Operating Income by Selected Countries and by Income Category, 2020 & 2021
- 3.2.Afterpay
- Company Profile, April 2022
- Overview of Consumer and Retailer Fees, by Australia, USA and UK, March 2022
- Number of Active Customers, by Region, in millions, FY 2020 & FY 2021
- Number of Active Merchants, by Region, in thousands, FY 2020 & FY 2021
- Underlying Sales, by Region, in AUD million, and Breakdown by Channel, by Enterprise and Other, in %, FY 2020 & FY 2021
- 3.3.Affirm
- Company Profile, March 2022
- Company Profile, March 2022
- Overview of Lending Products, including Merchant Discount Rate, APR, Term Length, Payment Frequency and Representative AOV, March 2022
- GMV, Total Revenue, and Revenue Less Transaction Costs, in USD million, and CAGR, in %, FY 2019-FY2022f
- Number of Active Merchants, in thousands, June & December 2020-2021
- Number of Active Users, in millions, June & December 2020-2021


