|
|
市場調査レポート
商品コード
1110378
乾癬治療の世界市場:業界分析、規模、シェア、成長、動向、予測(2022年~2031年)Psoriasis Treatment Market - Global Industry Analysis, Size, Share, Growth, Trends, and Forecast, 2022-2031 |
||||||
|
|
|||||||
|
● お客様のご希望に応じて、既存データの加工や未掲載情報(例:国別セグメント)の追加などの対応が可能です。 詳細はお問い合わせください。 |
|||||||


| 乾癬治療の世界市場:業界分析、規模、シェア、成長、動向、予測(2022年~2031年) |
|
出版日: 2022年06月15日
発行: Transparency Market Research
ページ情報: 英文 200 Pages
納期: 2~10営業日
|
- 全表示
- 概要
- 図表
- 目次
当レポートでは、世界の乾癬治療市場について調査分析し、市場の促進要因や抑制要因、COVID-19の影響、セグメント別の分析と予測、地域別分析、企業プロファイルなどを提供しています。
目次
第1章 序文
第2章 前提と調査手法
第3章 エグゼクティブサマリー:世界の乾癬治療市場
第4章 市場の概要
- イントロダクション
- 医薬品クラスの定義
- 業界の進化/開発
- 概要
- 市場力学
- 促進要因
- 抑制要因
- 機会
- 世界の乾癬治療市場の分析と予測(2017年~2031年)
- 市場収益予測
- 市場規模/出荷台数予測
- ポーターのファイブフォース分析
第5章 主な洞察
- 規制シナリオ:地域/主要国別
- パイプライン分析
- 主な合併と買収
- COVID-19の影響分析
第6章 世界の乾癬治療市場の分析と予測:医薬品クラス別
- イントロダクションと定義
- 主な調査結果/開発
- 市場価値予測:医薬品クラス別(2017年~2031年)
- TNF阻害剤
- インターロイキン阻害剤
- ビタミンD類似体
- コルチコステロイド
- その他
- 市場の魅力分析:医薬品クラス別
第7章 世界の乾癬治療市場の分析と予測:投与経路別
- イントロダクションと定義
- 主な調査結果/開発
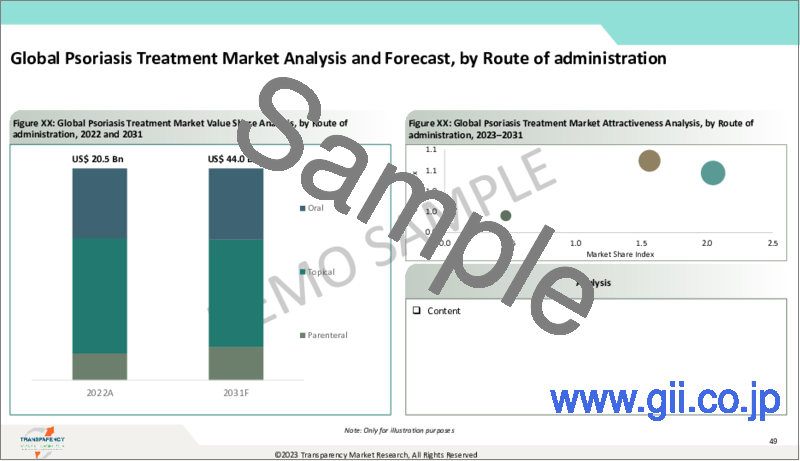
- 市場価値予測:投与経路別(2017年~2031年)
- 経口
- 非経口
- 局所
- 市場の魅力分析:投与経路別
第8章 世界の乾癬治療市場の分析と予測:流通チャネル別
- イントロダクションと定義
- 主な調査結果/開発
- 市場価値予測:流通チャネル別(2017年~2031年)
- 院内薬局
- 小売薬局
- その他
- 市場の魅力分析:流通チャネル別
第9章 世界の乾癬治療市場の分析と予測:地域別
- 主な調査結果
- 市場価値予測:地域別
- 北米
- 欧州
- アジア太平洋地域
- ラテンアメリカ
- 中東・アフリカ
- 市場の魅力分析:地域別
第10章 北米の乾癬治療市場の分析と予測
- イントロダクション
- 主な調査結果
- 市場価値予測:医薬品クラス別(2017年~2031年)
- TNF阻害剤
- インターロイキン阻害剤
- ビタミンD類似体
- コルチコステロイド
- その他
- 市場価値予測:投与経路別(2017年~2031年)
- 経口
- 非経口
- 局所
- 市場価値予測:流通チャネル別(2017年~2031年)
- 院内薬局
- 小売薬局
- その他
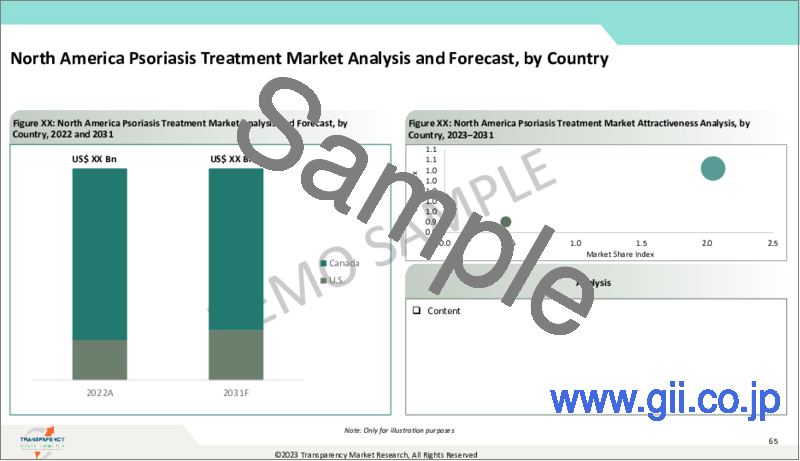
- 市場価値予測:国別(2017年~2031年)
- 米国
- カナダ
- 市場の魅力分析
- 医薬品クラス別
- 投与経路別
- 流通チャネル別
- 国別
第11章 欧州の乾癬治療市場の分析と予測
第12章 アジア太平洋地域の乾癬治療市場の分析と予測
第13章 ラテンアメリカの乾癬治療市場の分析と予測
第14章 中東・アフリカの乾癬治療市場の分析と予測
第15章 競合情勢
- 市場参入企業 - 競合マトリックス(階層・企業規模別)
- 市場シェア分析:企業別(2021年)
- 企業プロファイル
- Amgen, Inc.
- AstraZeneca plc
- AbbVie, Inc.
- Eli Lilly and Company
- Johnson & Johnson
- Biogen, Inc.
- Novartis AG
- Merck & Co., Inc.
- Pfizer, Inc.
- LEO Pharma A/S
- その他の企業
List of Table
- Table 01: Global Psoriasis Treatment Market Size (US$ Mn) Forecast, by Drug Class, 2017-2031
- Table 02: Global Psoriasis Treatment Market Size (US$ Mn) Forecast, by Route of Administration, 2017-2031
- Table 03: Global Psoriasis Treatment Market Size (US$ Mn) Forecast, by Distribution Channel, 2017-2031
- Table 04: Global Psoriasis Treatment Market Value (US$ Mn) Forecast, by Region, 2017-2031
- Table 05: North America Psoriasis Treatment Market Value (US$ Mn) Forecast, by Drug Class, 2017-2031
- Table 06: North America Psoriasis Treatment Market Value (US$ Mn) Forecast, by Route of Administration, 2017-2031
- Table 07: North America Psoriasis Treatment Market Value (US$ Mn) Forecast, by Distribution Channel, 2017-2031
- Table 08: North America Psoriasis Treatment Market Value (US$ Mn) Forecast, by Country, 2017-2031
- Table 09: Europe Psoriasis Treatment Market Value (US$ Mn) Forecast, by Drug Class, 2017-2031
- Table 10: Europe Psoriasis Treatment Market Value (US$ Mn) Forecast, by Route of Administration, 2017-2031
- Table 11: Europe Psoriasis Treatment Market Value (US$ Mn) Forecast, by Distribution Channel, 2017-2031
- Table 12: Europe Psoriasis Treatment Market Value (US$ Mn) Forecast, by Country/Sub-region, 2017-2031
- Table 13: Asia Pacific Psoriasis Treatment Market Value (US$ Mn) Forecast, by Drug Class, 2017-2031
- Table 14: Asia Pacific Psoriasis Treatment Market Value (US$ Mn) Forecast, by Route of Administration, 2017-2031
- Table 15: Asia Pacific Psoriasis Treatment Market Value (US$ Mn) Forecast, by Distribution Channel, 2017-2031
- Table 16: Asia Pacific Psoriasis Treatment Market Value (US$ Mn) Forecast, by Country/Sub-region, 2017-2031
- Table 17: Latin America Psoriasis Treatment Market Value (US$ Mn) Forecast, by Drug Class, 2017-2031
- Table 18: Latin America Psoriasis Treatment Market Value (US$ Mn) Forecast, by Route of Administration, 2017-2031
- Table 19: Latin America Psoriasis Treatment Market Value (US$ Mn) Forecast, by Distribution Channel, 2017-2031
- Table 20: Latin America Psoriasis Treatment Market Value (US$ Mn) Forecast, by Country/Sub-region, 2017-2031
- Table 21: Middle East & Africa Psoriasis Treatment Market Value (US$ Mn) Forecast, by Drug Class, 2017-2031
- Table 22: Middle East & Africa Psoriasis Treatment Market Value (US$ Mn) Forecast, by Route of Administration, 2017-2031
- Table 23: Middle East & Africa Psoriasis Treatment Market Value (US$ Mn) Forecast, by Distribution Channel, 2017-2031
- Table 24: Middle East & Africa Psoriasis Treatment Market Value (US$ Mn) Forecast, by Country/Sub-region, 2017-2031
List of Figures
- Figure 01: Global Psoriasis Treatment Market Snapshot, 2021
- Figure 02: Global Psoriasis Treatment Market Size (US$ Mn) Forecast, 2017-2031
- Figure 04: Global Psoriasis Treatment Market Value Share, by Route of Administration, 2021
- Figure 06: Global Psoriasis Treatment Market Value Share, by Region, 2021
- Figure 03: Global Psoriasis Treatment Market Value Share, by Drug Class, 2021
- Figure 05: Global Psoriasis Treatment Market Value Share, by Distribution Channel, 2021
- Figure 07: Regulatory Approval Process - U.S.
- Figure 08: Regulatory Approval Process - Europe
- Figure 09: Regulatory Approval Process - Japan
- Figure 10: Global Psoriasis Treatment Market Value Share, by Drug Class, 2021 and 2031
- Figure 11: Global Psoriasis Treatment Market Revenue (US$ Mn) and Y-o-Y Growth (%), by TNF Inhibitors, 2017-2031
- Figure 12: Global Psoriasis Treatment Market Revenue (US$ Mn) and Y-o-Y Growth (%), by Interleukin Inhibitors, 2017-2031
- Figure 13: Global Psoriasis Treatment Market Revenue (US$ Mn) and Y-o-Y Growth (%), by Vitamin D Analogs, 2017-2031
- Figure 14: Global Psoriasis Treatment Market Revenue (US$ Mn) and Y-o-Y Growth (%), by Corticosteroids, 2017-2031
- Figure 15: Global Psoriasis Treatment Market Revenue (US$ Mn) and Y-o-Y Growth (%), by Others, 2017-2031
- Figure 16: Global Psoriasis Treatment Market Attractiveness Analysis, by Drug Class, 2022-2031
- Figure 17: Global Psoriasis Treatment Market Value Share, by Route of Administration, 2021 and 2031
- Figure 18: Global Psoriasis Treatment Market Revenue (US$ Mn) and Y-o-Y Growth (%), by Oral, 2017-2031
- Figure 19: Global Psoriasis Treatment Market Revenue (US$ Mn) and Y-o-Y Growth (%), by Parenteral, 2017-2031
- Figure 20: Global Psoriasis Treatment Market Revenue (US$ Mn) and Y-o-Y Growth (%), by Topical, 2017-2031
- Figure 21: Global Psoriasis Treatment Market Attractiveness Analysis, by Route of Administration, 2022-2031
- Figure 22: Global Psoriasis Treatment Market Value Share, by Distribution Channel, 2021 and 2031
- Figure 23: Global Psoriasis Treatment Market Revenue (US$ Mn) and Y-o-Y Growth (%), by Hospital Pharmacies, 2017-2031
- Figure 24: Global Psoriasis Treatment Market Revenue (US$ Mn) and Y-o-Y Growth (%), by Retail Pharmacies, 2017-2031
- Figure 25: Global Psoriasis Treatment Market Revenue (US$ Mn) and Y-o-Y Growth (%), by Others, 2017-2031
- Figure 26: Global Psoriasis Treatment Market Attractiveness Analysis, by Distribution Channel, 2022-2031
- Figure 27: Global Psoriasis Treatment Market Value Share, by Region, 2021 and 2031
- Figure 28: Global Psoriasis Treatment Market Attractiveness Analysis, by Region, 2022-2031
- Figure 29: North America Psoriasis Treatment Market Value (US$ Mn) Forecast and Y-o-Y Growth (%), 2017-2031
- Figure 30: North America Psoriasis Treatment Market Attractiveness Analysis, by Country, 2022-2031
- Figure 31: North America Psoriasis Treatment Market Value Share, by Drug Class, 2021 and 2031
- Figure 32: North America Psoriasis Treatment Market Value Share, by Route of Administration, 2021 and 2031
- Figure 33: North America Psoriasis Treatment Market Value Share, by Distribution Channel, 2021 and 2031
- Figure 34: North America Psoriasis Treatment Market Value Share Analysis, by Country, 2021 and 2031
- Figure 35: North America Psoriasis Treatment Market Attractiveness Analysis, by Drug Class, 2022-2031
- Figure 36: North America Psoriasis Treatment Market Attractiveness Analysis, by Route of Administration, 2022-2031
- Figure 37: North America Psoriasis Treatment Market Attractiveness Analysis, by Distribution Channel, 2022-2031
- Figure 38: Europe Psoriasis Treatment Market Value (US$ Mn) and Y-o-Y Growth (%) Forecast, 2017-2031
- Figure 39: Europe Psoriasis Treatment Market Attractiveness Analysis, by Country/Sub-region, 2022-2031
- Figure 40: Europe Psoriasis Treatment Market Value Share, by Drug Class, 2021 and 2031
- Figure 41: Europe Psoriasis Treatment Market Attractiveness Analysis, by Drug Class, 2022-2031
- Figure 42: Europe Psoriasis Treatment Market Value Share, by Route of Administration, 2021 and 2031
- Figure 43: Europe Psoriasis Treatment Market Attractiveness Analysis, by Route of Administration, 2022-2031
- Figure 44: Europe Psoriasis Treatment Market Value Share, by Distribution Channel, 2021 and 2031
- Figure 45: Europe Psoriasis Treatment Market Attractiveness Analysis, by Distribution Channel, 2022-2031
- Figure 46: Europe Psoriasis Treatment Market Value Share, by Country/Sub-region, 2021 and 2031
- Figure 47: Asia Pacific Psoriasis Treatment Market Value (US$ Mn) Forecast, 2017-2031
- Figure 48: Asia Pacific Psoriasis Treatment Market Attractiveness Analysis, by Country/Sub-region, 2022-2031
- Figure 49: Asia Pacific Psoriasis Treatment Market Value Share, by Drug Class, 2021 and 2031
- Figure 50: Asia Pacific Psoriasis Treatment Market Attractiveness Analysis, by Drug Class, 2022-2031
- Figure 51: Asia Pacific Psoriasis Treatment Market Value Share, by Route of Administration, 2021 and 2031
- Figure 52: Asia Pacific Psoriasis Treatment Market Attractiveness Analysis, by Route of Administration, 2022-2031
- Figure 53: Asia Pacific Psoriasis Treatment Market Value Share, by Distribution Channel, 2021 and 2031
- Figure 54: Asia Pacific Psoriasis Treatment Market Attractiveness Analysis, by Distribution Channel, 2022-2031
- Figure 55: Asia Pacific Psoriasis Treatment Market Value Share, by Country/Sub-region, 2021 and 2031
- Figure 56: Latin America Psoriasis Treatment Market Value (US$ Mn) Forecast and Y-o-Y Growth (%), 2017-2031
- Figure 57: Latin America Psoriasis Treatment Market Attractiveness Analysis, by Country/Sub-region, 2022-2031
- Figure 58: Latin America Psoriasis Treatment Market Value Share, by Drug Class, 2021 and 2031
- Figure 59: Latin America Psoriasis Treatment Market Attractiveness Analysis, by Drug Class, 2022-2031
- Figure 60: Latin America Psoriasis Treatment Market Value Share, by Route of Administration, 2021 and 2031
- Figure 61: Latin America Psoriasis Treatment Market Attractiveness Analysis, by Route of Administration, 2022-2031
- Figure 62: Latin America Psoriasis Treatment Market Value Share, by Distribution Channel, 2021 and 2031
- Figure 63: Latin America Psoriasis Treatment Market Attractiveness Analysis, by Distribution Channel, 2022-2031
- Figure 64: Latin America Psoriasis Treatment Market Value Share Analysis, by Country/Sub-region, 2021 and 2031
- Figure 65: Middle East & Africa Psoriasis Treatment Market Value (US$ Mn) Forecast, 2017-2031
- Figure 66: Middle East & Africa Market Attractiveness Analysis, by Country/Sub-region, 2022-2031
- Figure 67: Middle East & Africa Psoriasis Treatment Market Value Share, by Drug Class, 2021 and 2031
- Figure 68: Middle East & Africa Psoriasis Treatment Market Attractiveness Analysis, by Drug Class, 2022-2031
- Figure 69: Middle East & Africa Psoriasis Treatment Market Value Share, by Route of Administration, 2021 and 2031
- Figure 70: Middle East & Africa Psoriasis Treatment Market Attractiveness Analysis, by Route of Administration, 2022-2031
- Figure 71: Middle East & Africa Psoriasis Treatment Market Value Share, by Distribution Channel, 2021 and 2031
- Figure 72: Middle East & Africa Psoriasis Treatment Market Attractiveness Analysis, by Distribution Channel, 2022-2031
- Figure 73: Middle East & Africa Market Value Share, by Country/Sub-region, 2021 and 2031
The report provides revenue of the global psoriasis treatment market for the period 2017-2031, considering 2021 as the base year and 2031 as the forecast year. The report also provides the compound annual growth rate (CAGR %) of the global psoriasis treatment market from 2022 to 2031.
The report has been prepared after an extensive research. Primary research involved bulk of the research efforts, wherein analysts carried out interviews with key opinion leaders, industry leaders, and opinion makers. Secondary research involved referring to key players' product literature, annual reports, press releases, and relevant documents to understand the psoriasis treatment market.
The report delves into the competitive landscape of the global psoriasis treatment market. Key players operating in the global psoriasis treatment market have been identified and each one of these has been profiled, in terms of various attributes. Company overview, financial standings, recent developments, and SWOT are attributes of players in the global psoriasis treatment market profiled in this report.
Table of Contents
1. Preface
- 1.1. Market Definition and Scope
- 1.2. Market Segmentation
- 1.3. Key Research Objectives
- 1.4. Research Highlights
2. Assumptions and Research Methodology
3. Executive Summary: Global Psoriasis Treatment Market
4. Market Overview
- 4.1. Introduction
- 4.1.1. Drug Class Definition
- 4.1.2. Industry Evolution / Developments
- 4.2. Overview
- 4.3. Market Dynamics
- 4.3.1. Drivers
- 4.3.2. Restraints
- 4.3.3. Opportunities
- 4.4. Global Psoriasis Treatment Market Analysis and Forecast, 2017-2031
- 4.4.1. Market Revenue Projections (US$ Mn)
- 4.4.2. Market Volume/Unit Shipments Projections
- 4.5. Porter's Five Force Analysis
5. Key Insights
- 5.1. Regulatory Scenario by Region/Key Country
- 5.2. Pipeline Analysis
- 5.3. Key Mergers & Acquisitions
- 5.4. COVID-19 Impact Analysis
6. Global Psoriasis Treatment Market Analysis and Forecast, by Drug Class
- 6.1. Introduction & Definition
- 6.2. Key Findings / Developments
- 6.3. Market Value Forecast, by Drug Class, 2017-2031
- 6.3.1. TNF Inhibitors
- 6.3.2. Interleukin Inhibitors
- 6.3.3. Vitamin D Analogs
- 6.3.4. Corticosteroids
- 6.3.5. Others
- 6.4. Market Attractiveness Analysis, by Drug Class
7. Global Psoriasis Treatment Market Analysis and Forecast, by Route of Administration
- 7.1. Introduction & Definition
- 7.2. Key Findings / Developments
- 7.3. Market Value Forecast, by Route of Administration, 2017-2031
- 7.3.1. Oral
- 7.3.2. Parenteral
- 7.3.3. Topical
- 7.4. Market Attractiveness Analysis, by Route of Administration
8. Global Psoriasis Treatment Market Analysis and Forecast, by Distribution Channel
- 8.1. Introduction & Definition
- 8.2. Key Findings / Developments
- 8.3. Market Value Forecast, by Distribution Channel, 2017-2031
- 8.3.1. Hospital Pharmacies
- 8.3.2. Retail Pharmacies
- 8.3.3. Others
- 8.4. Market Attractiveness Analysis, by Distribution Channel
9. Global Psoriasis Treatment Market Analysis and Forecast, by Region
- 9.1. Key Findings
- 9.2. Market Value Forecast, by Region
- 9.2.1. North America
- 9.2.2. Europe
- 9.2.3. Asia Pacific
- 9.2.4. Latin America
- 9.2.5. Middle East & Africa
- 9.3. Market Attractiveness Analysis, by Region
10. North America Psoriasis Treatment Market Analysis and Forecast
- 10.1. Introduction
- 10.1.1. Key Findings
- 10.2. Market Value Forecast, by Drug Class, 2017-2031
- 10.2.1. TNF Inhibitors
- 10.2.2. Interleukin Inhibitors
- 10.2.3. Vitamin D Analogs
- 10.2.4. Corticosteroids
- 10.2.5. Others
- 10.3. Market Value Forecast, by Route of Administration, 2017-2031
- 10.3.1. Oral
- 10.3.2. Parenteral
- 10.3.3. Topical
- 10.4. Market Value Forecast, by Distribution Channel, 2017-2031
- 10.4.1. Hospital Pharmacies
- 10.4.2. Retail Pharmacies
- 10.4.3. Others
- 10.5. Market Value Forecast, by Country, 2017-2031
- 10.5.1. U.S.
- 10.5.2. Canada
- 10.6. Market Attractiveness Analysis
- 10.6.1. By Drug Class
- 10.6.2. By Route of Administration
- 10.6.3. By Distribution Channel
- 10.6.4. By Country
11. Europe Psoriasis Treatment Market Analysis and Forecast
- 11.1. Introduction
- 11.1.1. Key Findings
- 11.2. Market Value Forecast, by Drug Class, 2017-2031
- 11.2.1. TNF Inhibitors
- 11.2.2. Interleukin Inhibitors
- 11.2.3. Vitamin D Analogs
- 11.2.4. Corticosteroids
- 11.2.5. Others
- 11.3. Market Value Forecast, by Route of Administration, 2017-2031
- 11.3.1. Oral
- 11.3.2. Parenteral
- 11.3.3. Topical
- 11.4. Market Value Forecast, by Distribution Channel, 2017-2031
- 11.4.1. Hospital Pharmacies
- 11.4.2. Retail Pharmacies
- 11.4.3. Others
- 11.5. Market Value Forecast, by Country/Sub-region, 2017-2031
- 11.5.1. Germany
- 11.5.2. U.K.
- 11.5.3. France
- 11.5.4. Spain
- 11.5.5. Italy
- 11.5.6. Rest of Europe
- 11.6. Market Attractiveness Analysis
- 11.6.1. By Drug Class
- 11.6.2. By Route of Administration
- 11.6.3. By Distribution Channel
- 11.6.4. By Country/Sub-region
12. Asia Pacific Psoriasis Treatment Market Analysis and Forecast
- 12.1. Introduction
- 12.1.1. Key Findings
- 12.2. Market Value Forecast, by Drug Class, 2017-2031
- 12.2.1. TNF Inhibitors
- 12.2.2. Interleukin Inhibitors
- 12.2.3. Vitamin D Analogs
- 12.2.4. Corticosteroids
- 12.2.5. Others
- 12.3. Market Value Forecast, by Route of Administration, 2017-2031
- 12.3.1. Oral
- 12.3.2. Parenteral
- 12.3.3. Topical
- 12.4. Market Value Forecast, by Distribution Channel, 2017-2031
- 12.4.1. Hospital Pharmacies
- 12.4.2. Retail Pharmacies
- 12.4.3. Others
- 12.5. Market Value Forecast, by Country/Sub-region, 2017-2031
- 12.5.1. China
- 12.5.2. Japan
- 12.5.3. India
- 12.5.4. Australia & New Zealand
- 12.5.5. Rest of Asia Pacific
- 12.6. Market Attractiveness Analysis
- 12.6.1. By Drug Class
- 12.6.2. By Route of Administration
- 12.6.3. By Distribution Channel
- 12.6.4. By Country/Sub-region
13. Latin America Psoriasis Treatment Market Analysis and Forecast
- 13.1. Introduction
- 13.1.1. Key Findings
- 13.2. Market Value Forecast, by Drug Class, 2017-2031
- 13.2.1. TNF Inhibitors
- 13.2.2. Interleukin Inhibitors
- 13.2.3. Vitamin D Analogs
- 13.2.4. Corticosteroids
- 13.2.5. Others
- 13.3. Market Value Forecast, by Route of Administration, 2017-2031
- 13.3.1. Oral
- 13.3.2. Parenteral
- 13.3.3. Topical
- 13.4. Market Value Forecast, by Distribution Channel, 2017-2031
- 13.4.1. Hospital Pharmacies
- 13.4.2. Retail Pharmacies
- 13.4.3. Others
- 13.5. Market Value Forecast, by Country/Sub-region, 2017-2031
- 13.5.1. Brazil
- 13.5.2. Mexico
- 13.5.3. Rest of Latin America
- 13.6. Market Attractiveness Analysis
- 13.6.1. By Drug Class
- 13.6.2. By Route of Administration
- 13.6.3. By Distribution Channel
- 13.6.4. By Country/Sub-region
14. Middle East & Africa Psoriasis Treatment Market Analysis and Forecast
- 14.1. Introduction
- 14.1.1. Key Findings
- 14.2. Market Value Forecast, by Drug Class, 2017-2031
- 14.2.1. TNF Inhibitors
- 14.2.2. Interleukin Inhibitors
- 14.2.3. Vitamin D Analogs
- 14.2.4. Corticosteroids
- 14.2.5. Others
- 14.3. Market Value Forecast, by Route of Administration, 2017-2031
- 14.3.1. Oral
- 14.3.2. Parenteral
- 14.3.3. Topical
- 14.4. Market Value Forecast, by Distribution Channel, 2017-2031
- 14.4.1. Hospital Pharmacies
- 14.4.2. Retail Pharmacies
- 14.4.3. Others
- 14.5. Market Value Forecast, by Country/Sub-region, 2017-2031
- 14.5.1. GCC Countries
- 14.5.2. South Africa
- 14.5.3. Rest of Middle East & Africa
- 14.6. Market Attractiveness Analysis
- 14.6.1. By Drug Class
- 14.6.2. By Route of Administration
- 14.6.3. By Distribution Channel
- 14.6.4. By Country/Sub-region
15. Competition Landscape
- 15.1. Market Player - Competition Matrix (by tier and size of companies)
- 15.2. Market Share Analysis, by Company, 2021
- 15.3. Company Profiles
- 15.3.1. Amgen, Inc.
- 15.3.1.1. Company Overview (HQ, Business Segments, Employee Strength)
- 15.3.1.2. Product Portfolio
- 15.3.1.3. SWOT Analysis
- 15.3.1.4. Strategic Overview
- 15.3.2. AstraZeneca plc
- 15.3.2.1. Company Overview (HQ, Business Segments, Employee Strength)
- 15.3.2.2. Product Portfolio
- 15.3.2.3. SWOT Analysis
- 15.3.2.4. Strategic Overview
- 15.3.3. AbbVie, Inc.
- 15.3.3.1. Company Overview (HQ, Business Segments, Employee Strength)
- 15.3.3.2. Product Portfolio
- 15.3.3.3. SWOT Analysis
- 15.3.3.4. Strategic Overview
- 15.3.4. Eli Lilly and Company
- 15.3.4.1. Company Overview (HQ, Business Segments, Employee Strength)
- 15.3.4.2. Product Portfolio
- 15.3.4.3. SWOT Analysis
- 15.3.4.4. Strategic Overview
- 15.3.5. Johnson & Johnson
- 15.3.5.1. Company Overview (HQ, Business Segments, Employee Strength)
- 15.3.5.2. Product Portfolio
- 15.3.5.3. SWOT Analysis
- 15.3.5.4. Strategic Overview
- 15.3.6. Biogen, Inc.
- 15.3.6.1. Company Overview (HQ, Business Segments, Employee Strength)
- 15.3.6.2. Product Portfolio
- 15.3.6.3. SWOT Analysis
- 15.3.6.4. Strategic Overview
- 15.3.7. Novartis AG
- 15.3.7.1. Company Overview (HQ, Business Segments, Employee Strength)
- 15.3.7.2. Product Portfolio
- 15.3.7.3. SWOT Analysis
- 15.3.7.4. Strategic Overview
- 15.3.8. Merck & Co., Inc.
- 15.3.8.1. Company Overview (HQ, Business Segments, Employee Strength)
- 15.3.8.2. Product Portfolio
- 15.3.8.3. SWOT Analysis
- 15.3.8.4. Strategic Overview
- 15.3.9. Pfizer, Inc.
- 15.3.9.1. Company Overview (HQ, Business Segments, Employee Strength)
- 15.3.9.2. Product Portfolio
- 15.3.9.3. SWOT Analysis
- 15.3.9.4. Strategic Overview
- 15.3.10. LEO Pharma A/S
- 15.3.10.1. Company Overview (HQ, Business Segments, Employee Strength)
- 15.3.10.2. Product Portfolio
- 15.3.10.3. SWOT Analysis
- 15.3.10.4. Strategic Overview
- 15.3.11. Other Players
- 15.3.1. Amgen, Inc.