|
|
市場調査レポート
商品コード
1342639
コンタクトレンズの世界市場 - 世界の産業規模、シェア、動向、機会、予測、2018年~2028年Contact Lens Market- Global Industry Size, Share, Trends, Opportunity, and Forecast, 2018-2028F Segmented By Modality, By Design, By Material Type, By Application, By Distribution Channel, By Region and Competition |
||||||
|
|
|||||||
|
● お客様のご希望に応じて、既存データの加工や未掲載情報(例:国別セグメント)の追加などの対応が可能です。 詳細はお問い合わせください。 |
|||||||


| コンタクトレンズの世界市場 - 世界の産業規模、シェア、動向、機会、予測、2018年~2028年 |
|
出版日: 2023年08月01日
発行: TechSci Research
ページ情報: 英文 306 Pages
納期: 2~3営業日
|
- 全表示
- 概要
- 図表
- 目次
世界のコンタクトレンズ市場は、2022年は196億9,000万米ドルと評価され、予測期間の2024年から2028年にはCAGR 6.69%で成長すると予測されています。
市場の成長は、世界中の人口の間で眼疾患の有病率が高まっていることに起因しています。WHOによると、約22億人が視力障害や失明を患っており、そのうち少なくとも10億人が予防できたはずの、あるいはまだ対処できていない視力障害を抱えています。深刻な眼疾患の有病率の増加は、老眼、緑内障などの疾患を生み出し、その結果、対象人口が増加し、コンタクトレンズに対するより高い市場需要を生み出しています。さらに、世界で推定6,400万人が緑内障に罹患しているが、そのうち中等度または重度の遠方視力障害または失明に罹患しているのは690万人(10.9%)に過ぎないと報告されています。
シリコーンハイドロゲルコンタクトレンズの需要増加
シリコーンハイドロゲルコンタクトレンズの開発において、全コンタクトレンズの約77%がシリコーンハイドロゲル素材を使用していることが調査から示唆されています。シリコーンハイドロゲル素材は、酸素透過性の向上と含水率を組み合わせた高度なソフトレンズで、装用者に最適な快適性と目の健康を提供します。コンタクトレンズ装用者は、コンタクトレンズ装用中に目の過敏性、目の乾燥などの問題に直面します。シリコーンハイドロゲルコンタクトレンズは、通常のコンタクトレンズと比較して、角膜を通して高レベルの酸素透過性を提供するため、長時間装用、連続装用、より快適で簡単といった利点をユーザーに提供します。さらに、ボシュロムのような大手企業は、1日使い捨てコンタクトレンズの「インフューズシリコーンハイドロゲル」シリーズを発売しました。このシリコーンハイドロゲルは、医師や眼科専門家が、以前のレンズ使用による眼アレルギーやレンズアレルギーに悩む患者へのソリューションとして提案しています。2021年11月、米国では、目の健康のリーダーであるクーパービジョンが新しいMyDay1日使い捨て多焦点コンタクトレンズを発表し、その標準的な例外的なシリコーンハイドロゲル1dayファミリーを拡大しました。これらの新しいコンタクトレンズは、革新的な3ADD技術、つまりCooperVision両眼累進システムで作られており、一度のフィッティングで全ての老眼レベルに対応します。この新製品は老眼領域で実証されたツールであり、コンタクトレンズの恩恵を受けることができる幅広い層の患者をカバーすることができます。
コンタクトレンズ分野の研究開発の増加
コンタクトレンズ分野の研究開発が進むにつれ、コンタクトレンズに使用される材料が発見され、さらなる特徴と機能性を持つようになりました。研究開発者は最近、効率的なドラッグデリバリー方法のコンタクトレンズを開発するために、マイクロ流体技術で強化されたコンタクトレンズを開発しました。この技術は、非侵襲的な眼圧モニタリングを可能にし、コンタクトレンズ市場に大きな需要を生み出しています。さらに、大手企業は研究開発への投資を増やし、新たなイノベーションでコンタクトレンズを開発しています。例えば、アルコンは2021年にTOTAL30を発売しました。TOTAL30は水勾配技術で設計された最初で唯一の毎月交換するコンタクトレンズで、米国と欧州市場で非常に受け入れられています。これらの技術ベースのコンタクトレンズは市場でより大きな需要を占めており、予測期間中の市場成長を促進すると予測されています。
化粧品産業がコンタクトレンズに与える影響の増加
コンタクトレンズは視力矯正のためだけでなく、目の色を美しくするためにも使用されています。コンタクトレンズは、ファッションや映画産業の影響により、ファッションアクセサリーとしての需要も増加しています。クーパービジョンのような大手企業は、水色、水色、茶色、紺色、緑色、灰色、ヘーゼル色など様々な色のカラーコンタクトレンズを製造しています。また、ボシュロムは「Lacelle?これらのカラーコンタクトレンズは、微妙な、大胆な、日常的なルックなど、作りたいルックに基づいて着用者の目の色を強調するように設計されており、それによって、ファッショナブルな人々のための最良の選択肢となります。したがって、これらのカラーコンタクトレンズは、目の健康を促進し、着用者にクリアな視界を提供するとともに、コンタクトレンズ市場の成長を刺激しています。もう一つの企業であるMenicon Co., Ltd.は、FRUTTIEシリーズとして、UVカット、高含水率素材、MPCポリマー成分による保湿成分を強化した幅広いカラーコンタクトレンズを発売しました。
人口における屈折障害の増加
近視、老眼、乱視、老眼、その他の眼感染症を含む眼障害の有病率の増加は、コンタクトレンズの需要増加につながっています。近視や老眼のような目の障害の有病率の増加は、携帯電話の使用率の増加、仕事でのスクリーン時間の増加、スクリーン視聴時間の増加など、最近の人々が採用している主なライフスタイルと主に関連しています。在宅勤務の文化が活況を呈しているため、人口の間で視力障害のケースが増加しています。コンタクトレンズはテクノロジーを駆使して設計されており、今の世代によく見られるデジタル眼精疲労の症状にうまく対応しています。また、増加する老年人口は、視力障害を含む目の問題に苦しむ最も一般的な対象人口です。米国検眼協会によると、40歳以上から60歳未満の成人は通常、まぶしさの問題、色覚の変化、ドライアイの問題、読書の問題、仕事中の集中力の低下など、目の問題や問題に直面し始める。また、慢性的な全身疾患、緑内障や黄斑変性症の家族歴、視覚的負荷の高い仕事、甲状腺機能亢進症、高コレステロール血症、関節炎、不安やうつ病などに関連する健康状態などの健康問題を抱えている40歳以上の成人の間では、通常、眼や視覚の問題が観察されます。このように、老人人口の増加は眼市場の成長を刺激し、コンタクトレンズの巨大な需要を生み出し、予測期間の市場成長も後押ししています。
利用可能なカスタマイズ
TechSciリサーチは、与えられた市場データを用いて、企業の特定のニーズに応じてカスタマイズを提供します。レポートでは以下のカスタマイズが可能です。
企業情報
- 追加市場参入企業(最大5社)の詳細分析とプロファイリング
目次
第1章 概要
第2章 調査手法
第3章 エグゼクティブサマリー
第4章 顧客の声
第5章 COVID-19がコンタクトレンズの世界市場に与える影響
第6章 世界のコンタクトレンズ市場の展望、2018年~2028年
- 市場規模・予測
- 金額別
- 市場シェアと予測
- モダリティ別(再使用型、使い捨て型)
- デザイン別(球面、トーリック、多焦点、その他)
- 材料タイプ別(シリコーンハイドロゲル、ハイドロゲル、ガス透過性、その他)
- 用途別(矯正用、治療用、美容用、その他)
- 流通チャネル別(小売店、オンライン、病院・クリニック)
- 地域別
- 企業別(2022年)
- 市場マップ
第7章 北米のコンタクトレンズ市場の展望、2018年~2028年
- 市場規模・予測
- 金額別
- 市場シェアと予測
- モダリティ別
- デザイン別
- 材料タイプ別
- 用途別
- 流通チャネル別
- 国別
- 北米の国別分析
- 米国
- カナダ
- メキシコ
第8章 欧州のコンタクトレンズ市場の展望、2018年~2028年
- 市場規模と予測
- 金額別
- 市場シェアと予測
- モダリティ別
- デザイン別
- 材料タイプ別
- 用途別
- 流通チャネル別
- 国別
- 欧州の国別分析
- ドイツ
- フランス
- 英国
- イタリア
- スペイン
第9章 アジア太平洋のコンタクトレンズ市場の展望、2018年~2028年
- 市場規模・予測
- 金額別
- 市場シェアと予測
- モダリティ別
- デザイン別
- 材料タイプ別
- 用途別
- 流通チャネル別
- 国別
- アジア太平洋の国別分析
- 日本
- 中国
- インド
- 韓国
- オーストラリア
第10章 南米のコンタクトレンズ市場の展望、2018年~2028年
- 市場規模・予測
- 金額別
- 市場シェアと予測
- モダリティ別
- デザイン別
- 材料タイプ別
- 用途別
- 流通チャネル別
- 国別
- 南米の国別分析
- ブラジル
- アルゼンチン
- コロンビア
第11章 中東・アフリカのコンタクトレンズ市場の展望、2018年~2028年
- 市場規模・予測
- 金額別
- 市場シェアと予測
- モダリティ別
- デザイン別
- 材料タイプ別
- 用途別
- 流通チャネル別
- 国別
- 中東・アフリカの国別分析
- 南アフリカ
- サウジアラビア
- アラブ首長国連邦
第12章 市場力学
- 促進要因
- 課題
第13章 市場動向と発展
- 最近の動向
- 合併・買収
- 製品発表
第14章 競合情勢
- Business Overview
- Company Snapshot
- Products & Services
- Financials(As Reported)
- Recent Developments
- SWOT Analysis
- Johnson & Johnson.
- Alcon Inc.
- CopperVision Inc.
- Bausch Health Companies Inc.
- Menicon Co., Ltd.
- EssilorLuxottica S.A.
- Carl Zeiss Meditec AG
- Hoya Corporation
- Seed Co., Ltd
- Contamac Holdings Limited
- X-Cel Specialty Contacts
- SynergEyes Inc.
- STAAR Surgical Company
- Cleriovision, Inc.
- BenQ Materials Corp
第15章 戦略的提言
第16章 調査会社・免責事項
List of Figures
- Figure 1: Global Contact Lenses Market Size, By Value (USD Billion), 2018-2028F
- Figure 2: Number of People with Myopia, 2000, 2010, 2020, 2030
- Figure 3: Global Contact Lenses Market Share, By Modality, By Value, 2018-2028F
- Figure 4: Global Contact Lenses Market Share, By Design, By Value, 2018-2028F
- Figure 5: Global Contact Lenses Market Share, By Material Type, By Value, 2018-2028F
- Figure 6: Global Contact Lenses Market Share, By Application, By Value, 2018-2028F
- Figure 7: Global Contact Lenses Market Share, By Distribution Channel, By Value, 2018-2028F
- Figure 8: Global Contact Lenses Market Share, By Region, By Value, 2018-2028F
- Figure 9: Global Contact Lenses Market Share, By Company, By Value, 2022
- Figure 10: Global Contact Lenses Market Map, By Modality, Market Size (USD Billion) & Growth Rate (%), 2022
- Figure 11: Global Contact Lenses Market Map, By Material Type, Market Size (USD Billion) & Growth Rate (%), 2022
- Figure 12: Global Contact Lenses Market Map, By Application, Market Size (USD Billion) & Growth Rate (%), 2022
- Figure 13: Global Contact Lenses Market Map, By Distribution Channel, Market Size (USD Billion) & Growth Rate (%), 2022
- Figure 14: Global Contact Lenses Market Map, By Region, Market Size (USD Billion) & Growth Rate (%), 2022
- Figure 15: North America Contact Lenses Market Size, By Value (USD Billion), 2018-2028F
- Figure 16: Crude prevalence of vision loss, 2020
- Figure 17: North America Contact Lenses Market Share, By Modality, By Value, 2018-2028F
- Figure 18: North America Contact Lenses Market Share, By Design, By Value, 2018-2028F
- Figure 19: North America Contact Lenses Market Share, By Material Type, By Value, 2018-2028F
- Figure 20: North America Contact Lenses Market Share, By Application, By Value, 2018-2028F
- Figure 21: North America Contact Lenses Market Share, By Distribution Channel, By Value, 2018-2028F
- Figure 22: North America Contact Lenses Market Share, By Country, By Value, 2018-2028F
- Figure 23: United States Contact Lenses Market Size, By Value (USD Billion), 2018-2028F
- Figure 24: Commonly Observed Eye Related Diseases in the United States, 2022 (In Millions)
- Figure 25: United States Contact Lenses Market Share, By Modality, By Value, 2018-2028F
- Figure 26: United States Contact Lenses Market Share, By Design, By Value, 2018-2028F
- Figure 27: United States Contact Lenses Market Share, By Material Type, By Value, 2018-2028F
- Figure 28: United States Contact Lenses Market Share, By Application, By Value, 2018-2028F
- Figure 29: United States Contact Lenses Market Share, By Distribution Channel, By Value, 2018-2028F
- Figure 30: Canada Contact Lenses Market Size, By Value (USD Billion), 2018-2028F
- Figure 31: Prevalence of Vision Loss in Canada, All Ages, Males & Females, 2020
- Figure 32: Canada Contact Lenses Market Share, By Modality, By Value, 2018-2028F
- Figure 33: Canada Contact Lenses Market Share, By Design, By Value, 2018-2028F
- Figure 34: Canada Contact Lenses Market Share, By Material Type, By Value, 2018-2028F
- Figure 35: Canada Contact Lenses Market Share, By Application, By Value, 2018-2028F
- Figure 36: Canada Contact Lenses Market Share, By Distribution Channel, By Value, 2018-2028F
- Figure 37: Mexico Contact Lenses Market Size, By Value (USD Billion), 2018-2028F
- Figure 38: People Aged 20-79 Years with Diabetes in Mexico, in 1,000s
- Figure 39: Mexico Contact Lenses Market Share, By Modality, By Value, 2018-2028F
- Figure 40: Mexico Contact Lenses Market Share, By Design, By Value, 2018-2028F
- Figure 41: Mexico Contact Lenses Market Share, By Material Type, By Value, 2018-2028F
- Figure 42: Mexico Contact Lenses Market Share, By Application, By Value, 2018-2028F
- Figure 43: Mexico Contact Lenses Market Share, By Distribution Channel, By Value, 2018-2028F
- Figure 44: Europe Contact Lenses Market Size, By Value (USD Billion), 2018-2028F
- Figure 45: Share of individuals who wear contact lenses in selected European countries, 2020
- Figure 46: Europe Contact Lenses Market Share, By Modality, By Value, 2018-2028F
- Figure 47: Europe Contact Lenses Market Share, By Design, By Value, 2018-2028F
- Figure 48: Europe Contact Lenses Market Share, By Material Type, By Value, 2018-2028F
- Figure 49: Europe Contact Lenses Market Share, By Application, By Value, 2018-2028F
- Figure 50: Europe Contact Lenses Market Share, By Distribution Channel, By Value, 2018-2028F
- Figure 51: Europe Contact Lenses Market Share, By Country, By Value, 2018-2028F
- Figure 52: Germany Contact Lenses Market Size, By Value (USD Billion), 2018-2028F
- Figure 53: Germany Research & Development Expenditure as a Percentage of GDP
- Figure 54: Germany Contact Lenses Market Share, By Modality, By Value, 2018-2028F
- Figure 55: Germany Contact Lenses Market Share, By Design, By Value, 2018-2028F
- Figure 56: Germany Contact Lenses Market Share, By Material Type, By Value, 2018-2028F
- Figure 57: Germany Contact Lenses Market Share, By Application, By Value, 2018-2028F
- Figure 58: Germany Contact Lenses Market Share, By Distribution Channel, By Value, 2018-2028F
- Figure 59: France Contact Lenses Market Size, By Value (USD Billion), 2018-2028F
- Figure 60: Number of Individuals Affected with Vision Loss in France, By Severity, 2020
- Figure 61: France Contact Lenses Market Share, By Modality, By Value, 2018-2028F
- Figure 62: France Contact Lenses Market Share, By Design, By Value, 2018-2028F
- Figure 63: France Contact Lenses Market Share, By Material Type, By Value, 2018-2028F
- Figure 64: France Contact Lenses Market Share, By Application, By Value, 2018-2028F
- Figure 65: France Contact Lenses Market Share, By Distribution Channel, By Value, 2018-2028F
- Figure 66: United Kingdom Contact Lenses Market Size, By Value (USD Billion), 2018-2028F
- Figure 67: Annual Expenditure on Health in United Kingdom, 2017-2021 (USD Million)
- Figure 68: United Kingdom Contact Lenses Market Share, By Modality, By Value, 2018-2028F
- Figure 69: United Kingdom Contact Lenses Market Share, By Design, By Value, 2018-2028F
- Figure 70: United Kingdom Contact Lenses Market Share, By Material Type, By Value, 2018-2028F
- Figure 71: United Kingdom Contact Lenses Market Share, By Application, By Value, 2018-2028F
- Figure 72: United Kingdom Contact Lenses Market Share, By Distribution Channel, By Value, 2018-2028F
- Figure 73: Italy Contact Lenses Market Size, By Value (USD Billion), 2018-2028F
- Figure 74: Share of Individuals with Vision Loss in Italy, 2020, By Severity
- Figure 75: Italy Contact Lenses Market Share, By Modality, By Value, 2018-2028F
- Figure 76: Italy Contact Lenses Market Share, By Design, By Value, 2018-2028F
- Figure 77: Italy Contact Lenses Market Share, By Material Type, By Value, 2018-2028F
- Figure 78: Italy Contact Lenses Market Share, By Application, By Value, 2018-2028F
- Figure 79: Italy Contact Lenses Market Share, By Distribution Channel, By Value, 2018-2028F
- Figure 80: Spain Contact Lenses Market Size, By Value (USD Billion), 2018-2028F
- Figure 81: Mean Waiting Time for Cataract Surgery from Specialist Assessment to Treatment in Spain, 2018-2021 (In Days)
- Figure 82: Spain Contact Lenses Market Share, By Modality, By Value, 2018-2028F
- Figure 83: Spain Contact Lenses Market Share, By Design, By Value, 2018-2028F
- Figure 84: Spain Contact Lenses Market Share, By Material Type, By Value, 2018-2028F
- Figure 85: Spain Contact Lenses Market Share, By Application, By Value, 2018-2028F
- Figure 86: Spain Contact Lenses Market Share, By Distribution Channel, By Value, 2018-2028F
- Figure 87: Asia Pacific Contact Lenses Market Size, By Value (USD Billion), 2018-2028F
- Figure 88: Asian Countries by population (in Billion), 2023
- Figure 89: Asia Pacific Contact Lenses Market Share, By Modality, By Value, 2018-2028F
- Figure 90: Asia Pacific Contact Lenses Market Share, By Design, By Value, 2018-2028F
- Figure 91: Asia Pacific Contact Lenses Market Share, By Material Type, By Value, 2018-2028F
- Figure 92: Asia Pacific Contact Lenses Market Share, By Application, By Value, 2018-2028F
- Figure 93: Asia Pacific Contact Lenses Market Share, By Distribution Channel, By Value, 2018-2028F
- Figure 94: Asia Pacific Contact Lenses Market Share, By Country, By Value, 2018-2028F
- Figure 95: Japan Contact Lenses Market Size, By Value (USD Billion), 2018-2028F
- Figure 96: Share of Geriatric Population as a Share of Total Population in Japan
- Figure 97: Japan Contact Lenses Market Share, By Modality, By Value, 2018-2028F
- Figure 98: Japan Contact Lenses Market Share, By Design, By Value, 2018-2028F
- Figure 99: Japan Contact Lenses Market Share, By Material Type, By Value, 2018-2028F
- Figure 100: Japan Contact Lenses Market Share, By Application, By Value, 2018-2028F
- Figure 101: Japan Contact Lenses Market Share, By Distribution Channel, By Value, 2018-2028F
- Figure 102: China Contact Lenses Market Size, By Value (USD Billion), 2018-2028F
- Figure 103: Number of Ophthalmic Outpatients in China, 2018-2021 (in Millions)
- Figure 104: China Contact Lenses Market Share, By Modality, By Value, 2018-2028F
- Figure 105: China Contact Lenses Market Share, By Design, By Value, 2018-2028F
- Figure 106: China Contact Lenses Market Share, By Material Type, By Value, 2018-2028F
- Figure 107: China Contact Lenses Market Share, By Application, By Value, 2018-2028F
- Figure 108: China Contact Lenses Market Share, By Distribution Channel, By Value, 2018-2028F
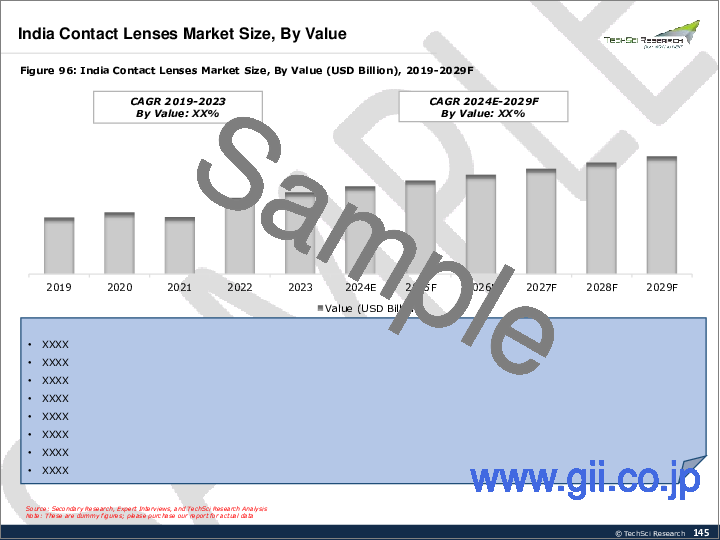
- Figure 109: India Contact Lenses Market Size, By Value (USD Billion), 2018-2028F
- Figure 110: Prevalence of Myopia in 5-15-year-old Urban Children in India
- Figure 111: India Contact Lenses Market Share, By Modality, By Value, 2018-2028F
- Figure 112: India Contact Lenses Market Share, By Design, By Value, 2018-2028F
- Figure 113: India Contact Lenses Market Share, By Material Type, By Value, 2018-2028F
- Figure 114: India Contact Lenses Market Share, By Application, By Value, 2018-2028F
- Figure 115: India Contact Lenses Market Share, By Distribution Channel, By Value, 2018-2028F
- Figure 116: South Korea Contact Lenses Market Size, By Value (USD Billion), 2018-2028F
- Figure 117: Number of Registered People with Eye Related Diseases in South Korea, 2018-2022
- Figure 118: South Korea Contact Lenses Market Share, By Modality, By Value, 2018-2028F
- Figure 119: South Korea Contact Lenses Market Share, By Design, By Value, 2018-2028F
- Figure 120: South Korea Contact Lenses Market Share, By Material Type, By Value, 2018-2028F
- Figure 121: South Korea Contact Lenses Market Share, By Application, By Value, 2018-2028F
- Figure 122: South Korea Contact Lenses Market Share, By Distribution Channel, By Value, 2018-2028F
- Figure 123: Australia Contact Lenses Market Size, By Value (USD Billion), 2018-2028F
- Figure 124: People Aged 20-79 Years with Diabetes in Australia, in 1,000s
- Figure 125: Australia Contact Lenses Market Share, By Modality, By Value, 2018-2028F
- Figure 126: Australia Contact Lenses Market Share, By Design, By Value, 2018-2028F
- Figure 127: Australia Contact Lenses Market Share, By Material Type, By Value, 2018-2028F
- Figure 128: Australia Contact Lenses Market Share, By Application, By Value, 2018-2028F
- Figure 129: Australia Contact Lenses Market Share, By Distribution Channel, By Value, 2018-2028F
- Figure 130: South America Contact Lenses Market Size, By Value (USD Billion), 2018-2028F
- Figure 131: Share of Individuals with Vision Impairment in South America, (in Million), 2020
- Figure 132: South America Contact Lenses Market Share, By Modality, By Value, 2018-2028F
- Figure 133: South America Contact Lenses Market Share, By Design, By Value, 2018-2028F
- Figure 134: South America Contact Lenses Market Share, By Material Type, By Value, 2018-2028F
- Figure 135: South America Contact Lenses Market Share, By Application, By Value, 2018-2028F
- Figure 136: South America Contact Lenses Market Share, By Distribution Channel, By Value, 2018-2028F
- Figure 137: South America Contact Lenses Market Share, By Country, By Value, 2018-2028F
- Figure 138: Brazil Contact Lenses Market Size, By Value (USD Billion), 2018-2028F
- Figure 139: Government Health Expenditure in Brazil in 2021, By Area, (Square Unit)
- Figure 140: Brazil Contact Lenses Market Share, By Modality, By Value, 2018-2028F
- Figure 141: Brazil Contact Lenses Market Share, By Design, By Value, 2018-2028F
- Figure 142: Brazil Contact Lenses Market Share, By Material Type, By Value, 2018-2028F
- Figure 143: Brazil Contact Lenses Market Share, By Application, By Value, 2018-2028F
- Figure 144: Brazil Contact Lenses Market Share, By Distribution Channel, By Value, 2018-2028F
- Figure 145: Argentina Contact Lenses Market Size, By Value (USD Billion), 2018-2028F
- Figure 146: Prevalence of Vision Loss in Argentina, All Ages, Males & Females, 2020
- Figure 147: Argentina Contact Lenses Market Share, By Modality, By Value, 2018-2028F
- Figure 148: Argentina Contact Lenses Market Share, By Design, By Value, 2018-2028F
- Figure 149: Argentina Contact Lenses Market Share, By Material Type, By Value, 2018-2028F
- Figure 150: Argentina Contact Lenses Market Share, By Application, By Value, 2018-2028F
- Figure 151: Argentina Contact Lenses Market Share, By Distribution Channel, By Value, 2018-2028F
- Figure 152: Colombia Contact Lenses Market Size, By Value (USD Billion), 2018-2028F
- Figure 153: People Aged 20-79 Years with Diabetes in Colombia, in 1,000s (2000, 2011, 2021, 2030, 2045)
- Figure 154: Colombia Contact Lenses Market Share, By Modality, By Value, 2018-2028F
- Figure 155: Colombia Contact Lenses Market Share, By Design, By Value, 2018-2028F
- Figure 156: Colombia Contact Lenses Market Share, By Material Type, By Value, 2018-2028F
- Figure 157: Colombia Contact Lenses Market Share, By Application, By Value, 2018-2028F
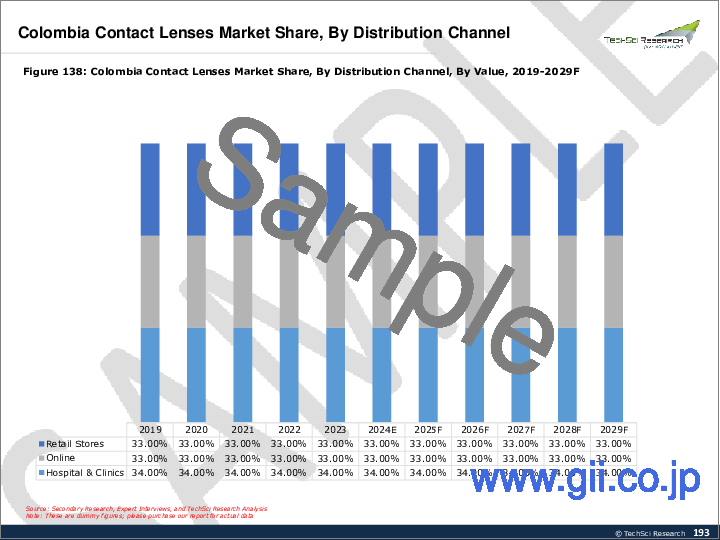
- Figure 158: Colombia Contact Lenses Market Share, By Distribution Channel, By Value, 2018-2028F
- Figure 159: Middle East & Africa Contact Lenses Market Size, By Value (USD Billion), 2018-2028F
- Figure 160: Prevalence of Diabetes in Middle East & Africa, 2021
- Figure 161: Middle East & Africa Contact Lenses Market Share, By Modality, By Value, 2018-2028F
- Figure 162: Middle East & Africa Contact Lenses Market Share, By Design, By Value, 2018-2028F
- Figure 163: Middle East & Africa Contact Lenses Market Share, By Material Type, By Value, 2018-2028F
- Figure 164: Middle East & Africa Contact Lenses Market Share, By Application, By Value, 2018-2028F
- Figure 165: Middle East & Africa Contact Lenses Market Share, By Distribution Channel, By Value, 2018-2028F
- Figure 166: Middle East & Africa Contact Lenses Market Share, By Country, By Value, 2018-2028F
- Figure 167: South Africa Contact Lenses Market Size, By Value (USD Billion), 2018-2028F
- Figure 168: Prevalence of Vision Loss in South Africa, All Ages, Males & Females, 2020
- Figure 169: South Africa Contact Lenses Market Share, By Modality, By Value, 2018-2028F
- Figure 170: South Africa Contact Lenses Market Share, By Design, By Value, 2018-2028F
- Figure 171: South Africa Contact Lenses Market Share, By Material Type, By Value, 2018-2028F
- Figure 172: South Africa Contact Lenses Market Share, By Application, By Value, 2018-2028F
- Figure 173: South Africa Contact Lenses Market Share, By Distribution Channel, By Value, 2018-2028F
- Figure 174: South Arabia Contact Lenses Market Size, By Value (USD Billion), 2018-2028F
- Figure 175: Preference of Contact Lens Color By Women in Saudi Arabia, 2022
- Figure 176: South Arabia Contact Lenses Market Share, By Modality, By Value, 2018-2028F
- Figure 177: South Arabia Contact Lenses Market Share, By Design, By Value, 2018-2028F
- Figure 178: South Arabia Contact Lenses Market Share, By Material Type, By Value, 2018-2028F
- Figure 179: South Arabia Contact Lenses Market Share, By Application, By Value, 2018-2028F
- Figure 180: South Arabia Contact Lenses Market Share, By Distribution Channel, By Value, 2018-2028F
- Figure 181: UAE Contact Lenses Market Size, By Value (USD Billion), 2018-2028F
- Figure 182: Outpatient Healthcare Expenditure in UAE, 2017-2022 (USD Billion)
- Figure 183: UAE Contact Lenses Market Share, By Modality, By Value, 2018-2028F
- Figure 184: UAE Contact Lenses Market Share, By Design, By Value, 2018-2028F
- Figure 185: UAE Contact Lenses Market Share, By Material Type, By Value, 2018-2028F
- Figure 186: UAE Contact Lenses Market Share, By Application, By Value, 2018-2028F
- Figure 187: UAE Contact Lenses Market Share, By Distribution Channel, By Value, 2018-2028F
- Figure 188: Number of People with Ocular Conditions in the United States, (in Millions), 2020
- Figure 189: Estimated Share of Population Aged 65+ in 2021, By Country/Area
Global Contact Lens market was valued at USD 19.69 billion in 2022 and is predicted to grow at a CAGR of 6.69% in the forecast period 2024-2028. Growth in the market can be ascribed to the growing prevalence of eye diseases among the population across the world. According to WHO, around 2.2 billion people have vision impairment or blindness, of whom at least 1 billion have vision impairment that could have been prevented or is yet to be addressed. The rising prevalence of severe eye conditions is giving rise to conditions including presbyopia, glaucoma, etc., which in turn, is resulting in an increased target population, creating a higher market demand for contact lenses. Moreover, an estimated 64 million people globally have glaucoma, of which only 6.9 million (10.9%) are reported to have moderate or severe distance vision impairment or blindness resulting from more severe forms of the condition worldwide.
Rising Demand for Silicone Hydrogel Contact Lenses
Researchers suggest that among all contact lenses, almost 77% of contact lenses use Silicone hydrogel materials in the development of contact lenses. Silicone hydrogel materials are advanced soft lenses that combine enhanced oxygen permeability with water content, providing optimal comfort and eye health for the wearer. Contact lens users face problems such as eye irritability, eye dryness, etc., while wearing their contact lenses. Silicone hydrogels contact lenses offer high levels of oxygen transmissibility through the cornea, in comparison to normal contact lenses, and therefore provide the user benefits like extended wear, continuous wear, and more comfort and ease. Moreover, leading companies such as Bausch & Lomb launched its product "INFUSE Silicone hydrogel" series of daily disposable contact lenses. The silicone hydrogel is suggested as a solution by doctors or eye specialists to their patients suffering from an eye allergy or lens allergy due to their previous lens usage. In November 2021, In the United States, an eye health leader CooperVision introduced its new MyDay daily disposable multifocal contact lenses, expanding its standard exceptional silicone hydrogel 1-day family. These new contact lenses are built with an innovative 3 ADD technique, i.e., CooperVision Binocular Progressive System, which caters to all the levels of presbyopia with a single fitting process. This new product range will be a proven tool in the presbyopia realm and, thus, can cover a wide demographic range of patients who can benefit from contact lenses.
Increasing Research & Developments in Contact Lenses Sector
The growing research & development in the contact lenses sector has led to the discovery of materials used to make contact lenses with additional features and functionality. Researchers have recently developed contact lenses enhanced with microfluidic technology to develop contact lenses for an efficient drug delivery method. This technology, thus, offers non-invasive intraocular pressure monitoring in the eye and thereby is creating a huge demand in the contact lens market. Additionally, leading companies are increasing their investments in research & development and are developing contact lenses with new innovations. For instance, Alcon, in 2021, launched TOTAL30 -a first and only monthly replacement contact lens designed with water gradient technology and are highly accepted in the US and Europe market. These technology-based contact lenses are occupying a greater demand in the market and are anticipated to propel market growth in the forecast period.
Increase In Influence of Cosmetic Industry on Contact Lenses
Several people are using contact lenses not only to correct vision but also used to enhance their eye color. Contact lenses are also increasing in demand as a fashion accessory due to the influence of fashion and the film industry. Leading companies like CooperVision are manufacturing colored contact lenses named under the series "Expressions", available in multiple colors such as aqua, light blue, brown, dark blue, green, grey, and hazel, to be wore as an everyday thing and are easily affordable for the customers in reasonable prices, making them higher in demand among the public. Also, Bausch & Lomb launched their new color contact lens range under their product label "Lacelle?" color contact lenses. These colored contact lenses are designed to enhance the eye color of the wearer based on the look they want to create, including subtle, bold, and everyday looks, thereby qualifying for the best option for fashionable people. These colored contact lenses are, therefore, stimulating the growth of the contact lens market, along with promoting eye health and providing clearer vision to the wearer. Another company, Menicon Co., Ltd, has launched its wide range of color contact lenses under the FRUTTIE range enhanced with UV blocking, high water content material, moisturizing content via MPC polymer ingredient, along with a sandwich design providing eye safety to the wearer.
Furthermore, several companies, such as CooperVision, Alcon, Bausch & Lomb, etc., are manufacturing eye contact lenses approved by the FDA and are considered safe if worn or tried under prescription, therefore making the colored lenses safe.
Rise In Refractive Disorders Among Population
The growing increase in the prevalence of eye disorders, including myopia, presbyopia, astigmatism, presbyopia, and other ocular infections, is leading to the rise in demand for contact lenses. The rising prevalence of eye impairments, such as myopia and presbyopia, are mostly associated with the primary lifestyle people have adopted in recent times, such as increased usage of mobile phones, rising screen times in jobs, and increased screen-watch time. The booming culture of working from home is increasing the cases of vision impairments among the population. Contact lenses are designed with technology and are successfully addressing the symptoms of pervasive digital eye strain, commonly occurring among today's generation. Also, the rising geriatric population is the most prevalent target population suffering from eye problems, including vision impairments. According to the American Optometric Association, adults over 40 and between 60 years usually start to have eye issues and face problems, including problems with glare, changes in color perception, dry eye issues, reading issues, and losing focus while working. Also, eye and vision problems are usually observed among adults over 40 who have health issues, including chronic, systemic conditions, a family history of glaucoma or macular degeneration, high visually demanding jobs, and health conditions linked to high thyroid, high cholesterol, arthritis, anxiety or depression, etc. Thus, the rise in the geriatric population is stimulating the eye market growth and is creating a huge demand for contact lenses boosting the market growth in the forecast period as well.
Market Segmentation
The Global Contact Lens Market is segmented into modality, design, material type, application, distribution channel, region, and company. Based on modality, the contact lens market is segmented into reusable and disposable contact lenses. Based on design, the market is fragmented into spherical, toric, multifocal, and others. Based on the type of material, the market is segmented into silicone hydrogel, gas permeable, hydrogel, and others. Depending on the application, the market is segmented into corrective, therapeutic, cosmetic, and others. Based on the distribution channel, the contact lens market is fragmented among retail stores, online, and hospitals & clinics. Based on region, the market is divided into North America, Europe, Asia-Pacific, South America, and Middle East & Africa.
Recent Developments
- In September 2022, Johnson & Johnson Vision Care, Inc. launched its recent contact lens- AACUVUE OASYS MAX 1-DAY and ACUVUE OASYS MAX 1-Day Multifocal lenses for Presbyopia. With the increasing technology and digitalized lifestyles, the company has designed the product with a technology providing their installed TearStable Technology designed to maximize the tear-film stability with their lock-in eye moisture capability for the brilliant eye- the comfort of the person wearing them.
- On March 01, 2023, CooperVision introduced its latest Innovation, MyDay Energys Contact Lenses, in the United States contact lens market. MyDay Energys lenses have exclusive aspheric design and material technology to aid tiredness and counter dryness associated with digital eye strain, offering extraordinary comfort to the wearer's eye.
Market Players
Johnson & Johnson., Alcon Inc., CooperVision Inc., Bausch Health Companies Inc., Menicon Co., Ltd., EssilorLuxottica S.A., Carl Zeiss Meditec AG, Hoya Corporation, Seed Co., Ltd, Contamac Holdings Limited, X-Cel Specialty Contacts, SynergEyes Inc., STAAR Surgical Company, Cleriovision, Inc., BenQ Materials Corp. etc., are some of the leading players operating in the Global Contact Lens Market.
Report Scope:
In this report, Global Contact Lens Market, 2028, has been segmented into the following categories, in addition to the industry trends, which have also been detailed below:
Contact Lens Market, By Modality:
- Reusable
- Disposable
Contact Lens Market, By Design:
- Spherical
- Toric
- Multifocal
- Others
Contact Lens Market, By Material Type:
- Silicone Hydrogel
- Hydrogel
- Gas Permeable
- Others
Contact Lens Market, By Application:
- Corrective
- Therapeutic
- Cosmetic
- Others
Contact Lens Market, By Distribution Channel:
- Retail Stores
- Online
- Hospital & Clinics
Contact Lens Market, By Region:
- North America
- United States
- Canada
- Mexico
- Europe
- Germany
- France
- United Kingdom
- Italy
- Spain
- Asia-Pacific
- China
- Japan
- India
- South Korea
- Australia
- Middle East & Africa
- South Africa
- Saudi Arabia
- UAE
- Kuwait
- South America
- Brazil
- Argentina
- Colombia
- Competitive Landscape
Company Profiles: Detailed analysis of the major companies present in Global Contact Lens Market, 2028.
Available Customizations:
With the given market data, TechSci Research offers customizations according to a company's specific needs. The following customization options are available for the report:
Company Information
- Detailed analysis and profiling of additional market players (up to five).
Table of Contents
1. Product Overview
- 1.1. Market Definition
- 1.2. Scope of the Market
- 1.2.1. Markets Covered
- 1.2.2. Years Considered for Study
- 1.2.3. Key Market Segmentations
2. Research Methodology
- 2.1. Objective of the Study
- 2.2. Baseline Methodology
- 2.3. Key Industry Partners
- 2.4. Major Association and Secondary Sources
- 2.5. Forecasting Methodology
- 2.6. Data Triangulation & Validation
- 2.7. Assumptions and Limitations
3. Executive Summary
- 3.1. Overview of the Market
- 3.2. Overview of Key Market Segmentations
- 3.3. Overview of Key Market Players
- 3.4. Overview of Key Regions/Countries
- 3.5. Overview of Market Drivers, Challenges, Trends
4. Voice of Customer
- 4.1. Brand Awareness, 2022
- 4.2. Factors Affecting Purchase Decision, 2022
- 4.3. Sources of Information, 2022
5. Impact of COVID-19 on Global Contact Lens Market
6. Global Contact Lens Market Outlook, 2018-2028F
- 6.1. Market Size & Forecast
- 6.1.1. By Value
- 6.2. Market Share & Forecast
- 6.2.1. By Modality (Reusable, Disposable)
- 6.2.2. By Design (Spherical, Toric, Multifocal, and Others)
- 6.2.3. By Material Type (Silicone Hydrogel, Hydrogel, Gas Permeable, and Others)
- 6.2.4. By Application (Corrective, Therapeutic, Cosmetic, and Others)
- 6.2.5. By Distribution Channel (Retail Stores, Online, Hospital & Clinics)
- 6.2.6. By Region
- 6.2.7. By Company (2022)
- 6.3. Market Map
7. North America Contact Lens Market Outlook, 2018-2028F
- 7.1. Market Size & Forecast
- 7.1.1. By Value
- 7.2. Market Share & Forecast
- 7.2.1. By Modality (Reusable, Disposable)
- 7.2.2. By Design (Spherical, Toric, Multifocal, and Others)
- 7.2.3. By Material Type (Silicone Hydrogel, Hydrogel, Gas Permeable, and Others)
- 7.2.4. By Application (Corrective, Therapeutic, Cosmetic, and Others)
- 7.2.5. Distribution Channel (Retail Stores, Online, Hospital & Clinics)
- 7.2.6. By Country
- 7.3. North America: Country Analysis
- 7.3.1. United States Contact Lens Market Outlook
- 7.3.1.1. Market Size & Forecast
- 7.3.1.1.1. By Value
- 7.3.1.2. Market Share & Forecast
- 7.3.1.2.1. By Modality
- 7.3.1.2.2. By Design
- 7.3.1.2.3. By Material Type
- 7.3.1.2.4. By Application
- 7.3.1.2.5. By Distribution Channel
- 7.3.1.1. Market Size & Forecast
- 7.3.2. Canada Contact Lens Market Outlook
- 7.3.2.1. Market Size & Forecast
- 7.3.2.1.1. By Value
- 7.3.2.2. Market Share & Forecast
- 7.3.2.2.1. By Modality
- 7.3.2.2.2. By Design
- 7.3.2.2.3. By Material Type
- 7.3.2.2.4. By Application
- 7.3.2.2.5. By Distribution Channel
- 7.3.2.1. Market Size & Forecast
- 7.3.3. Mexico Contact Lens Market Outlook
- 7.3.3.1. Market Size & Forecast
- 7.3.3.1.1. By Value
- 7.3.3.2. Market Share & Forecast
- 7.3.3.2.1. By Modality
- 7.3.3.2.2. By Design
- 7.3.3.2.3. By Material Type
- 7.3.3.2.4. By Application
- 7.3.3.2.5. By Distribution Channel
- 7.3.3.1. Market Size & Forecast
- 7.3.1. United States Contact Lens Market Outlook
8. Europe Contact Lens Market Outlook, 2018-2028F
- 8.1. Market Size & Forecast
- 8.1.1. By Value
- 8.2. Market Share & Forecast
- 8.2.1. By Modality (Reusable, Disposable)
- 8.2.2. By Design (Spherical, Toric, Multifocal, and Others)
- 8.2.3. By Material Type (Silicone Hydrogel, Hydrogel, Gas Permeable, and Others)
- 8.2.4. By Application (Corrective, Therapeutic, Cosmetic, and Others)
- 8.2.5. Distribution Channel (Retail Stores, Online, Hospital & Clinics)
- 8.2.6. By Country
- 8.3. Europe: Country Analysis
- 8.3.1. Germany Contact Lens Market Outlook
- 8.3.1.1. Market Size & Forecast
- 8.3.1.1.1. By Value
- 8.3.1.2. Market Share & Forecast
- 8.3.1.2.1. By Modality
- 8.3.1.2.2. By Design
- 8.3.1.2.3. By Material Type
- 8.3.1.2.4. By Application
- 8.3.1.2.5. By Distribution Channel
- 8.3.1.1. Market Size & Forecast
- 8.3.2. France Contact Lens Market Outlook
- 8.3.2.1. Market Size & Forecast
- 8.3.2.1.1. By Value
- 8.3.2.2. Market Share & Forecast
- 8.3.2.2.1. By Modality
- 8.3.2.2.2. By Design
- 8.3.2.2.3. By Material Type
- 8.3.2.2.4. By Application
- 8.3.2.2.5. By Distribution Channel
- 8.3.2.1. Market Size & Forecast
- 8.3.3. United Kingdom Contact Lens Market Outlook
- 8.3.3.1. Market Size & Forecast
- 8.3.3.1.1. By Value
- 8.3.3.2. Market Share & Forecast
- 8.3.3.2.1. By Modality
- 8.3.3.2.2. By Design
- 8.3.3.2.3. By Material Type
- 8.3.3.2.4. By Application
- 8.3.3.2.5. By Distribution Channel
- 8.3.3.1. Market Size & Forecast
- 8.3.4. Italy Contact Lens Market Outlook
- 8.3.4.1. Market Size & Forecast
- 8.3.4.1.1. By Value
- 8.3.4.2. Market Share & Forecast
- 8.3.4.2.1. By Modality
- 8.3.4.2.2. By Design
- 8.3.4.2.3. By Material Type
- 8.3.4.2.4. By Application
- 8.3.4.2.5. By Distribution Channel
- 8.3.4.1. Market Size & Forecast
- 8.3.5. Spain Contact Lens Market Outlook
- 8.3.5.1. Market Size & Forecast
- 8.3.5.1.1. By Value
- 8.3.5.2. Market Share & Forecast
- 8.3.5.2.1. By Modality
- 8.3.5.2.2. By Design
- 8.3.5.2.3. By Material Type
- 8.3.5.2.4. By Application
- 8.3.5.2.5. By Distribution Channel
- 8.3.5.1. Market Size & Forecast
- 8.3.1. Germany Contact Lens Market Outlook
9. Asia-Pacific Contact Lens Market Outlook, 2018-2028F
- 9.1. Market Size & Forecast
- 9.1.1. By Value
- 9.2. Market Share & Forecast
- 9.2.1. By Modality (Reusable, Disposable)
- 9.2.2. By Design (Spherical, Toric, Multifocal, and Others)
- 9.2.3. By Material Type (Silicone Hydrogel, Hydrogel, Gas Permeable, and Others)
- 9.2.4. By Application (Corrective, Therapeutic, Cosmetic, and Others)
- 9.2.5. Distribution Channel (Retail Stores, Online, Hospital & Clinics)
- 9.2.6. By Country
- 9.3. Asia-Pacific: Country Analysis
- 9.3.1. Japan Contact Lens Market Outlook
- 9.3.1.1. Market Size & Forecast
- 9.3.1.1.1. By Value
- 9.3.1.2. Market Share & Forecast
- 9.3.1.2.1. By Modality
- 9.3.1.2.2. By Design
- 9.3.1.2.3. By Material Type
- 9.3.1.2.4. By Application
- 9.3.1.2.5. By Distribution Channel
- 9.3.1.1. Market Size & Forecast
- 9.3.2. China Contact Lens Market Outlook
- 9.3.2.1. Market Size & Forecast
- 9.3.2.1.1. By Value
- 9.3.2.2. Market Share & Forecast
- 9.3.2.2.1. By Modality
- 9.3.2.2.2. By Design
- 9.3.2.2.3. By Material Type
- 9.3.2.2.4. By Application
- 9.3.2.2.5. By Distribution Channel
- 9.3.2.1. Market Size & Forecast
- 9.3.3. India Contact Lens Market Outlook
- 9.3.3.1. Market Size & Forecast
- 9.3.3.1.1. By Value
- 9.3.3.2. Market Share & Forecast
- 9.3.3.2.1. By Modality
- 9.3.3.2.2. By Design
- 9.3.3.2.3. By Material Type
- 9.3.3.2.4. By Application
- 9.3.3.2.5. By Distribution Channel
- 9.3.3.1. Market Size & Forecast
- 9.3.4. South Korea Contact Lens Market Outlook
- 9.3.4.1. Market Size & Forecast
- 9.3.4.1.1. By Value
- 9.3.4.2. Market Share & Forecast
- 9.3.4.2.1. By Modality
- 9.3.4.2.2. By Design
- 9.3.4.2.3. By Material Type
- 9.3.4.2.4. By Application
- 9.3.4.2.5. By Distribution Channel
- 9.3.4.1. Market Size & Forecast
- 9.3.5. Australia Contact Lens Market Outlook
- 9.3.5.1. Market Size & Forecast
- 9.3.5.1.1. By Value
- 9.3.5.2. Market Share & Forecast
- 9.3.5.2.1. By Modality
- 9.3.5.2.2. By Design
- 9.3.5.2.3. By Material Type
- 9.3.5.2.4. By Application
- 9.3.5.2.5. By Distribution Channel
- 9.3.5.1. Market Size & Forecast
- 9.3.1. Japan Contact Lens Market Outlook
10. South America Contact Lens Market Outlook, 2018-2028F
- 10.1. Market Size & Forecast
- 10.1.1. By Value
- 10.2. Market Share & Forecast
- 10.2.1. By Modality (Reusable, Disposable)
- 10.2.2. By Design (Spherical, Toric, Multifocal, and Others)
- 10.2.3. By Material Type (Silicone Hydrogel, Hydrogel, Gas Permeable, and Others)
- 10.2.4. By Application (Corrective, Therapeutic, Cosmetic, and Others)
- 10.2.5. Distribution Channel (Retail Stores, Online, Hospital & Clinics)
- 10.2.6. By Country
- 10.3. South America: Country Analysis
- 10.3.1. Brazil Contact Lens Market Outlook
- 10.3.1.1. Market Size & Forecast
- 10.3.1.1.1. By Value
- 10.3.1.2. Market Share & Forecast
- 10.3.1.2.1. By Modality
- 10.3.1.2.2. By Design
- 10.3.1.2.3. By Material Type
- 10.3.1.2.4. By Application
- 10.3.1.2.5. By Distribution Channel
- 10.3.1.1. Market Size & Forecast
- 10.3.2. Argentina Contact Lens Market Outlook
- 10.3.2.1. Market Size & Forecast
- 10.3.2.1.1. By Value
- 10.3.2.2. Market Share & Forecast
- 10.3.2.2.1. By Modality
- 10.3.2.2.2. By Design
- 10.3.2.2.3. By Material Type
- 10.3.2.2.4. By Application
- 10.3.2.2.5. By Distribution Channel
- 10.3.2.1. Market Size & Forecast
- 10.3.3. Colombia Contact Lens Market Outlook
- 10.3.3.1. Market Size & Forecast
- 10.3.3.1.1. By Value
- 10.3.3.2. Market Share & Forecast
- 10.3.3.2.1. By Modality
- 10.3.3.2.2. By Design
- 10.3.3.2.3. By Material Type
- 10.3.3.2.4. By Application
- 10.3.3.2.5. By Distribution Channel
- 10.3.3.1. Market Size & Forecast
- 10.3.1. Brazil Contact Lens Market Outlook
11. Middle East and Africa Contact Lens Market Outlook, 2018-2028F
- 11.1. Market Size & Forecast
- 11.1.1. By Value
- 11.2. Market Share & Forecast
- 11.2.1. By Modality (Reusable, Disposable)
- 11.2.2. By Design (Spherical, Toric, Multifocal, and Others)
- 11.2.3. By Material Type (Silicone Hydrogel, Hydrogel, Gas Permeable, and Others)
- 11.2.4. By Application (Corrective, Therapeutic, Cosmetic, and Others)
- 11.2.5. Distribution Channel (Retail Stores, Online, Hospital & Clinics)
- 11.2.6. By Country
- 11.3. MEA: Country Analysis
- 11.3.1. South Africa Contact Lens Market Outlook
- 11.3.1.1. Market Size & Forecast
- 11.3.1.1.1. By Value
- 11.3.1.2. Market Share & Forecast
- 11.3.1.2.1. By Modality
- 11.3.1.2.2. By Design
- 11.3.1.2.3. By Material Type
- 11.3.1.2.4. By Application
- 11.3.1.2.5. By Distribution Channel
- 11.3.1.1. Market Size & Forecast
- 11.3.2. Saudi Arabia Contact Lens Market Outlook
- 11.3.2.1. Market Size & Forecast
- 11.3.2.1.1. By Value
- 11.3.2.2. Market Share & Forecast
- 11.3.2.2.1. By Modality
- 11.3.2.2.2. By Design
- 11.3.2.2.3. By Material Type
- 11.3.2.2.4. By Application
- 11.3.2.2.5. By Distribution Channel
- 11.3.2.1. Market Size & Forecast
- 11.3.3. UAE Contact Lens Market Outlook
- 11.3.3.1. Market Size & Forecast
- 11.3.3.1.1. By Value
- 11.3.3.2. Market Share & Forecast
- 11.3.3.2.1. By Modality
- 11.3.3.2.2. By Design
- 11.3.3.2.3. By Material Type
- 11.3.3.2.4. By Application
- 11.3.3.2.5. By Distribution Channel
- 11.3.3.1. Market Size & Forecast
- 11.3.1. South Africa Contact Lens Market Outlook
12. Market Dynamics
- 12.1. Drivers
- 12.2. Challenges
13. Market Trends & Developments
- 13.1. Recent Developments
- 13.2. Mergers & Acquisitions
- 13.3. Product Launches
14. Competitive Landscape
- 14.1. Business Overview
- 14.2. Company Snapshot
- 14.3. Products & Services
- 14.4. Financials (As Reported)
- 14.5. Recent Developments
- 14.6. SWOT Analysis
- 14.6.1. Johnson & Johnson.
- 14.6.2. Alcon Inc.
- 14.6.3. CopperVision Inc.
- 14.6.4. Bausch Health Companies Inc.
- 14.6.5. Menicon Co., Ltd.
- 14.6.6. EssilorLuxottica S.A.
- 14.6.7. Carl Zeiss Meditec AG
- 14.6.8. Hoya Corporation
- 14.6.9. Seed Co., Ltd
- 14.6.10. Contamac Holdings Limited
- 14.6.11. X-Cel Specialty Contacts
- 14.6.12. SynergEyes Inc.
- 14.6.13. STAAR Surgical Company
- 14.6.14. Cleriovision, Inc.
- 14.6.15. BenQ Materials Corp