|
|
市場調査レポート
商品コード
1118342
スマートアニマルトラップの世界市場:2028年までの予測、市場分析:用途別、コンポーネント別Smart Animal Trap Market Forecast to 2028 - COVID-19 Impact and Global Analysis By Hardware (Sensors, Cameras, and Others), Application (Residential and Commercial), and Component (Hardware, Software, and Services) |
||||||
|
|
|||||||


| スマートアニマルトラップの世界市場:2028年までの予測、市場分析:用途別、コンポーネント別 |
|
出版日: 2022年07月12日
発行: The Insight Partners
ページ情報: 英文 164 Pages
納期: 即納可能
|
- 全表示
- 概要
- 図表
- 目次
世界のスマートアニマルトラップの市場規模は、2022年に3億3,436万米ドルになるとみられています。同市場は2022年~2028年にかけて、7.2%のCAGRで拡大し、2028年には5億756万米ドルに達すると予測されています。
当レポートでは、世界のスマートアニマルトラップ市場について調査し、市場の概要とともに、用途別、コンポーネント別、地域別の動向、および市場に参入する企業のプロファイルなどを提供しています。
目次
第1章 イントロダクション
第2章 重要ポイント
第3章 調査手法
第4章 スマートアニマルトラップ市場情勢
- 市場概要
- PEST分析
- エコシステム分析
- 専門家の見解
- 重要考察
第5章 スマートアニマルトラップ市場-主要な市場力学
- 市場の促進要因
- 市場の抑制要因
- 市場の機会
- 今後の動向
- 促進要因と抑制要因の影響分析
第6章 スマートアニマルトラップ市場-世界市場分析
第7章 スマートアニマルトラップ市場分析-コンポーネント別
- スマートアニマルトラップ市場、コンポーネント別(2021年および2028年)
- ハードウェア
- ソフトウェア
- サービス
第8章 スマートアニマルトラップ市場分析-用途別
- スマートアニマルトラップ市場、用途別(2021年および2028年)
- 住宅
- 商業
第9章 スマートアニマルトラップ市場-地域別分析
- 北米
- 欧州
- アジア太平洋
- 中東・アフリカ
- 南米
第10章 スマートアニマルトラップ市場に対するCOVID-19の影響分析
- 北米
- 欧州
- アジア太平洋
- 中東・アフリカ
- 南米
第11章 業界情勢
第12章 企業プロファイル
- Alert House ApS
- CatchAlive ApS
- Encounter Solutions Ltd.
- Econode Ltd.
- Wildlife Dominion Management LLC.(HogEye)
- PestSense Pty Ltd Animal Trap Solutions
- Skyhawk
- TrapSmart tm LLP.
- uWatch Ltd.
- Fallenmelder TRAPMASTER
- TFK Handels GmbH(Reviermanager)
- WildMelder.de
- Triotos
- BOARMASTER
第13章 付録
List Of Tables
- Table 1. Global Smart Animal Trap Market Revenue and Forecast to 2028 (US$ Million)
- Table 2. North America: Smart Animal Trap Market- by Hardware - Revenue and Forecast to 2028 (US$ Million)
- Table 3. North America: Smart Animal Trap Market- By Application - Revenue and Forecast to 2028 (US$ Million)
- Table 4. North America: Smart Animal Trap Market- By Component - Revenue and Forecast to 2028 (US$ Million)
- Table 5. US: Smart Animal Trap Market- by Hardware -Revenue and Forecast to 2028 (US$ Million)
- Table 6. US: Smart Animal Trap Market- By Application -Revenue and Forecast to 2028 (US$ Million)
- Table 7. US: Smart Animal Trap Market- By Component -Revenue and Forecast to 2028 (US$ Million)
- Table 8. Canada: Smart Animal Trap Market- by Hardware -Revenue and Forecast to 2028 (US$ Million)
- Table 9. Canada: Smart Animal Trap Market- By Application -Revenue and Forecast to 2028 (US$ Million)
- Table 10. Canada: Smart Animal Trap Market- By Component -Revenue and Forecast to 2028 (US$ Million)
- Table 11. Mexico: Smart Animal Trap Market- by Hardware -Revenue and Forecast to 2028 (US$ Million)
- Table 12. Mexico: Smart Animal Trap Market- By Application -Revenue and Forecast to 2028 (US$ Million)
- Table 13. Mexico: Smart Animal Trap Market- By Component -Revenue and Forecast to 2028 (US$ Million)
- Table 14. Europe: Smart Animal Trap Market- by Hardware - Revenue and Forecast to 2028 (US$ Million)
- Table 15. Europe: Smart Animal Trap Market- By Application - Revenue and Forecast to 2028 (US$ Million)
- Table 16. Europe: Smart Animal Trap Market- By Component - Revenue and Forecast to 2028 (US$ Million)
- Table 17. Germany: Smart Animal Trap Market- by Hardware -Revenue and Forecast to 2028 (US$ Million)
- Table 18. Germany: Smart Animal Trap Market- By Application -Revenue and Forecast to 2028 (US$ Million)
- Table 19. Germany: Smart Animal Trap Market- By Component -Revenue and Forecast to 2028 (US$ Million)
- Table 20. France: Smart Animal Trap Market- by Hardware -Revenue and Forecast to 2028 (US$ Million)
- Table 21. France: Smart Animal Trap Market- By Application -Revenue and Forecast to 2028 (US$ Million)
- Table 22. France: Smart Animal Trap Market- By Component -Revenue and Forecast to 2028 (US$ Million)
- Table 23. Italy: Smart Animal Trap Market- by Hardware -Revenue and Forecast to 2028 (US$ Million)
- Table 24. Italy: Smart Animal Trap Market- By Application -Revenue and Forecast to 2028 (US$ Million)
- Table 25. Italy: Smart Animal Trap Market- By Component -Revenue and Forecast to 2028 (US$ Million)
- Table 26. UK: Smart Animal Trap Market- by Hardware -Revenue and Forecast to 2028 (US$ Million)
- Table 27. UK: Smart Animal Trap Market- By Application -Revenue and Forecast to 2028 (US$ Million)
- Table 28. UK: Smart Animal Trap Market- By Component -Revenue and Forecast to 2028 (US$ Million)
- Table 29. Russia: Smart Animal Trap Market- by Hardware -Revenue and Forecast to 2028 (US$ Million)
- Table 30. Russia: Smart Animal Trap Market- By Application -Revenue and Forecast to 2028 (US$ Million)
- Table 31. Russia: Smart Animal Trap Market- By Component -Revenue and Forecast to 2028 (US$ Million)
- Table 32. Rest of Europe: Smart Animal Trap Market- by Hardware -Revenue and Forecast to 2028 (US$ Million)
- Table 33. Rest of Europe: Smart Animal Trap Market- By Application -Revenue and Forecast to 2028 (US$ Million)
- Table 34. Rest of Europe: Smart Animal Trap Market- By Component -Revenue and Forecast to 2028 (US$ Million)
- Table 35. APAC: Smart Animal Trap Market- by Hardware - Revenue and Forecast to 2028 (US$ Million)
- Table 36. APAC: Smart Animal Trap Market- By Application - Revenue and Forecast to 2028 (US$ Million)
- Table 37. APAC: Smart Animal Trap Market- By Component - Revenue and Forecast to 2028 (US$ Million)
- Table 38. Australia: Smart Animal Trap Market- by Hardware -Revenue and Forecast to 2028 (US$ Million)
- Table 39. Australia: Smart Animal Trap Market- By Application -Revenue and Forecast to 2028 (US$ Million)
- Table 40. Australia: Smart Animal Trap Market- By Component -Revenue and Forecast to 2028 (US$ Million)
- Table 41. China: Smart Animal Trap Market- by Hardware -Revenue and Forecast to 2028 (US$ Million)
- Table 42. China: Smart Animal Trap Market- By Application -Revenue and Forecast to 2028 (US$ Million)
- Table 43. China: Smart Animal Trap Market- By Component -Revenue and Forecast to 2028 (US$ Million)
- Table 44. India: Smart Animal Trap Market- by Hardware -Revenue and Forecast to 2028 (US$ Million)
- Table 45. India: Smart Animal Trap Market- By Application -Revenue and Forecast to 2028 (US$ Million)
- Table 46. India: Smart Animal Trap Market- By Component -Revenue and Forecast to 2028 (US$ Million)
- Table 47. Japan: Smart Animal Trap Market- by Hardware -Revenue and Forecast to 2028 (US$ Million)
- Table 48. Japan: Smart Animal Trap Market- By Application -Revenue and Forecast to 2028 (US$ Million)
- Table 49. Japan: Smart Animal Trap Market- By Component -Revenue and Forecast to 2028 (US$ Million)
- Table 50. South Korea: Smart Animal Trap Market- by Hardware -Revenue and Forecast to 2028 (US$ Million)
- Table 51. South Korea: Smart Animal Trap Market- By Application -Revenue and Forecast to 2028 (US$ Million)
- Table 52. South Korea: Smart Animal Trap Market- By Component -Revenue and Forecast to 2028 (US$ Million)
- Table 53. Rest of APAC: Smart Animal Trap Market- by Hardware -Revenue and Forecast to 2028 (US$ Million)
- Table 54. Rest of APAC: Smart Animal Trap Market- By Application -Revenue and Forecast to 2028 (US$ Million)
- Table 55. Rest of APAC: Smart Animal Trap Market- By Component -Revenue and Forecast to 2028 (US$ Million)
- Table 56. MEA: Smart Animal Trap Market- by Hardware- Revenue and Forecast to 2028 (US$ Million)
- Table 57. MEA: Smart Animal Trap Market- By Application - Revenue and Forecast to 2028 (US$ Million)
- Table 58. MEA: Smart Animal Trap Market- By Component - Revenue and Forecast to 2028 (US$ Million)
- Table 59. South Africa: Smart Animal Trap Market- by Hardware -Revenue and Forecast to 2028 (US$ Million)
- Table 60. South Africa: Smart Animal Trap Market- By Application -Revenue and Forecast to 2028 (US$ Million)
- Table 61. South Africa: Smart Animal Trap Market- By Component -Revenue and Forecast to 2028 (US$ Million)
- Table 62. Saudi Arabia: Smart Animal Trap Market- by Hardware -Revenue and Forecast to 2028 (US$ Million)
- Table 63. Saudi Arabia: Smart Animal Trap Market- By Application -Revenue and Forecast to 2028 (US$ Million)
- Table 64. Saudi Arabia: Smart Animal Trap Market- By Component -Revenue and Forecast to 2028 (US$ Million)
- Table 65. UAE: Smart Animal Trap Market- by Hardware -Revenue and Forecast to 2028 (US$ Million)
- Table 66. UAE: Smart Animal Trap Market- By Application -Revenue and Forecast to 2028 (US$ Million)
- Table 67. UAE: Smart Animal Trap Market- By Component -Revenue and Forecast to 2028 (US$ Million)
- Table 68. Rest of MEA: Smart Animal Trap Market- by Hardware -Revenue and Forecast to 2028 (US$ Million)
- Table 69. Rest of MEA: Smart Animal Trap Market- By Application -Revenue and Forecast to 2028 (US$ Million)
- Table 70. Rest of MEA: Smart Animal Trap Market- By Component -Revenue and Forecast to 2028 (US$ Million)
- Table 71. SAM: Smart Animal Trap Market- by Hardware - Revenue and Forecast to 2028 (US$ Million)
- Table 72. SAM: Smart Animal Trap Market- By Application - Revenue and Forecast to 2028 (US$ Million)
- Table 73. SAM: Smart Animal Trap Market- By Component - Revenue and Forecast to 2028 (US$ Million)
- Table 74. Brazil: Smart Animal Trap Market- by Hardware -Revenue and Forecast to 2028 (US$ Million)
- Table 75. Brazil: Smart Animal Trap Market- By Application -Revenue and Forecast to 2028 (US$ Million)
- Table 76. Brazil: Smart Animal Trap Market- By Component -Revenue and Forecast to 2028 (US$ Million)
- Table 77. Argentina: Smart Animal Trap Market- by Hardware -Revenue and Forecast to 2028 (US$ Million)
- Table 78. Argentina: Smart Animal Trap Market- By Application -Revenue and Forecast to 2028 (US$ Million)
- Table 79. Argentina: Smart Animal Trap Market- By Component -Revenue and Forecast to 2028 (US$ Million)
- Table 80. Rest of SAM: Smart Animal Trap Market- by Hardware-Revenue and Forecast to 2028 (US$ Million)
- Table 81. Rest of SAM: Smart Animal Trap Market- By Application -Revenue and Forecast to 2028 (US$ Million)
- Table 82. Rest of SAM: Smart Animal Trap Market- By Component -Revenue and Forecast to 2028 (US$ Million)
- Table 83. List of Abbreviation
List Of Figures
- Figure 1. Smart Animal Trap Market Segmentation
- Figure 2. Smart Animal Trap Market Segmentation - By Geography
- Figure 3. Global Smart Animal Trap Market Overview
- Figure 4. Smart Animal Trap Market, by Component
- Figure 5. Smart Animal Trap Market, by Hardware
- Figure 6. Smart Animal Trap Market, by Application
- Figure 7. Smart Animal Trap Market, by Geography
- Figure 8. North America - PEST Analysis
- Figure 9. Europe - PEST Analysis
- Figure 10. APAC - PEST Analysis
- Figure 11. MEA - PEST Analysis
- Figure 12. SAM - PEST Analysis
- Figure 13. Smart Animal Trap Market- Ecosystem Analysis
- Figure 14. Smart Animal Trap Market Impact Analysis of Drivers and Restraints
- Figure 15. Geographic Overview of Smart Animal Trap Market
- Figure 16. Global Smart Animal Trap Market Revenue Forecast and Analysis (US$ Million)
- Figure 17. Smart Animal Trap Market Revenue Share, by Component (2021 and 2028)
- Figure 18. Hardware Smart Animal Trap: Smart Animal Trap Market - Revenue and Forecast to 2028 (US$ Million)
- Figure 19. Sensors Smart Animal Trap: Smart Animal Trap Market - Revenue and Forecast to 2028 (US$ Million)
- Figure 20. Cameras Smart Animal Trap: Smart Animal Trap Market - Revenue and Forecast to 2028 (US$ Million)
- Figure 21. Others Smart Animal Trap: Smart Animal Trap Market - Revenue and Forecast to 2028 (US$ Million)
- Figure 22. Software Smart Animal Trap: Smart Animal Trap Market - Revenue and Forecast to 2028 (US$ Million)
- Figure 23. Services: Smart Animal Trap Market - Revenue and Forecast to 2028 (US$ Million)
- Figure 24. Smart Animal Trap Market Revenue Share, by Application (2021 and 2028)
- Figure 25. Residential: Smart Animal Trap Market - Revenue and Forecast to 2028 (US$ Million)
- Figure 26. Commercial: Smart Animal Trap Market - Revenue and Forecast to 2028 (US$ Million)
- Figure 27. Global Smart Animal Trap Market Breakdown, by region, 2021 & 2028 (%)
- Figure 28. North America: Smart Animal Trap Market - Revenue and Forecast to 2028 (US$ Million)
- Figure 29. North America: Smart Animal Trap Market Revenue Share, by Hardware (2021 and 2028)
- Figure 30. North America: Smart Animal Trap Market Revenue Share, By Application (2021 and 2028)
- Figure 31. North America: Smart Animal Trap Market Revenue Share, By Component (2021 and 2028)
- Figure 32. North America: Smart Animal Trap Market Revenue Share, by Key Country (2021 and 2028)
- Figure 33. US: Smart Animal Trap Market - Revenue and Forecast to 2028 (US$ Million)
- Figure 34. Canada: Smart Animal Trap Market - Revenue and Forecast to 2028 (US$ Million)
- Figure 35. Mexico: Smart Animal Trap Market - Revenue and Forecast to 2028 (US$ Million)
- Figure 36. Europe: Smart Animal Trap Market - Revenue and Forecast to 2028 (US$ Million)
- Figure 37. Europe: Smart Animal Trap Market Revenue Share, By Hardware (2021 and 2028)
- Figure 38. Europe: Smart Animal Trap Market Revenue Share, By Application (2021 and 2028)
- Figure 39. Europe: Smart Animal Trap Market Revenue Share, By Component (2021 and 2028)
- Figure 40. Europe: Smart Animal Trap Market Revenue Share, By Key Country (2021 and 2028)
- Figure 41. Germany: Smart Animal Trap Market - Revenue and Forecast to 2028 (US$ Million)
- Figure 42. France: Smart Animal Trap Market - Revenue and Forecast to 2028 (US$ Million)
- Figure 43. Italy: Smart Animal Trap Market - Revenue and Forecast to 2028 (US$ Million)
- Figure 44. UK: Smart Animal Trap Market - Revenue and Forecast to 2028 (US$ Million)
- Figure 45. Russia: Smart Animal Trap Market - Revenue and Forecast to 2028 (US$ Million)
- Figure 46. Rest of Europe: Smart Animal Trap Market - Revenue and Forecast to 2028 (US$ Million)
- Figure 47. APAC: Smart Animal Trap Market - Revenue and Forecast to 2028 (US$ Million)
- Figure 48. APAC: Smart Animal Trap Market Revenue Share, By Hardware (2021 and 2028)
- Figure 49. APAC: Smart Animal Trap Market Revenue Share, By Application (2021 and 2028)
- Figure 50. APAC: Smart Animal Trap Market Revenue Share, By Component (2021 and 2028)
- Figure 51. APAC: Smart Animal Trap Market Revenue Share, By Key Country (2021 and 2028)
- Figure 52. Australia: Smart Animal Trap Market - Revenue and Forecast to 2028 (US$ Million)
- Figure 53. China: Smart Animal Trap Market - Revenue and Forecast to 2028 (US$ Million)
- Figure 54. India: Smart Animal Trap Market - Revenue and Forecast to 2028 (US$ Million)
- Figure 55. Japan: Smart Animal Trap Market - Revenue and Forecast to 2028 (US$ Million)
- Figure 56. South Korea: Smart Animal Trap Market - Revenue and Forecast to 2028 (US$ Million)
- Figure 57. Rest of APAC: Smart Animal Trap Market - Revenue and Forecast to 2028 (US$ Million)
- Figure 58. MEA: Smart Animal Trap Market - Revenue and Forecast to 2028 (US$ Million)
- Figure 59. MEA: Smart Animal Trap Market Revenue Share, By Hardware (2021 and 2028)
- Figure 60. MEA: Smart Animal Trap Market Revenue Share, By Application (2021 and 2028)
- Figure 61. MEA: Smart Animal Trap Market Revenue Share, By Component (2021 and 2028)
- Figure 62. MEA: Smart Animal Trap Market Revenue Share, By Key Country (2021 and 2028)
- Figure 63. South Africa: Smart Animal Trap Market - Revenue and Forecast to 2028 (US$ Million)
- Figure 64. Saudi Arabia: Smart Animal Trap Market - Revenue and Forecast to 2028 (US$ Million)
- Figure 65. UAE: Smart Animal Trap Market - Revenue and Forecast to 2028 (US$ Million)
- Figure 66. Rest of MEA: Smart Animal Trap Market - Revenue and Forecast to 2028 (US$ Million)
- Figure 67. SAM: Smart Animal Trap Market - Revenue and Forecast to 2028 (US$ Million)
- Figure 68. SAM: Smart Animal Trap Market Revenue Share, By Hardware (2021 and 2028)
- Figure 69. SAM: Smart Animal Trap Market Revenue Share, By Application (2021 and 2028)
- Figure 70. SAM: Smart Animal Trap Market Revenue Share, By Component (2021 and 2028)
- Figure 71. SAM: Smart Animal Trap Market Revenue Share, By Key Country (2021 and 2028)
- Figure 72. Brazil: Smart Animal Trap Market - Revenue and Forecast to 2028 (US$ Million)
- Figure 73. Argentina: Smart Animal Trap Market - Revenue and Forecast to 2028 (US$ Million)
- Figure 74. Rest of SAM: Smart Animal Trap Market - Revenue and Forecast to 2028 (US$ Million)
- Figure 75. Impact of COVID-19 Pandemic on North America Country Markets
- Figure 76. Impact of COVID-19 Pandemic on Europe Country Markets
- Figure 77. Impact of COVID-19 Pandemic on Asia Pacific Country Markets
- Figure 78. Impact of COVID-19 Pandemic on MEA Country Markets
- Figure 79. Impact of COVID-19 Pandemic on South America Country Markets
The smart animal trap market is expected to grow from US$ 334.36 million in 2022 to US$ 507.56 million by 2028. It is estimated to grow at a CAGR of 7.2% from 2022 to 2028.
Local hunters typically set traps and visit these sites every morning to see if they have captured any dangerous animals. However, it becomes difficult to perform these physically demanding daily tasks with growing age. This constraint on manual operations has drawn traction toward using the Internet of Things (IoT) to reduce human interference in animal trapping. Many IT firms and start-ups focused on the IoT are developing remote monitoring systems for wildlife damage countermeasure for wildlife trapping and wildlife surveillance. Sensors in these systems can recognize the capture of dangerous animals, followed by alerting remote administrators via GPS and Low Power Wide Area (LPWA) communication.
The state of all the traps in a particular region can be plotted and shown on a map, and registered e-mail addresses can be notified of the trapping status. The technique is more effective since the technology enables hunters to travel straight to the sites of the capture of dangerous animals. The location and time of the capture can be traced by analyzing cloud data gathered with wildlife trap monitoring devices. To combat blind zones caused by poor connectivity and trouble accessing commercial power sources, wireless relays and renewable energy-powered systems are being tested (e.g., solar power-based trap systems). Thus, the expansion of IoT and the development of power sources will likely introduce new trends in the smart animal trap market during the forecast period.
COVID-19 Impact on Smart Animal Trap Market Size
The MEA is segmented into South Africa, the UAE, and Saudi Arabia. The COVID-19 pandemic posed major challenges for all sectors in 2020 and mid-2021. Most people stayed indoors due to the outbreak, which boosted the adoption of work-from-home practices. The smart animal trap market growth experienced a hit at the beginning of the pandemic due to the disrupted supply chain and declining growth of semiconductor components, consumer electronics, and IT & telecommunication industries. Some developing economies in the region cannot afford the smart animal trap systems due to major losses incurred by the governments and businesses in these countries.
In June 2021, a visitor was killed by a wild hippo while on his way home in Mairo-inya village, Kenya. Due to supply chain constraints that increased the overhead costs of the smart animal trap system deployment, the relevant country's government could not fund the deployment of a smart animal trap system, which would have prevented this catastrophe. Such factors and similar incidents in other countries have propelled the growth of smart animal trap market in the region. Hence, the overall impact of the COVID-19 pandemic on the MEA smart animal trap market was moderate.
In the smart animal trap market study, Asia Pacific is segmented into India, China, Japan, South Korea, Australia, and the Rest of Asia Pacific. About 11% of all animal species are found in China, so improving China's wildlife conservation is crucial for maintaining biodiversity worldwide. Despite some success and conservation initiatives, human activity poses a threat to 21.4% of China's vertebrate species, and hence the demand for monitoring devices is increasing across the country. Furthermore, wildlife in China is severely threatened by the expanding wildlife trade, which also puts people at risk of contracting infectious zoonotic diseases. Several issues have plagued China's efforts to conserve wildlife, two of which are impractical. As a result, proper surveillance of animals has become a need of the nation, thereby boosting the market.
Further, the wildlife community in India enjoys widespread support. There are 981 protected places as of 2020-2021, including 106 National Parks, 566 Wildlife Sanctuaries, 97 Conservation Reserves, and 214 Community Reserves. In addition, there are 18 Biosphere Reserves, 32 Elephant Reserves, and 51 Tiger Reserves. These national parks are outfitted with specific IoT-connected devices for the frequent tracking and migration of animals across the parks. Parks invest in smart devices to maintain a proper ecosystem for the endangered species. Furthermore, the number of livestock in India also provides a sizable customer base.
The Australian government's attention toward the wildlife environment is significantly boosting the smart animal traps market across the country. As Wildlife protection is handled by several privately run organizations in the nation, the consumption of smart devices across the country is high. For instance, Australian Wildlife Conservancy, the country's largest private landowner, manages more than 12.9 million hectares of land and species. The country holds strong biodiversity and is home to several rare species at the edge of the extension. Therefore, during the projection period, the smart animal trap market will advance greatly due to the high level of awareness and the vibrant wildlife community.
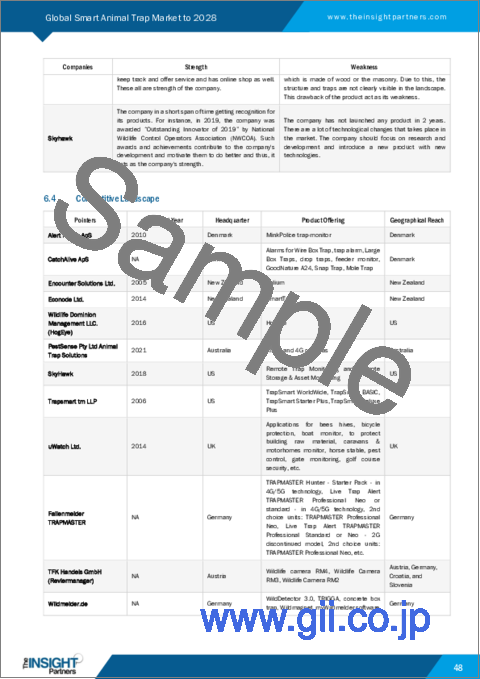
Companies profiled in the smart animal trap market study are Alert House ApS, CatchAlive ApS, Encounter Solutions Ltd., Econode Ltd., Wildlife Dominion Management LLC. (HogEye), PestSense Pty Ltd Animal Trap Solutions, Skyhawk, TrapSmart tm LLP., uWatch Ltd., Fallenmelder TRAPMASTER, TFK Handels GmbH, WildMelder, Triotos, and BOARMASTER. Smart animal trap market players are following both organic and inorganic growth strategies to sustain the competitive edge. For instance, in 2022, Skyhawk participated in Texas Pest Control Expo, held in Fort Worth Convention Center, Texas, from June 21, 2022, to June 23, 2022. Such initiatives by key players will contribute to the smart animal trap market growth during the forecast period.
The overall smart animal trap market analysis has been derived using both primary and secondary sources. To begin the research process, exhaustive secondary research has been conducted using internal and external sources to obtain qualitative and quantitative information related to the smart animal trap market. The process also serves the purpose of obtaining an overview and forecast of the smart animal trap market size with respect to all market segments. Also, industry participants and commentators have conducted multiple primary interviews to validate the data and gain more analytical insights. The participants typically involved in the smart animal trap market study include VPs, business development managers, market intelligence managers, national sales managers, and external consultants, such as valuation experts, research analysts, and key opinion leaders, specializing in the smart animal trap market.
Reasons to Buy:
- Save and reduce time carrying out entry-level research by identifying the growth, size, leading players, and segments in the global smart animal trap market
- Highlights key business priorities to assist companies to realign their business strategies
- The key findings and recommendations highlight crucial progressive industry trends in the global smart animal trap market, thereby allowing players across the value chain to develop effective long-term strategies
- Develop/modify business expansion plans by using substantial growth offering developed and emerging markets
- Scrutinize in-depth global market trends and outlook coupled with the factors driving the market, as well as those hindering it
- Enhance the decision-making process by understanding the strategies that underpin commercial interest with respect to client products, segmentation, pricing, and distribution
Table Of Contents
1. Introduction
- 1.1 Study Scope
- 1.2 The Insight Partners Research Report Guidance
- 1.3 Market Segmentation
2. Key Takeaways
3. Research Methodology
- 3.1 Coverage
- 3.2 Secondary Research
- 3.3 Primary Research
4. Using Smart Animal Trap Market Landscape
- 4.1 Market Overview
- 4.2 PEST Analysis
- 4.2.1 North America
- 4.2.2 Europe
- 4.2.3 APAC
- 4.2.4 MEA
- 4.2.5 SAM
- 4.3 Ecosystem Analysis
- 4.4 Expert Opinions
- 4.5 Premium Insights
- 4.5.1 Regulatory Norms for Animal Trapping in Some countries
5. Smart Animal Trap Market - Key Market Dynamics
- 5.1 Market Drivers
- 5.1.1 Rise in Human-Wildlife Conflicts
- 5.1.2 Rapid Increase in Population of Several Wildlife Species
- 5.2 Market Restraints
- 5.2.1 High Deployment Costs
- 5.3 Market Opportunities
- 5.3.1 Need for Human Life Protection and High-Quality Crops
- 5.4 Future Trends
- 5.4.1 Integration of Advanced Connectivity and Computing Technologies
- 5.5 Impact Analysis of Drivers and Restraints
6. Smart Animal Trap Market - Global Market Analysis
- 6.1 Global Smart Animal Trap Market Overview
- 6.2 Global Smart Animal Trap Market Revenue Forecast and Analysis
- 6.3 Market Positioning - Five Key Players
- 6.4 Competitive Landscape
7. Smart Animal Trap Market Analysis - By Component
- 7.1 Overview
- 7.2 Smart Animal Trap Market, By Component (2021 and 2028)
- 7.3 Hardware
- 7.3.1 Overview
- 7.3.2 Hardware Smart Animal Trap: Smart Animal Trap Market - Revenue and Forecast to 2028 (US$ Million)
- 7.3.3 Sensors
- 7.3.3.1 Overview
- 7.3.3.2 Sensors Smart Animal Trap: Smart Animal Trap Market - Revenue and Forecast to 2028 (US$ Million)
- 7.3.4 Cameras
- 7.3.4.1 Overview
- 7.3.4.2 Cameras Smart Animal Trap: Smart Animal Trap Market - Revenue and Forecast to 2028 (US$ Million)
- 7.3.5 Others
- 7.3.5.1 Overview
- 7.3.5.2 Others Smart Animal Trap: Smart Animal Trap Market - Revenue and Forecast to 2028 (US$ Million)
- 7.4 Software
- 7.4.1 Overview
- 7.4.2 Software Smart Animal Trap: Smart Animal Trap Market - Revenue and Forecast to 2028 (US$ Million)
- 7.5 Services
- 7.5.1 Overview
- 7.5.2 Services: Smart Animal Trap Market - Revenue and Forecast to 2028 (US$ Million)
8. Smart Animal Trap Market Analysis - By Application
- 8.1 Overview
- 8.2 Smart Animal Trap Market, By Application (2021 and 2028)
- 8.3 Residential
- 8.3.1 Overview
- 8.3.2 Residential: Smart Animal Trap Market - Revenue and Forecast to 2028 (US$ Million)
- 8.4 Commercial
- 8.4.1 Overview
- 8.4.2 Commercial: Smart Animal Trap Market - Revenue and Forecast to 2028 (US$ Million)
9. Smart Animal Trap Market - Geographic Analysis
- 9.1 Overview
- 9.2 North America: Smart Animal Trap Market
- 9.2.1 North America: Smart Animal Trap Market - Revenue and Forecast to 2028 (US$ Million)
- 9.2.2 North America: Smart Animal Trap Market- by Hardware
- 9.2.3 North America: Smart Animal Trap Market- By Application
- 9.2.4 North America: Smart Animal Trap Market- By Component
- 9.2.5 North America: Smart Animal Trap Market- by Key Country
- 9.2.5.1 US: Smart Animal Trap Market - Revenue and Forecast to 2028 (US$ Million)
- 9.2.5.1.1 US: Smart Animal Trap Market- by Hardware
- 9.2.5.1.2 US: Smart Animal Trap Market- By Application
- 9.2.5.1.3 US: Smart Animal Trap Market- By Component
- 9.2.5.2 Canada: Smart Animal Trap Market - Revenue and Forecast to 2028 (US$ Million)
- 9.2.5.2.1 Canada: Smart Animal Trap Market- by Hardware
- 9.2.5.2.2 Canada: Smart Animal Trap Market- By Application
- 9.2.5.2.3 Canada: Smart Animal Trap Market- By Component
- 9.2.5.3 Mexico: Smart Animal Trap Market - Revenue and Forecast to 2028 (US$ Million)
- 9.2.5.3.1 Mexico: Smart Animal Trap Market- by Hardware
- 9.2.5.3.2 Mexico: Smart Animal Trap Market- By Application
- 9.2.5.3.3 Mexico: Smart Animal Trap Market- By Component
- 9.2.5.1 US: Smart Animal Trap Market - Revenue and Forecast to 2028 (US$ Million)
- 9.3 Europe: Smart Animal Trap Market
- 9.3.1 Europe: Smart Animal Trap Market - Revenue and Forecast to 2028 (US$ Million)
- 9.3.2 Europe: Smart Animal Trap Market- by Hardware
- 9.3.3 Europe: Smart Animal Trap Market- By Application
- 9.3.4 Europe: Smart Animal Trap Market- By Component
- 9.3.5 Europe: Smart Animal Trap Market- by Key Country
- 9.3.5.1 Germany: Smart Animal Trap Market - Revenue and Forecast to 2028 (US$ Million)
- 9.3.5.1.1 Germany: Smart Animal Trap Market- by Hardware
- 9.3.5.1.2 Germany: Smart Animal Trap Market- By Application
- 9.3.5.1.3 Germany: Smart Animal Trap Market- By Component
- 9.3.5.2 France: Smart Animal Trap Market - Revenue and Forecast to 2028 (US$ Million)
- 9.3.5.2.1 France: Smart Animal Trap Market- by Hardware
- 9.3.5.2.2 France: Smart Animal Trap Market- By Application
- 9.3.5.2.3 France: Smart Animal Trap Market- By Component
- 9.3.5.3 Italy: Smart Animal Trap Market - Revenue and Forecast to 2028 (US$ Million)
- 9.3.5.3.1 Italy: Smart Animal Trap Market- by Hardware
- 9.3.5.3.2 Italy: Smart Animal Trap Market- By Application
- 9.3.5.3.3 Italy: Smart Animal Trap Market- By Component
- 9.3.5.4 UK: Smart Animal Trap Market - Revenue and Forecast to 2028 (US$ Million)
- 9.3.5.4.1 UK: Smart Animal Trap Market- by Hardware
- 9.3.5.4.2 UK: Smart Animal Trap Market- By Application
- 9.3.5.4.3 UK: Smart Animal Trap Market- By Component
- 9.3.5.5 Russia: Smart Animal Trap Market - Revenue and Forecast to 2028 (US$ Million)
- 9.3.5.5.1 Russia: Smart Animal Trap Market- by Hardware
- 9.3.5.5.2 Russia: Smart Animal Trap Market- By Application
- 9.3.5.5.3 Russia: Smart Animal Trap Market- By Component
- 9.3.5.6 Rest of Europe: Smart Animal Trap Market - Revenue and Forecast to 2028 (US$ Million)
- 9.3.5.6.1 Rest of Europe: Smart Animal Trap Market- by Hardware
- 9.3.5.6.2 Rest of Europe: Smart Animal Trap Market- By Application
- 9.3.5.6.3 Rest of Europe: Smart Animal Trap Market- By Component
- 9.3.5.1 Germany: Smart Animal Trap Market - Revenue and Forecast to 2028 (US$ Million)
- 9.4 APAC: Smart Animal Trap Market
- 9.4.1 APAC: Smart Animal Trap Market - Revenue and Forecast to 2028 (US$ Million)
- 9.4.2 APAC: Smart Animal Trap Market- by Hardware
- 9.4.3 APAC: Smart Animal Trap Market- By Application
- 9.4.4 APAC: Smart Animal Trap Market- By Component
- 9.4.5 APAC: Smart Animal Trap Market- by Key Country
- 9.4.5.1 Australia: Smart Animal Trap Market - Revenue and Forecast to 2028 (US$ Million)
- 9.4.5.1.1 Australia: Smart Animal Trap Market- by Hardware
- 9.4.5.1.2 Australia: Smart Animal Trap Market- By Application
- 9.4.5.1.3 Australia: Smart Animal Trap Market- By Component
- 9.4.5.2 China: Smart Animal Trap Market - Revenue and Forecast to 2028 (US$ Million)
- 9.4.5.2.1 China: Smart Animal Trap Market- by Hardware
- 9.4.5.2.2 China: Smart Animal Trap Market- By Application
- 9.4.5.2.3 China: Smart Animal Trap Market- By Component
- 9.4.5.3 India: Smart Animal Trap Market - Revenue and Forecast to 2028 (US$ Million)
- 9.4.5.3.1 India: Smart Animal Trap Market- by Hardware
- 9.4.5.3.2 India: Smart Animal Trap Market- By Application
- 9.4.5.3.3 India: Smart Animal Trap Market- By Component
- 9.4.5.4 Japan: Smart Animal Trap Market - Revenue and Forecast to 2028 (US$ Million)
- 9.4.5.4.1 Japan: Smart Animal Trap Market- by Hardware
- 9.4.5.4.2 Japan: Smart Animal Trap Market- By Application
- 9.4.5.4.3 Japan: Smart Animal Trap Market- By Component
- 9.4.5.5 South Korea: Smart Animal Trap Market - Revenue and Forecast to 2028 (US$ Million)
- 9.4.5.5.1 South Korea: Smart Animal Trap Market- by Hardware
- 9.4.5.5.2 South Korea: Smart Animal Trap Market- By Application
- 9.4.5.5.3 South Korea: Smart Animal Trap Market- By Component
- 9.4.5.6 Rest of APAC: Smart Animal Trap Market - Revenue and Forecast to 2028 (US$ Million)
- 9.4.5.6.1 Rest of APAC: Smart Animal Trap Market- by Hardware
- 9.4.5.6.2 Rest of APAC: Smart Animal Trap Market- By Application
- 9.4.5.6.3 Rest of APAC: Smart Animal Trap Market- By Component
- 9.4.5.1 Australia: Smart Animal Trap Market - Revenue and Forecast to 2028 (US$ Million)
- 9.5 MEA: Smart Animal Trap Market
- 9.5.1 MEA: Smart Animal Trap Market - Revenue and Forecast to 2028 (US$ Million)
- 9.5.2 MEA: Smart Animal Trap Market- by Hardware
- 9.5.3 MEA: Smart Animal Trap Market- By Application
- 9.5.4 MEA: Smart Animal Trap Market- By Component
- 9.5.5 MEA: Smart Animal Trap Market- by Key Country
- 9.5.5.1 South Africa: Smart Animal Trap Market - Revenue and Forecast to 2028 (US$ Million)
- 9.5.5.1.1 South Africa: Smart Animal Trap Market- by Hardware
- 9.5.5.1.2 South Africa: Smart Animal Trap Market- By Application
- 9.5.5.1.3 South Africa: Smart Animal Trap Market- By Component
- 9.5.5.2 Saudi Arabia: Smart Animal Trap Market - Revenue and Forecast to 2028 (US$ Million)
- 9.5.5.2.1 Saudi Arabia: Smart Animal Trap Market- by Hardware
- 9.5.5.2.2 Saudi Arabia: Smart Animal Trap Market- By Application
- 9.5.5.2.3 Saudi Arabia: Smart Animal Trap Market- By Component
- 9.5.5.3 UAE: Smart Animal Trap Market - Revenue and Forecast to 2028 (US$ Million)
- 9.5.5.3.1 UAE: Smart Animal Trap Market- by Hardware
- 9.5.5.3.2 UAE: Smart Animal Trap Market- By Application
- 9.5.5.3.3 UAE: Smart Animal Trap Market- By Component
- 9.5.5.4 Rest of MEA: Smart Animal Trap Market - Revenue and Forecast to 2028 (US$ Million)
- 9.5.5.4.1 Rest of MEA: Smart Animal Trap Market- by Hardware
- 9.5.5.4.2 Rest of MEA: Smart Animal Trap Market- By Application
- 9.5.5.4.3 Rest of MEA: Smart Animal Trap Market- By Component
- 9.5.5.1 South Africa: Smart Animal Trap Market - Revenue and Forecast to 2028 (US$ Million)
- 9.6 SAM: Smart Animal Trap Market
- 9.6.1 SAM: Smart Animal Trap Market - Revenue and Forecast to 2028 (US$ Million)
- 9.6.2 SAM: Smart Animal Trap Market- by Hardware
- 9.6.3 SAM: Smart Animal Trap Market- By Application
- 9.6.4 SAM: Smart Animal Trap Market- By Component
- 9.6.5 SAM: Smart Animal Trap Market- by Key Country
- 9.6.5.1 Brazil: Smart Animal Trap Market - Revenue and Forecast to 2028 (US$ Million)
- 9.6.5.1.1 Brazil: Smart Animal Trap Market- by Hardware
- 9.6.5.1.2 Brazil: Smart Animal Trap Market- By Application
- 9.6.5.1.3 Brazil: Smart Animal Trap Market- By Component
- 9.6.5.2 Argentina: Smart Animal Trap Market - Revenue and Forecast to 2028 (US$ Million)
- 9.6.5.2.1 Argentina: Smart Animal Trap Market- by Hardware
- 9.6.5.2.2 Argentina: Smart Animal Trap Market- By Application
- 9.6.5.2.3 Argentina: Smart Animal Trap Market- By Component
- 9.6.5.3 Rest of SAM: Smart Animal Trap Market - Revenue and Forecast to 2028 (US$ Million)
- 9.6.5.3.1 Rest of SAM: Smart Animal Trap Market- by Hardware
- 9.6.5.3.2 Rest of SAM: Smart Animal Trap Market- By Application
- 9.6.5.3.3 Rest of SAM: Smart Animal Trap Market- By Component
- 9.6.5.1 Brazil: Smart Animal Trap Market - Revenue and Forecast to 2028 (US$ Million)
10. Smart Animal Trap Market - Covid-19 Impact Analysis
- 10.1 Overview
- 10.2 North America: Impact Assessment of COVID-19 Pandemic
- 10.3 Europe: Impact Assessment of COVID-19 Pandemic
- 10.4 Asia Pacific: Impact Assessment of COVID-19 Pandemic
- 10.5 MEA: Impact Assessment of COVID-19 Pandemic
- 10.6 South America Impact Assessment of COVID-19 Pandemic
11. Industry Landscape
- 11.1 Overview
- 11.2 Market Initiative
12. Company Profiles
- 12.1 Alert House ApS
- 12.1.1 Key Facts
- 12.1.2 Business Description
- 12.1.3 Products and Services
- 12.1.4 Financial Overview
- 12.1.5 SWOT Analysis
- 12.1.6 Key Developments
- 12.2 CatchAlive ApS
- 12.2.1 Key Facts
- 12.2.2 Business Description
- 12.2.3 Products and Services
- 12.2.4 Financial Overview
- 12.2.5 SWOT Analysis
- 12.2.6 Key Developments
- 12.3 Encounter Solutions Ltd.
- 12.3.1 Key Facts
- 12.3.2 Business Description
- 12.3.3 Products and Services
- 12.3.4 Financial Overview
- 12.3.5 SWOT Analysis
- 12.3.6 Key Developments
- 12.4 Econode Ltd.
- 12.4.1 Key Facts
- 12.4.2 Business Description
- 12.4.3 Products and Services
- 12.4.4 Financial Overview
- 12.4.5 SWOT Analysis
- 12.4.6 Key Developments
- 12.5 Wildlife Dominion Management LLC. (HogEye)
- 12.5.1 Key Facts
- 12.5.2 Business Description
- 12.5.3 Products and Services
- 12.5.4 Financial Overview
- 12.5.5 SWOT Analysis
- 12.5.6 Key Developments
- 12.6 PestSense Pty Ltd Animal Trap Solutions
- 12.6.1 Key Facts
- 12.6.2 Business Description
- 12.6.3 Products and Services
- 12.6.4 Financial Overview
- 12.6.5 SWOT Analysis
- 12.6.6 Key Developments
- 12.7 Skyhawk
- 12.7.1 Key Facts
- 12.7.2 Business Description
- 12.7.3 Products and Services
- 12.7.4 Financial Overview
- 12.7.5 SWOT Analysis
- 12.7.6 Key Developments
- 12.8 TrapSmart tm LLP.
- 12.8.1 Key Facts
- 12.8.2 Business Description
- 12.8.3 Products and Services
- 12.8.4 Financial Overview
- 12.8.5 SWOT Analysis
- 12.8.6 Key Developments
- 12.9 uWatch Ltd.
- 12.9.1 Key Facts
- 12.9.2 Business Description
- 12.9.3 Products and Services
- 12.9.4 Financial Overview
- 12.9.5 SWOT Analysis
- 12.9.6 Key Developments
- 12.10 Fallenmelder TRAPMASTER
- 12.10.1 Key Facts
- 12.10.2 Business Description
- 12.10.3 Products and Services
- 12.10.4 Financial Overview
- 12.10.5 SWOT Analysis
- 12.10.6 Key Developments
- 12.11 TFK Handels GmbH (Reviermanager)
- 12.11.1 Key Facts
- 12.11.2 Business Description
- 12.11.3 Products and Services
- 12.11.4 Financial Overview
- 12.11.5 SWOT Analysis
- 12.11.6 Key Developments
- 12.12 WildMelder.de
- 12.12.1 Key Facts
- 12.12.2 Business Description
- 12.12.3 Products and Services
- 12.12.4 Financial Overview
- 12.12.5 SWOT Analysis
- 12.12.6 Key Developments
- 12.13 Triotos
- 12.13.1 Key Facts
- 12.13.2 Business Description
- 12.13.3 Products and Services
- 12.13.4 Financial Overview
- 12.13.5 SWOT Analysis
- 12.13.6 Key Developments
- 12.14 BOARMASTER
- 12.14.1 Key Facts
- 12.14.2 Business Description
- 12.14.3 Products and Services
- 12.14.4 Financial Overview
- 12.14.5 SWOT Analysis
- 12.14.6 Key Developments
13. Appendix
- 13.1 About The Insight Partners
- 13.2 Word Index