|
|
市場調査レポート
商品コード
1095016
デジタルエクスペリエンスモニタリングの世界市場:2028年までの予測、市場分析:企業規模別、展開タイプ別、エンドユーザー別Digital Experience Monitoring Market Forecast to 2028 - COVID-19 Impact and Global Analysis By Enterprise Size, Deployment Type, and End-User |
||||||
|
|
|||||||


| デジタルエクスペリエンスモニタリングの世界市場:2028年までの予測、市場分析:企業規模別、展開タイプ別、エンドユーザー別 |
|
出版日: 2022年05月18日
発行: The Insight Partners
ページ情報: 英文 180 Pages
納期: 即納可能
|
- 全表示
- 概要
- 図表
- 目次
世界のデジタルエクスペリエンスモニタリングの市場規模は、2021年に21億5,671万米ドルとなりました。同市場は、2022年~2028年にかけて15.9%のCAGRで拡大し、2028年には59億6,087万米ドルに達すると予測されています。
当レポートでは、世界のデジタルエクスペリエンスモニタリング市場について調査し、市場の概要とともに、企業規模別、展開タイプ別、エンドユーザー別、地域別の動向、および市場に参入する企業のプロファイルなどを提供しています。
目次
第1章 イントロダクション
第2章 重要ポイント
第3章 調査手法
第4章 デジタルエクスペリエンスモニタリング市場情勢
第5章 デジタルエクスペリエンスモニタリング市場-主要な市場力学
- 市場促進要因
- 市場抑制要因
- 市場の機会
- 今後の動向
- 促進要因と抑制要因の影響分析
第6章 デジタルエクスペリエンスモニタリング市場-世界の市場分析
- 世界のデジタルエクスペリエンスモニタリング市場概要
- 世界のデジタルエクスペリエンスモニタリング市場の予測と分析
- 市場における位置づけ-主要企業5社
第7章 デジタルエクスペリエンスモニタリング市場分析-企業規模別
- 概要
- デジタルエクスペリエンスモニタリング市場、企業規模別(2021年および2028年)
- 大企業
- 中小企業
第8章 デジタルエクスペリエンスモニタリング市場-展開タイプ別
- 概要
- デジタルエクスペリエンスモニタリング市場、展開タイプ別(2021年および2028年)
- オンプレミス
- クラウド
第9章 デジタルエクスペリエンスモニタリング市場分析-エンドユーザー別
- 概要
- デジタルエクスペリエンスモニタリング市場、エンドユーザー別(2021年および2028年)
- BFSI
- IT・電気通信
- 小売・消費財
- ヘルスケア・ライフサイエンス
- その他
第10章 デジタルエクスペリエンスモニタリング市場-地域別分析
- 概要
- 北米:デジタルエクスペリエンスモニタリング市場
- 欧州:デジタルエクスペリエンスモニタリング市場
- アジア太平洋:デジタルエクスペリエンスモニタリング市場
- 中東・アフリカ:デジタルエクスペリエンスモニタリング市場
- 南米:デジタルエクスペリエンスモニタリング市場
第11章 デジタルエクスペリエンスモニタリング市場に対するCOVID-19パンデミックの影響
- 概要
- 北米:COVID-19パンデミックの影響評価
- 欧州:COVID-19パンデミックの影響評価
- アジア太平洋:COVID-19パンデミックの影響評価
- 中東・アフリカ:COVID-19パンデミックの影響評価
- 南米:COVID-19パンデミックの影響評価
第12章 業界情勢
第13章 企業プロファイル
- AppDynamics LLC
- BMC Software, Inc.
- Broadcom Inc.
- Catchpoint Systems, inc.
- Dynatrace LLC
- IBM Corporation
- Micro Focus
- Oracle Corporation
- Riverbed Technology, Inc.
- SAP SE
- ControlUp Technologies LTD
- Lakeside Software, LLC
- Aternity LLC
- Nexthink SA
第14章 付録
List Of Tables
- Table 1. Global Digital Experience Monitoring Market, Revenue and Forecast, 2019-2028 (US$ Mn)
- Table 2. North America Digital Experience Monitoring Market, Revenue and Forecast To 2028 - By Enterprise Size (US$ million)
- Table 3. North America Digital Experience Monitoring Market, Revenue and Forecast To 2028 - By Deployment Type (US$ million)
- Table 4. North America Digital Experience Monitoring Market, Revenue and Forecast To 2028 - By End User (US$ million)
- Table 5. North America Digital Experience Monitoring Market, Revenue and Forecast To 2028 - By Country (US$ million)
- Table 6. US Digital Experience Monitoring Market, Revenue and Forecast to 2028 - By Enterprise Size (US$ million)
- Table 7. US Digital Experience Monitoring Market, Revenue and Forecast to 2028 - By Deployment Type (US$ million)
- Table 8. US Digital Experience Monitoring Market, Revenue and Forecast to 2028 - By End User (US$ million)
- Table 9. Canada Digital Experience Monitoring Market, Revenue and Forecast to 2028 - By Enterprise Size (US$ million)
- Table 10. Canada Digital Experience Monitoring Market, Revenue and Forecast to 2028 - By Deployment Type (US$ million)
- Table 11. Canada Digital Experience Monitoring Market, Revenue and Forecast to 2028 - By End User (US$ million)
- Table 12. Mexico Digital Experience Monitoring Market, Revenue and Forecast to 2028 - By Enterprise Size (US$ million)
- Table 13. Mexico Digital Experience Monitoring Market, Revenue and Forecast to 2028 - By Deployment Type (US$ million)
- Table 14. Mexico Digital Experience Monitoring Market, Revenue and Forecast to 2028 - By End User (US$ million)
- Table 15. Europe Digital Experience Monitoring Market, Revenue and Forecast To 2028 - By Enterprise Size (US$ million)
- Table 16. Europe Digital Experience Monitoring Market, Revenue and Forecast To 2028 - By Deployment Type (US$ million)
- Table 17. Europe Digital Experience Monitoring Market, Revenue and Forecast To 2028 - By End User (US$ million)
- Table 18. Europe Digital Experience Monitoring Market, Revenue and Forecast To 2028 - By Country (US$ million)
- Table 19. Germany Digital Experience Monitoring Market, Revenue and Forecast to 2028 - By Enterprise Size (US$ million)
- Table 20. Germany Digital Experience Monitoring Market, Revenue and Forecast to 2028 - By Deployment Type (US$ million)
- Table 21. Germany Digital Experience Monitoring Market, Revenue and Forecast to 2028 - By End User (US$ million)
- Table 22. France Digital Experience Monitoring Market, Revenue and Forecast to 2028 - By Enterprise Size (US$ million)
- Table 23. France Digital Experience Monitoring Market, Revenue and Forecast to 2028 - By Deployment Type (US$ million)
- Table 24. France Digital Experience Monitoring Market, Revenue and Forecast to 2028 - By End User (US$ million)
- Table 25. Italy Digital Experience Monitoring Market, Revenue and Forecast to 2028 - By Enterprise Size (US$ million)
- Table 26. Italy Digital Experience Monitoring Market, Revenue and Forecast to 2028 - By Deployment Type (US$ million)
- Table 27. Italy Digital Experience Monitoring Market, Revenue and Forecast to 2028 - By End User (US$ million)
- Table 28. UK Digital Experience Monitoring Market, Revenue and Forecast to 2028 - By Enterprise Size (US$ million)
- Table 29. UK Digital Experience Monitoring Market, Revenue and Forecast to 2028 - By Deployment Type (US$ million)
- Table 30. UK Digital Experience Monitoring Market, Revenue and Forecast to 2028 - By End User (US$ million)
- Table 31. Russia Digital Experience Monitoring Market, Revenue and Forecast to 2028 - By Enterprise Size (US$ million)
- Table 32. Russia Digital Experience Monitoring Market, Revenue and Forecast to 2028 - By Deployment Type (US$ million)
- Table 33. Russia Digital Experience Monitoring Market, Revenue and Forecast to 2028 - By End User (US$ million)
- Table 34. Rest of Europe Digital Experience Monitoring Market, Revenue and Forecast to 2028 - By Enterprise Size (US$ million)
- Table 35. Rest of Europe Digital Experience Monitoring Market, Revenue and Forecast to 2028 - By Deployment Type (US$ million)
- Table 36. Rest of Europe Digital Experience Monitoring Market, Revenue and Forecast to 2028 - By End User (US$ million)
- Table 37. APAC Digital Experience Monitoring Market, Revenue and Forecast To 2028 - By Enterprise Size (US$ million)
- Table 38. APAC Digital Experience Monitoring Market, Revenue and Forecast To 2028 - By Deployment Type (US$ million)
- Table 39. APAC Digital Experience Monitoring Market, Revenue and Forecast To 2028 - By End User (US$ million)
- Table 40. APAC Digital Experience Monitoring Market, Revenue and Forecast To 2028 - By Country (US$ million)
- Table 41. Australia Digital Experience Monitoring Market, Revenue and Forecast to 2028 - By Enterprise Size (US$ million)
- Table 42. Australia Digital Experience Monitoring Market, Revenue and Forecast to 2028 - By Deployment Type (US$ million)
- Table 43. Australia Digital Experience Monitoring Market, Revenue and Forecast to 2028 - By End User (US$ million)
- Table 44. China Digital Experience Monitoring Market, Revenue and Forecast to 2028 - By Enterprise Size (US$ million)
- Table 45. China Digital Experience Monitoring Market, Revenue and Forecast to 2028 - By Deployment Type (US$ million)
- Table 46. China Digital Experience Monitoring Market, Revenue and Forecast to 2028 - By End User (US$ million)
- Table 47. India Digital Experience Monitoring Market, Revenue and Forecast to 2028 - By Enterprise Size (US$ million)
- Table 48. India Digital Experience Monitoring Market, Revenue and Forecast to 2028 - By Deployment Type (US$ million)
- Table 49. India Digital Experience Monitoring Market, Revenue and Forecast to 2028 - By End User (US$ million)
- Table 50. Japan Digital Experience Monitoring Market, Revenue and Forecast to 2028 - By Enterprise Size (US$ million)
- Table 51. Japan Digital Experience Monitoring Market, Revenue and Forecast to 2028 - By Deployment Type (US$ million)
- Table 52. Japan Digital Experience Monitoring Market, Revenue and Forecast to 2028 - By End User (US$ million)
- Table 53. South Korea Digital Experience Monitoring Market, Revenue and Forecast to 2028 - By Enterprise Size (US$ million)
- Table 54. South Korea Digital Experience Monitoring Market, Revenue and Forecast to 2028 - By Deployment Type (US$ million)
- Table 55. South Korea Digital Experience Monitoring Market, Revenue and Forecast to 2028 - By End User (US$ million)
- Table 56. Rest of APAC Digital Experience Monitoring Market, Revenue and Forecast to 2028 - By Enterprise Size (US$ million)
- Table 57. Rest of APAC Digital Experience Monitoring Market, Revenue and Forecast to 2028 - By Deployment Type (US$ million)
- Table 58. Rest of APAC Digital Experience Monitoring Market, Revenue and Forecast to 2028 - By End User (US$ million)
- Table 59. MEA Digital Experience Monitoring Market, Revenue and Forecast To 2028 - By Enterprise Size (US$ million)
- Table 60. MEA Digital Experience Monitoring Market, Revenue and Forecast To 2028 - By Deployment Type (US$ million)
- Table 61. MEA Digital Experience Monitoring Market, Revenue and Forecast To 2028 - By End User (US$ million)
- Table 62. MEA Digital Experience Monitoring Market, Revenue and Forecast to 2028 - By Country (US$ million)
- Table 63. Saudi Arabia Digital Experience Monitoring Market, Revenue and Forecast to 2028 - By Enterprise Size (US$ million)
- Table 64. Saudi Arabia Digital Experience Monitoring Market, Revenue and Forecast to 2028 - By Deployment Type (US$ million)
- Table 65. Saudi Arabia Digital Experience Monitoring Market, Revenue and Forecast to 2028 - By End User (US$ million)
- Table 66. UAE Digital Experience Monitoring Market, Revenue and Forecast to 2028 - By Enterprise Size (US$ million)
- Table 67. UAE Digital Experience Monitoring Market, Revenue and Forecast to 2028 - By Deployment Type (US$ million)
- Table 68. UAE Digital Experience Monitoring Market, Revenue and Forecast to 2028 - By End User (US$ million)
- Table 69. South Africa Digital Experience Monitoring Market, Revenue and Forecast to 2028 - By Enterprise Size (US$ million)
- Table 70. South Africa Digital Experience Monitoring Market, Revenue and Forecast to 2028 - By Deployment Type (US$ million)
- Table 71. South Africa Digital Experience Monitoring Market, Revenue and Forecast to 2028 - By End User (US$ million)
- Table 72. Rest of MEA Digital Experience Monitoring Market, Revenue and Forecast to 2028 - By Enterprise Size (US$ million)
- Table 73. Rest of MEA Digital Experience Monitoring Market, Revenue and Forecast to 2028 - By Deployment Type (US$ million)
- Table 74. Rest of MEA Digital Experience Monitoring Market, Revenue and Forecast to 2028 - By End User (US$ million)
- Table 75. SAM Digital Experience Monitoring Market, Revenue and Forecast To 2028 - By Enterprise Size (US$ million)
- Table 76. SAM Digital Experience Monitoring Market, Revenue and Forecast To 2028 - By Deployment Type (US$ million)
- Table 77. SAM Digital Experience Monitoring Market, Revenue and Forecast To 2028 - By End User (US$ million)
- Table 78. SAM Digital Experience Monitoring Market, Revenue and Forecast To 2028 - By Country (US$ million)
- Table 79. Brazil Digital Experience Monitoring Market, Revenue and Forecast to 2028 - By Enterprise Size (US$ million)
- Table 80. Brazil Digital Experience Monitoring Market, Revenue and Forecast to 2028 - By Deployment Type (US$ million)
- Table 81. Brazil Digital Experience Monitoring Market, Revenue and Forecast to 2028 - By End User (US$ million)
- Table 82. Argentina Digital Experience Monitoring Market, Revenue and Forecast to 2028 - By Enterprise Size (US$ million)
- Table 83. Argentina Digital Experience Monitoring Market, Revenue and Forecast to 2028 - By Deployment Type (US$ million)
- Table 84. Argentina Digital Experience Monitoring Market, Revenue and Forecast to 2028 - By End User (US$ million)
- Table 85. Rest of SAM Digital Experience Monitoring Market, Revenue and Forecast to 2028 - By Enterprise Size (US$ million)
- Table 86. Rest of SAM Digital Experience Monitoring Market, Revenue and Forecast to 2028 - By Deployment Type (US$ million)
- Table 87. Rest of SAM Digital Experience Monitoring Market, Revenue and Forecast to 2028 - By End User (US$ million)
- Table 88. Glossary of Terms, Digital Experience Monitoring Market
List Of Figures
- Figure 1. Digital Experience Monitoring Market Segmentation
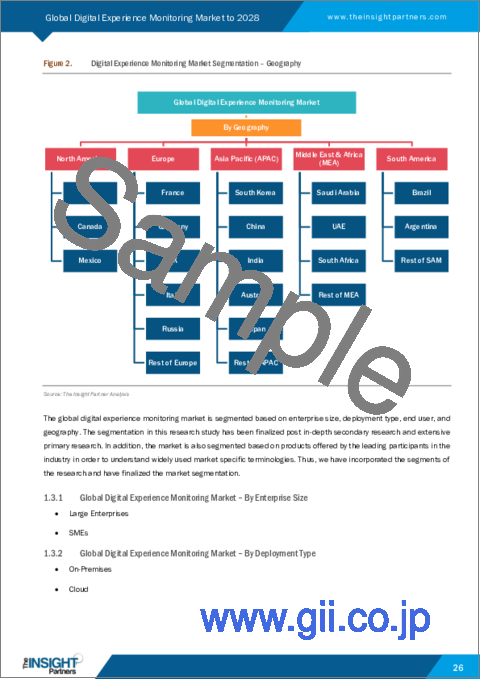
- Figure 2. Digital Experience Monitoring Market Segmentation - Geography
- Figure 3. Digital Experience Monitoring Market Overview
- Figure 4. Digital Experience Monitoring Market, By Enterprise Size
- Figure 5. Digital Experience Monitoring Market, By Deployment Type
- Figure 6. Digital Experience Monitoring Market, By End User
- Figure 7. Digital Experience Monitoring Market, By Region
- Figure 8. North America: PEST Analysis
- Figure 9. Europe: PEST Analysis
- Figure 10. APAC: PEST Analysis
- Figure 11. MEA: PEST Analysis
- Figure 12. SAM: PEST Analysis
- Figure 13. Digital Experience Monitoring Market - Ecosystem Analysis
- Figure 14. Expert Opinion
- Figure 15. Digital Experience Monitoring Market Impact Analysis of Drivers and Restraints
- Figure 16. Global Digital Experience Monitoring Market
- Figure 17. Global Digital Experience Monitoring Market, Forecast and Analysis (US$ Mn)
- Figure 18. Market Positioning - Top Five Players
- Figure 19. Digital Experience Monitoring Market Revenue Share, by Enterprise Size (2021 and 2028)
- Figure 20. Large Enterprises: Digital Experience Monitoring Market - Revenue and Forecast to 2028 (US$ Million)
- Figure 21. SMEs: Digital Experience Monitoring Market - Revenue and Forecast to 2028 (US$ Million)
- Figure 22. Digital Experience Monitoring Market Revenue Share, by Deployment Type (2021 and 2028)
- Figure 23. On-Premises: Digital Experience Monitoring Market - Revenue and Forecast to 2028 (US$ Million)
- Figure 24. Cloud: Digital Experience Monitoring Market - Revenue and Forecast to 2028 (US$ Million)
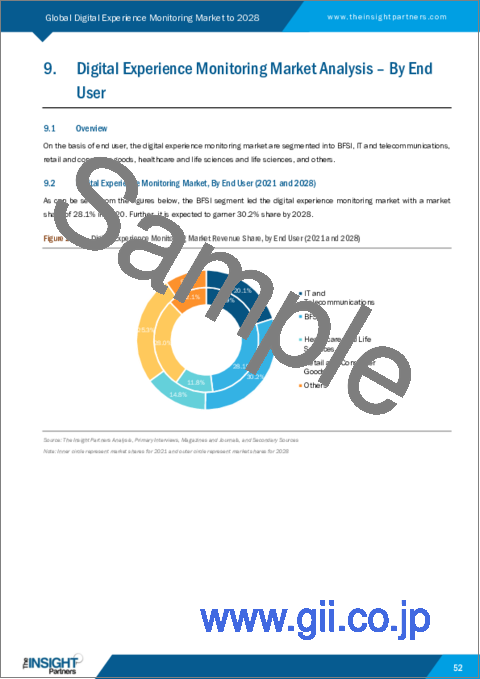
- Figure 25. Digital Experience Monitoring Market Revenue Share, by End User (2021 and 2028)
- Figure 26. BFSI: Digital Experience Monitoring Market - Revenue and Forecast to 2028 (US$ Million)
- Figure 27. IT and Telecommunications: Digital Experience Monitoring Market - Revenue and Forecast to 2028 (US$ Million)
- Figure 28. Retail and Consumer Goods: Digital Experience Monitoring Market - Revenue and Forecast to 2028 (US$ Million)
- Figure 29. Healthcare and Life Sciences: Digital Experience Monitoring Market - Revenue and Forecast to 2028 (US$ Million)
- Figure 30. Others: Digital Experience Monitoring Market - Revenue and Forecast to 2028 (US$ Million)
- Figure 31. Global Digital Experience Monitoring Market Breakdown, By Region, 2021 & 2028 (%)
- Figure 32. North America Digital Experience Monitoring Market, Revenue and Forecast to 2028 (US$ million)
- Figure 33. North America Digital Experience Monitoring Market Breakdown, By Enterprise Size, 2021 & 2028 (%)
- Figure 34. North America Digital Experience Monitoring Market Breakdown, By Deployment Type, 2021 & 2028 (%)
- Figure 35. North America Digital Experience Monitoring Market Breakdown, By End User, 2021 & 2028 (%)
- Figure 36. North America Digital Experience Monitoring Market Breakdown, by Country, 2021 & 2028 (%)
- Figure 37. US Digital Experience Monitoring Market, Revenue and Forecast to 2028 (US$ million)
- Figure 38. Canada Digital Experience Monitoring Market, Revenue and Forecast to 2028 (US$ million)
- Figure 39. Mexico Digital Experience Monitoring Market, Revenue and Forecast to 2028 (US$ million)
- Figure 40. Europe Digital Experience Monitoring Market, Revenue and Forecast To 2028 (US$ million)
- Figure 41. Europe Digital Experience Monitoring Market Breakdown, By Enterprise Size, 2021 & 2028 (%)
- Figure 42. Europe Digital Experience Monitoring Market Breakdown, By Deployment Type, 2021 & 2028 (%)
- Figure 43. Europe Digital Experience Monitoring Market Breakdown, By End User, 2021 & 2028 (%)
- Figure 44. Europe Digital Experience Monitoring Market Breakdown, by Country, 2021 & 2028(%)
- Figure 45. Germany Digital Experience Monitoring Market, Revenue and Forecast to 2028 (US$ million)
- Figure 46. France Digital Experience Monitoring Market, Revenue and Forecast to 2028 (US$ million)
- Figure 47. Italy Digital Experience Monitoring Market, Revenue and Forecast to 2028 (US$ million)
- Figure 48. UK Digital Experience Monitoring Market, Revenue and Forecast to 2028 (US$ million)
- Figure 49. Russia Digital Experience Monitoring Market, Revenue and Forecast to 2028 (US$ million)
- Figure 50. Rest of Europe Digital Experience Monitoring Market, Revenue and Forecast to 2028 (US$ million)
- Figure 51. APAC Digital Experience Monitoring Market, Revenue and Forecast To 2028 (US$ million)
- Figure 52. APAC Digital Experience Monitoring Market Breakdown, By Enterprise Size, 2021 & 2028 (%)
- Figure 53. APAC Digital Experience Monitoring Market Breakdown, By Deployment Type, 2021 & 2028 (%)
- Figure 54. APAC Digital Experience Monitoring Market Breakdown, By End User, 2021 & 2028 (%)
- Figure 55. APAC Digital Experience Monitoring Market Breakdown, by Country, 2021 & 2028 (%)
- Figure 56. Australia Digital Experience Monitoring Market, Revenue and Forecast To 2028 (US$ million)
- Figure 57. China Digital Experience Monitoring Market, Revenue and Forecast To 2028 (US$ million)
- Figure 58. India Digital Experience Monitoring Market, Revenue and Forecast To 2028 (US$ million)
- Figure 59. Japan Digital Experience Monitoring Market, Revenue and Forecast To 2028 (US$ million)
- Figure 60. South Korea Digital Experience Monitoring Market, Revenue and Forecast To 2028 (US$ million)
- Figure 61. Rest of APAC Digital Experience Monitoring Market, Revenue and Forecast To 2028 (US$ million)
- Figure 62. MEA Digital Experience Monitoring Market, Revenue and Forecast to 2028 (US$ million)
- Figure 63. MEA Digital Experience Monitoring Market Breakdown, By Enterprise Size, 2021 & 2028 (%)
- Figure 64. MEA Digital Experience Monitoring Market Breakdown, By Deployment Type, 2021 & 2028 (%)
- Figure 65. MEA Digital Experience Monitoring Market Breakdown, By End User, 2021 & 2028 (%)
- Figure 66. MEA Digital Experience Monitoring Market Breakdown, By Country, 2021 & 2028 (%)
- Figure 67. Saudi Arabia Digital Experience Monitoring Market, Revenue and Forecast To 2028 (US$ million)
- Figure 68. UAE Digital Experience Monitoring Market, Revenue and Forecast To 2028 (US$ million)
- Figure 69. South Africa Digital Experience Monitoring Market, Revenue and Forecast To 2028 (US$ million)
- Figure 70. Rest of MEA Digital Experience Monitoring Market, Revenue and Forecast To 2028 (US$ million)
- Figure 71. SAM Digital Experience Monitoring Market, Revenue and Forecast to 2028 (US$ million)
- Figure 72. SAM Digital Experience Monitoring Market Breakdown, By Enterprise Size, 2021 & 2028 (%)
- Figure 73. SAM Digital Experience Monitoring Market Breakdown, By Deployment Type, 2021 & 2028 (%)
- Figure 74. SAM Digital Experience Monitoring Market Breakdown, By End User, 2021 & 2028 (%)
- Figure 75. SAM Digital Experience Monitoring Market Breakdown, By Country, 2021 & 2028 (%)
- Figure 76. Brazil Digital Experience Monitoring Market, Revenue and Forecast to 2028 (US$ million)
- Figure 77. Argentina Digital Experience Monitoring Market, Revenue and Forecast to 2028 (US$ million)
- Figure 78. Rest of SAM Digital Experience Monitoring Market, Revenue and Forecast to 2028 (US$ million)
- Figure 79. Impact of COVID-19 Pandemic in North American Country Markets
- Figure 80. Impact of COVID-19 Pandemic in European Country Markets
- Figure 81. Impact of COVID-19 Pandemic in APAC Country Markets
- Figure 82. Impact of COVID-19 Pandemic in MEA Country Markets
- Figure 83. Impact of COVID-19 Pandemic in SAM Country Markets
The global digital experience monitoring market size is expected to grow from US$ 2,156.71 million in 2021 to US$ 5,960.87 million by 2028. Digital experience monitoring market size is estimated to grow at a CAGR of 15.9% from 2022 to 2028.
The customer feedback system critical to any functional and profitable industry has been enhanced thanks to technology improvements. For example, companies are implementing an online feedback system using a cutting-edge Customer Relationship Management (CRM). As a result, client input directly aids in making real-time modifications and updating the company's software to conduct a real-time assessment of the quality and adjust or change as needed. Any company experiencing a digital transition must implement digital experience monitoring systems. Streamlining the digital procedures involved in running a company lays a strong basis for future system changes or ongoing innovation. The rise in the adoption of technologies such as the Internet of things (IoT), artificial intelligence (AI), and big data across industries fuels the digital experience monitoring market share, and it aids businesses in resolving issues and improving IT decisions concerning devices and application performance. According to Statista, as of 2022, 35.82 billion IoT devices are installed worldwide, and by 2025, there will be 75.44 billion devices. From smartwatches to voice assistants, IoT gadgets are changing the way we work, communicate, and interact with one another. Consumer internet and media devices, such as smartphones, automobiles, IT infrastructure, and asset tracking and monitoring are the most important IoT devices in the consumer market. End-user adoption of smart devices is a major driver of end-user experience monitoring, which will boost the demand for the digital experience monitoring market.
Cloud and mobility are hastening an unprecedented wave of corporate upheaval, with 70% of the top ten global enterprises being founded for the first time. Companies such as Amazon, Southwest Airlines, Apple, Disney, TD Bank, and others emphasize their customers and end-user experience to enhance the software/application they deliver thus impacting the digital experience monitoring market share. As more digital services go beyond firewalls and Application Performance Management (APM) becomes less cost-effective, end-user or digital experience monitoring (DEM) technologies will become increasingly popular. Therefore, modern end-user digital experience monitoring solutions are specially built to monitor performance and availability from the user's perspective.
Insurers utilize IoT to identify risk correctly, improve client interaction, and speed up and simplify the underwriting and claims process in the finance industry. For example, auto insurers have traditionally used indirect factors to determine premiums, such as a driver's age, residence, and creditworthiness. Owing to the Internet of things, data on driver behavior and vehicle use, such as automobile speed and frequency of night driving, is now available. Insurers may contact clients more regularly and provide new services based on the collected data thanks to the technology. Customers frequently deal primarily with agents or brokers and only get the insurer directly for policy renewal or claims management, making the digital experience monitoring market suitable for efficiency advantages. Thus, to enhance the performance of IoT application and system, end-user or digital experience monitoring (DEM) plays a crucial role.
Impact of COVID-19 Pandemic on Asia Pacific Digital Experience Monitoring Market
APAC is highly affected by the COVID-19 pandemic due to many cases. The country is the most crucial manufacturer and industrial producer since it trades more manufacturing goods than any other country worldwide, and it is a world leader in several types of goods. The Center for Strategic and International Studies has reviewed the estimates of China's growth, and a drop was observed in GDP in 2020. Other major economies, such as India, South Korea, Australia, and Japan, have also been impacted by the pandemic and are experiencing a decline in the digital experience monitoring market growth. However, the increasing number of COVID-19 cases and high death rates in countries, such as India and various Southeast Asian countries, slightly affected the market growth in 2020. Furthermore, the region's growing use of cutting-edge technologies, such as AI and IoT, would drive the market after the COVID-19 pandemic. These technologies are becoming increasingly significant in enhancing IT choices and assisting organizations in effectively solving challenges linked to user experience and device performance. Hence, the impact of the COVID-19 pandemic on the growth of various industries in the region slightly influenced the digital experience monitoring market growth in 2020.
Digital experience monitoring market analysis by enterprise size, the digital experience monitoring market is segmented into large enterprises and SMEs. Digital experience monitoring market analysis by deployment type, the market is segmented into on-premises and cloud. Based on end-user, the digital experience monitoring market is segmented into BFSI, IT and telecommunications, retail and consumer goods, healthcare and life sciences, and others. Based on geography, the global market is segmented into five major regions-North America, Europe, Asia Pacific (APAC), Middle East & Africa (MEA), and South America (SAM).
The global digital experience monitoring market has been derived using primary and secondary sources. To begin the research process, exhaustive secondary research has been conducted using internal and external sources to obtain qualitative and quantitative information related to the market. The process also serves the purpose of obtaining an overview and digital experience monitoring market forecast concerning all the market segments. Also, primary interviews were conducted with industry participants to validate data and gain more analytical insights into the topic. Participants in this process include industry experts such as VPs, business development managers, market intelligence managers, national sales managers, along with external consultants such as valuation experts, research analysts, and key opinion leaders, specializing in the digital experience monitoring market.
BMC Software, Inc.; Broadcom Inc.; AppDynamics LLC; Dynatrace LLC; IBM Corporation; ControlUp Technologies LTD; Lakeside Software, LLC; Aternity LLC; Nexthink SA; and Catchpoint Systems, inc. are among the key companies operating in the digital experience monitoring market.
Reasons to Buy:
Save and reduce time carrying out entry-level research by identifying the growth, size, leading players and segments in the global digital experience monitoring market.
Highlights key business priorities in order to assist companies to realign their business strategies
The key findings and recommendations highlight crucial progressive industry trends in the global digital experience monitoring market, thereby allowing players across the value chain to develop effective long-term strategies
Develop/modify business expansion plans by using substantial growth offering developed and emerging markets
Scrutinize in-depth global market trends and outlook coupled with the factors driving the market, as well as those hindering it
Enhance the decision-making process by understanding the strategies that underpin commercial interest with respect to client products, segmentation, pricing and distribution
Table Of Contents
1. Introduction
- 1.1 Scope of the Study
- 1.2 The Insight Partners Research Report Guidance
- 1.3 Market Segmentation
- 1.3.1 Global Digital Experience Monitoring Market - By Enterprise Size
- 1.3.2 Global Digital Experience Monitoring Market - By Deployment Type
- 1.3.3 Global Digital Experience Monitoring Market - By End User
- 1.3.4 Global Digital Experience Monitoring Market - By Geography
2. Key Takeaways
3. Research Methodology
- 3.1 Coverage
- 3.2 Secondary Research
- 3.3 Primary Research
4. Digital Experience Monitoring Market Landscape
- 4.1 Market Overview
- 4.2 PEST Analysis
- 4.2.1 North America
- 4.2.2 Europe
- 4.2.3 APAC
- 4.2.4 MEA
- 4.2.5 SAM
- 4.3 Ecosystem Analysis
- 4.4 Expert Opinion
5. Digital Experience Monitoring Market - Key Market Dynamics
- 5.1 Market Drivers
- 5.1.1 Demand for Better End-user Experience
- 5.1.2 Adoption of Cutting-edge Technologies
- 5.2 Market Restraints
- 5.2.1 Implementation Risk of Monitoring Systems
- 5.3 Market Opportunities
- 5.3.1 Adoption of AI & IoT in Fintech business
- 5.4 Future Trends
- 5.4.1 EUEM overshadows APM
- 5.5 Impact Analysis of Drivers and Restraints
6. Digital Experience Monitoring Market - Global Market Analysis
- 6.1 Global Digital Experience Monitoring Market Overview
- 6.2 Global Digital Experience Monitoring Market Forecast and Analysis
- 6.3 Market Positioning - Top Five Players
7. Digital Experience Monitoring Market Analysis - By Enterprise Size
- 7.1 Overview
- 7.2 Digital Experience Monitoring Market, By Enterprise Size (2021 and 2028)
- 7.3 Large Enterprises
- 7.3.1 Large Enterprises: Digital Experience Monitoring Market - Revenue and Forecast to 2028 (US$ Million)
- 7.4 SMEs
- 7.4.1 Overview
- 7.4.2 SMEs: Digital Experience Monitoring Market - Revenue and Forecast to 2028 (US$ Million)
8. Digital Experience Monitoring Market - By Deployment Type
- 8.1 Overview
- 8.2 Digital Experience Monitoring, by Deployment Type (2021 and 2028)
- 8.3 On-Premises
- 8.3.1 Overview
- 8.3.2 On-Premises: Digital Experience Monitoring Market - Revenue and Forecast to 2028 (US$ Million)
- 8.4 Cloud
- 8.4.1 Overview
- 8.4.2 Cloud: Digital Experience Monitoring Market - Revenue and Forecast to 2028 (US$ Million)
9. Digital Experience Monitoring Market Analysis - By End User
- 9.1 Overview
- 9.2 Digital Experience Monitoring Market, By End User (2021 and 2028)
- 9.3 BFSI
- 9.3.1 Overview
- 9.3.2 BFSI: Digital Experience Monitoring Market - Revenue and Forecast to 2028 (US$ Million)
- 9.4 IT and Telecommunications
- 9.4.1 IT and Telecommunications: Digital Experience Monitoring Market - Revenue and Forecast to 2028 (US$ Million)
- 9.5 Retail and Consumer Goods
- 9.5.1 Retail and Consumer Goods: Digital Experience Monitoring Market - Revenue and Forecast to 2028 (US$ Million)
- 9.6 Healthcare and Life Sciences
- 9.6.1 Healthcare and Life Sciences: Digital Experience Monitoring Market - Revenue and Forecast to 2028 (US$ Million)
- 9.7 Others
- 9.7.1 Others: Digital Experience Monitoring Market - Revenue and Forecast to 2028 (US$ Million)
10. Digital Experience Monitoring Market - Geographic Analysis
- 10.1 Overview
- 10.2 North America: Digital Experience Monitoring Market
- 10.2.1 Overview
- 10.2.2 North America Digital Experience Monitoring Market, Revenue and Forecast to 2028 (US$ million)
- 10.2.3 North America Digital Experience Monitoring Market Breakdown, By Enterprise Size
- 10.2.4 North America Digital Experience Monitoring Market Breakdown, By Deployment Type
- 10.2.5 North America Digital Experience Monitoring Market Breakdown, By End User
- 10.2.6 North America Digital Experience Monitoring Market Breakdown, by Country
- 10.2.6.1 US Digital Experience Monitoring Market, Revenue and Forecast to 2028
- 10.2.6.1.1 US Digital Experience Monitoring Market Breakdown, By Enterprise Size
- 10.2.6.1.2 US Digital Experience Monitoring Market Breakdown, By Deployment Type
- 10.2.6.1.3 US Digital Experience Monitoring Market Breakdown, By End User
- 10.2.6.2 Canada Digital Experience Monitoring Market, Revenue and Forecast to 2028
- 10.2.6.2.1 Canada Digital Experience Monitoring Market Breakdown, By Enterprise Size
- 10.2.6.2.2 Canada Digital Experience Monitoring Market Breakdown, By Deployment Type
- 10.2.6.2.3 Canada Digital Experience Monitoring Market Breakdown, By End User
- 10.2.6.3 Mexico Digital Experience Monitoring Market, Revenue and Forecast to 2028
- 10.2.6.3.1 Mexico Digital Experience Monitoring Market Breakdown, By Enterprise Size
- 10.2.6.3.2 Mexico Digital Experience Monitoring Market Breakdown, By Deployment Type
- 10.2.6.3.3 Mexico Digital Experience Monitoring Market Breakdown, By End User
- 10.2.6.1 US Digital Experience Monitoring Market, Revenue and Forecast to 2028
- 10.3 Europe: Digital Experience Monitoring Market
- 10.3.1 Overview
- 10.3.2 Europe Digital Experience Monitoring Market Revenue and Forecast to 2028 (US$ million)
- 10.3.3 Europe Digital Experience Monitoring Market Breakdown, By Enterprise Size
- 10.3.4 Europe Digital Experience Monitoring Market Breakdown, By Deployment Type
- 10.3.5 Europe Digital Experience Monitoring Market Breakdown, By End User
- 10.3.6 Europe Digital Experience Monitoring Market Breakdown, by Country
- 10.3.6.1 Germany Digital Experience Monitoring Market, Revenue and Forecast to 2028
- 10.3.6.1.1 Germany Digital Experience Monitoring Market Breakdown, By Enterprise Size
- 10.3.6.1.2 Germany Digital Experience Monitoring Market Breakdown, By Deployment Type
- 10.3.6.1.3 Germany Digital Experience Monitoring Market Breakdown, By End User
- 10.3.6.2 France Digital Experience Monitoring Market, Revenue and Forecast to 2028
- 10.3.6.2.1 France Digital Experience Monitoring Market Breakdown, By Enterprise Size
- 10.3.6.2.2 France Digital Experience Monitoring Market Breakdown, By Deployment Type
- 10.3.6.2.3 France Digital Experience Monitoring Market Breakdown, By End User
- 10.3.6.3 Italy Digital Experience Monitoring Market, Revenue and Forecast to 2028
- 10.3.6.3.1 Italy Digital Experience Monitoring Market Breakdown, By Enterprise Size
- 10.3.6.3.2 Italy Digital Experience Monitoring Market Breakdown, By Deployment Type
- 10.3.6.3.3 Italy Digital Experience Monitoring Market Breakdown, By End User
- 10.3.6.4 UK Digital Experience Monitoring Market, Revenue and Forecast to 2028
- 10.3.6.4.1 UK Digital Experience Monitoring Market Breakdown, By Enterprise Size
- 10.3.6.4.2 UK Digital Experience Monitoring Market Breakdown, By Deployment Type
- 10.3.6.4.3 UK Digital Experience Monitoring Market Breakdown, By End User
- 10.3.6.5 Russia Digital Experience Monitoring Market, Revenue and Forecast to 2028
- 10.3.6.5.1 Russia Digital Experience Monitoring Market Breakdown, By Enterprise Size
- 10.3.6.5.2 Russia Digital Experience Monitoring Market Breakdown, By Deployment Type
- 10.3.6.5.3 Russia Digital Experience Monitoring Market Breakdown, By End User
- 10.3.6.6 Rest of Europe Digital Experience Monitoring Market, Revenue and Forecast to 2028
- 10.3.6.6.1 Rest of Europe Digital Experience Monitoring Market Breakdown, By Enterprise Size
- 10.3.6.6.2 Rest of Europe Digital Experience Monitoring Market Breakdown, By Deployment Type
- 10.3.6.6.3 Rest of Europe Digital Experience Monitoring Market Breakdown, By End User
- 10.3.6.1 Germany Digital Experience Monitoring Market, Revenue and Forecast to 2028
- 10.4 APAC: Digital Experience Monitoring Market
- 10.4.1 Overview
- 10.4.2 APAC Digital Experience Monitoring Market, Revenue and Forecast to 2028 (US$ million)
- 10.4.3 APAC Digital Experience Monitoring Market Breakdown, By Enterprise Size
- 10.4.4 APAC Digital Experience Monitoring Market Breakdown, By Deployment Type
- 10.4.5 APAC Digital Experience Monitoring Market Breakdown, By End User
- 10.4.6 APAC Digital Experience Monitoring Market Breakdown, by Country
- 10.4.6.1 Australia Digital Experience Monitoring Market, Revenue and Forecast to 2028 (US$ million)
- 10.4.6.1.1 Australia Digital Experience Monitoring Market Breakdown, By Enterprise Size
- 10.4.6.1.2 Australia Digital Experience Monitoring Market Breakdown, By Deployment Type
- 10.4.6.1.3 Australia Digital Experience Monitoring Market Breakdown, By End User
- 10.4.6.2 China Digital Experience Monitoring Market, Revenue and Forecast to 2028 (US$ million)
- 10.4.6.2.1 China Digital Experience Monitoring Market Breakdown, By Enterprise Size
- 10.4.6.2.2 China Digital Experience Monitoring Market Breakdown, By Deployment Type
- 10.4.6.2.3 China Digital Experience Monitoring Market Breakdown, By End User
- 10.4.6.3 India Digital Experience Monitoring Market, Revenue and Forecast to 2028 (US$ million)
- 10.4.6.3.1 India Digital Experience Monitoring Market Breakdown, By Enterprise Size
- 10.4.6.3.2 India Digital Experience Monitoring Market Breakdown, By Deployment Type
- 10.4.6.3.3 India Digital Experience Monitoring Market Breakdown, By End User
- 10.4.6.4 Japan Digital Experience Monitoring Market, Revenue and Forecast to 2028 (US$ million)
- 10.4.6.4.1 Japan Digital Experience Monitoring Market Breakdown, By Enterprise Size
- 10.4.6.4.2 Japan Digital Experience Monitoring Market Breakdown, By Deployment Type
- 10.4.6.4.3 Japan Digital Experience Monitoring Market Breakdown, By End User
- 10.4.6.5 South Korea Digital Experience Monitoring Market, Revenue and Forecast to 2028 (US$ million)
- 10.4.6.5.1 South Korea Digital Experience Monitoring Market Breakdown, By Enterprise Size
- 10.4.6.5.2 South Korea Digital Experience Monitoring Market Breakdown, By Deployment Type
- 10.4.6.5.3 South Korea Digital Experience Monitoring Market Breakdown, By End User
- 10.4.6.6 Rest of APAC Digital Experience Monitoring Market, Revenue and Forecast to 2028 (US$ million)
- 10.4.6.6.1 Rest of APAC Digital Experience Monitoring Market Breakdown, By Enterprise Size
- 10.4.6.6.2 Rest of APAC Digital Experience Monitoring Market Breakdown, By Deployment Type
- 10.4.6.6.3 Rest of APAC Digital Experience Monitoring Market Breakdown, By End User
- 10.4.6.1 Australia Digital Experience Monitoring Market, Revenue and Forecast to 2028 (US$ million)
- 10.5 MEA: Digital Experience Monitoring Market
- 10.5.1 Overview
- 10.5.2 MEA Digital Experience Monitoring Market, Revenue and Forecast to 2028 (US$ million)
- 10.5.3 MEA Digital Experience Monitoring Market Breakdown, By Enterprise Size
- 10.5.4 MEA Digital Experience Monitoring Market Breakdown, By Deployment Type
- 10.5.5 MEA Digital Experience Monitoring Market Breakdown, By End User
- 10.5.6 MEA Digital Experience Monitoring Market Breakdown, By Country
- 10.5.6.1 Saudi Arabia Digital Experience Monitoring Market, Revenue and Forecast to 2028 (US$ million)
- 10.5.6.1.1 Saudi Arabia Digital Experience Monitoring Market Breakdown, By Enterprise Size
- 10.5.6.1.2 Saudi Arabia Digital Experience Monitoring Market Breakdown, By Deployment Type
- 10.5.6.1.3 Saudi Arabia Digital Experience Monitoring Market Breakdown, By End User
- 10.5.6.2 UAE Digital Experience Monitoring Market, Revenue and Forecast to 2028 (US$ million)
- 10.5.6.2.1 UAE Digital Experience Monitoring Market Breakdown, By Enterprise Size
- 10.5.6.2.2 UAE Digital Experience Monitoring Market Breakdown, By Deployment Type
- 10.5.6.2.3 UAE Digital Experience Monitoring Market Breakdown, By End User
- 10.5.6.3 South Africa Digital Experience Monitoring Market, Revenue and Forecast to 2028 (US$ million)
- 10.5.6.3.1 South Africa Digital Experience Monitoring Market Breakdown, By Enterprise Size
- 10.5.6.3.2 South Africa Digital Experience Monitoring Market Breakdown, By Deployment Type
- 10.5.6.3.3 South Africa Digital Experience Monitoring Market Breakdown, By End User
- 10.5.6.4 Rest of MEA Digital Experience Monitoring Market, Revenue and Forecast to 2028 (US$ million)
- 10.5.6.4.1 Rest of MEA Digital Experience Monitoring Market Breakdown, By Enterprise Size
- 10.5.6.4.2 Rest of MEA Digital Experience Monitoring Market Breakdown, By Deployment Type
- 10.5.6.4.3 Rest of MEA Digital Experience Monitoring Market Breakdown, By End User
- 10.5.6.1 Saudi Arabia Digital Experience Monitoring Market, Revenue and Forecast to 2028 (US$ million)
- 10.6 SAM: Digital Experience Monitoring Market
- 10.6.1 Overview
- 10.6.2 SAM Digital Experience Monitoring Market, Revenue and Forecast to 2028 (US$ million)
- 10.6.3 SAM Digital Experience Monitoring Market Breakdown, By Enterprise Size
- 10.6.4 SAM Digital Experience Monitoring Market Breakdown, By Deployment Type
- 10.6.5 SAM Digital Experience Monitoring Market Breakdown, By End User
- 10.6.6 SAM Digital Experience Monitoring Market Breakdown, By Country
- 10.6.6.1 Brazil Digital Experience Monitoring Market, Revenue and Forecast to 2028
- 10.6.6.1.1 Brazil Digital Experience Monitoring Market Breakdown, By Enterprise Size
- 10.6.6.1.2 Brazil Digital Experience Monitoring Market Breakdown, By Deployment Type
- 10.6.6.1.3 Brazil Digital Experience Monitoring Market Breakdown, By End User
- 10.6.6.2 Argentina Digital Experience Monitoring Market, Revenue and Forecast to 2028
- 10.6.6.2.1 Argentina Digital Experience Monitoring Market Breakdown, By Enterprise Size
- 10.6.6.2.2 Argentina Digital Experience Monitoring Market Breakdown, By Deployment Type
- 10.6.6.2.3 Argentina Digital Experience Monitoring Market Breakdown, By End User
- 10.6.6.3 Rest of SAM Digital Experience Monitoring Market, Revenue and Forecast to 2028
- 10.6.6.3.1 Rest of SAM Digital Experience Monitoring Market Breakdown, By Enterprise Size
- 10.6.6.3.2 Rest of SAM Digital Experience Monitoring Market Breakdown, By Deployment Type
- 10.6.6.3.3 Rest of SAM Digital Experience Monitoring Market Breakdown, By End User
- 10.6.6.1 Brazil Digital Experience Monitoring Market, Revenue and Forecast to 2028
11. Impact of COVID-19 Pandemic on Digital Experience Monitoring Market
- 11.1 Overview
- 11.2 North America: Impact Assessment of COVID-19 Pandemic
- 11.3 Europe: Impact Assessment of COVID-19 Pandemic
- 11.4 APAC: Impact Assessment of COVID-19 Pandemic
- 11.5 MEA: Impact Assessment of COVID-19 Pandemic
- 11.6 SAM: Impact Assessment of COVID-19 Pandemic
12. Industry Landscape
- 12.1 Overview
- 12.2 Market Initiative
- 12.3 Merger and Acquisition
- 12.4 New Development
13. Company Profiles
- 13.1 AppDynamics LLC
- 13.1.1 Key Facts
- 13.1.2 Business Description
- 13.1.3 Products and Services
- 13.1.4 Financial Overview
- 13.1.5 SWOT Analysis
- 13.1.6 Key Developments
- 13.2 BMC Software, Inc.
- 13.2.1 Key Facts
- 13.2.2 Business Description
- 13.2.3 Products and Services
- 13.2.4 Financial Overview
- 13.2.5 SWOT Analysis
- 13.2.6 Key Developments
- 13.3 Broadcom Inc.
- 13.3.1 Key Facts
- 13.3.2 Business Description
- 13.3.3 Products and Services
- 13.3.4 Financial Overview
- 13.3.5 SWOT Analysis
- 13.3.6 Key Developments
- 13.4 Catchpoint Systems, inc.
- 13.4.1 Key Facts
- 13.4.2 Business Description
- 13.4.3 Products and Services
- 13.4.4 Financial Overview
- 13.4.5 SWOT Analysis
- 13.4.6 Key Developments
- 13.5 Dynatrace LLC
- 13.5.1 Key Facts
- 13.5.2 Business Description
- 13.5.3 Products and Services
- 13.5.4 Financial Overview
- 13.5.5 SWOT Analysis
- 13.5.6 Key Developments
- 13.6 IBM Corporation
- 13.6.1 Key Facts
- 13.6.2 Business Description
- 13.6.3 Products and Services
- 13.6.4 Financial Overview
- 13.6.5 SWOT Analysis
- 13.6.6 Key Developments
- 13.7 Micro Focus
- 13.7.1 Key Facts
- 13.7.2 Business Description
- 13.7.3 Products and Services
- 13.7.4 Financial Overview
- 13.7.5 SWOT Analysis
- 13.7.6 Key Developments
- 13.8 Oracle Corporation
- 13.8.1 Key Facts
- 13.8.2 Business Description
- 13.8.3 Products and Services
- 13.8.4 Financial Overview
- 13.8.5 SWOT Analysis
- 13.8.6 Key Developments
- 13.9 Riverbed Technology, Inc.
- 13.9.1 Key Facts
- 13.9.2 Business Description
- 13.9.3 Products and Services
- 13.9.4 Financial Overview
- 13.9.5 SWOT Analysis
- 13.9.6 Key Developments
- 13.10 SAP SE
- 13.10.1 Key Facts
- 13.10.2 Business Description
- 13.10.3 Products and Services
- 13.10.4 Financial Overview
- 13.10.5 SWOT Analysis
- 13.10.6 Key Developments
- 13.11 ControlUp Technologies LTD
- 13.11.1 Key Facts
- 13.11.2 Business Description
- 13.11.3 Products and Services
- 13.11.4 Financial Overview
- 13.11.5 SWOT Analysis
- 13.11.6 Key Developments
- 13.12 Lakeside Software, LLC
- 13.12.1 Key Facts
- 13.12.2 Business Description
- 13.12.3 Products and Services
- 13.12.4 Financial Overview
- 13.12.5 SWOT Analysis
- 13.12.6 Key Developments
- 13.13 Aternity LLC
- 13.13.1 Key Facts
- 13.13.2 Business Description
- 13.13.3 Products and Services
- 13.13.4 Financial Overview
- 13.13.5 SWOT Analysis
- 13.13.6 Key Developments
- 13.14 Nexthink SA
- 13.14.1 Key Facts
- 13.14.2 Business Description
- 13.14.3 Products and Services
- 13.14.4 Financial Overview
- 13.14.5 SWOT Analysis
- 13.14.6 Key Developments
14. Appendix
- 14.1 About The Insight Partners
- 14.2 Glossary