|
|
市場調査レポート
商品コード
1126261
プラスチック燃料化市場の2028年までの予測-技術(熱分解、ガス化、解重合)、最終製品(原油、水素、その他)、地域別の世界分析Plastic to Fuel Market Forecast to 2028 - COVID-19 Impact and Global Analysis By Technology (Pyrolysis, Gasification, and Depolymerization) and End Product (Crude Oil, Hydrogen, and Others) and Geography |
||||||
|
|
|||||||


| プラスチック燃料化市場の2028年までの予測-技術(熱分解、ガス化、解重合)、最終製品(原油、水素、その他)、地域別の世界分析 |
|
出版日: 2022年08月23日
発行: The Insight Partners
ページ情報: 英文 118 Pages
納期: 即納可能
|
- 全表示
- 概要
- 図表
- 目次
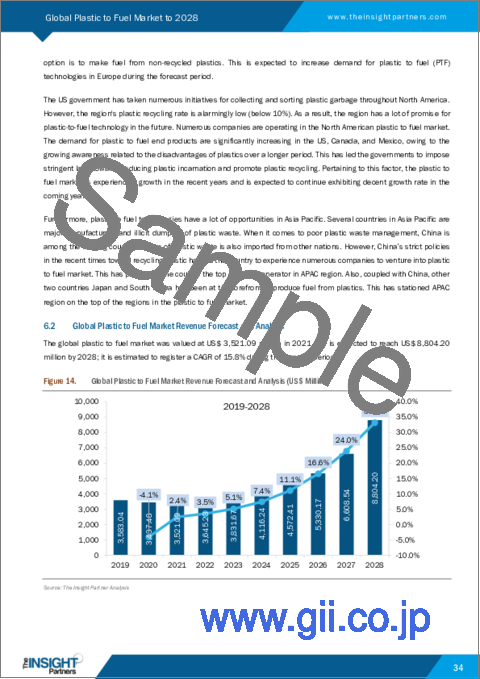
プラスチック燃料化市場は、2028年には88億420万米ドルに達すると予測されており、2022年から2028年までのCAGRは15.8%と予想されています。
プラスチック燃料化は、廃棄物から高品質のプラスチック製品を作り出すことに依存する、循環型経済コンセプトの技術です。この技術は資本集約的であり、市場の投資収益率(ROI)時間は通常2~5年となっています。しかし、廃棄物管理インフラが確立されていることから、この分野では米国と欧州で生産者の数が増加しています。プラスチック燃料化技術の開発が進み、その重要性が高まっていることから、埋立地に送られるゴミの量を減らし、燃料やその他の価値ある商品を生み出すことで、アメリカの交通システムや地域経済の原動力となっているのです。廃プラスチックは、化学原料や燃料に変換することができます。これらの変換技術に用いられるプロセスとして、解重合と熱分解があります。
技術に基づいて、ガス化セグメントは、世界のプラスチック燃料化市場分析の予測期間中に最も速いCAGRで成長することが期待されます。ガス化とは、廃プラスチックを空気や蒸気で加熱し、「合成ガス」または「シンガス」として知られる有用な産業用ガスミックスを作り出すプロセスです。これは、ディーゼルやガソリンを作るために使用されるか、またはボイラーで電力を作るために直接燃焼させることができます。この技術は、世界中で産業用燃料のニーズが高まっていることから、普及が進んでいます。プラスチック燃料化市場において、ガス化の最も重要な利点は、埋立地のスペースを縮小し、同時にメタンの排出を減少させることです。また、ガス化は世界中の精製、肥料、化学分野で実用化に成功しています。そのため、ガス化の用途が燃料生成に拡大すれば、PTFプラントのオペレーターは、資源を節約し、有害物質の排出を最小限に抑える機会を得ることができます。ガス化の段階的な導入は、より多くのプラスチック燃料化技術の需要を促進するのに役立ち、その後、世界のプラスチック燃料化市場の分析に貢献すると予測されます。
北米諸国は、途方もなく大量にプラスチックを生産し、消費しています。2020年には、医療機器や保護具の生産により、プラスチックの需要が非常に高まりました。このため、プラスチック製の医療機器や保護具の寿命が尽きると、これらの製品はプラスチックの埋立地やピットに廃棄されるため、膨大な量のプラスチック廃棄物が浮き彫りになっています。北米地域には、特に米国とカナダにプラスチック燃料リサイクル会社がいくつかあります。米国でウイルスが大量に発生したことで、さまざまなプラスチック燃料リサイクル装置の操業が不能に陥りました。プラスチック廃棄物を燃料に変換する装置や工場の物流に支障をきたし、その年の生産量は減少しました。このため、企業間だけでなく、プラスチック燃料化市場も減収となりました。
北米では、政府がリサイクルを促進するために絶えず投資を行っており、プラスチックのリサイクルに関する様々な技術の研究開発が北米のプラスチック燃料化市場のシェアに影響を与えています。例えば、プラスチック廃棄物のリサイクルの研究開発に対するDOEの投資は、プラスチック燃料化市場の成長に影響を与えると予想されます。また、米国の人々は高い生活水準を享受しており、一人当たりの所得が高いため、人々の消費能力も計り知れません。その結果、同地域ではより多くのプラスチックが消費され、プラスチック廃棄物の増加に寄与しています。また、北米は技術的に進んだ地域でもあります。IoTやRFIDの技術は、この地域で高い採用率を記録しています。これらの技術は、廃棄物管理システムと統合され、プラスチック廃棄物を他のMSWから分離し、さらに熱分解のような様々な技術で処理され、それによって市場の成長に影響を及ぼしています。このような側面が、プラスチック燃料化市場の成長を後押ししています。
カナダの人口増加に伴い、毎年、国の生産するプラスチック廃棄物の量も増加しています。例えば、カナダ政府によると、プラスチック廃棄物の280万トンは、カナダで毎年埋立地に投棄されています。このプラスチック廃棄物の増加により、政府はプラスチック廃棄物をリサイクルし、原油やディーゼルなどの他の材料を生産するための積極的な措置をとるようになりました。例えば、カナダのトレントン社は、2019年から国内の埋立地に捨てられたプラスチック廃棄物からディーゼル燃料とガソリンを生産することに取り組んでいます。同様に、Sustane Technologiesは、チェスター地区で10トンのプラスチックから1日あたり9,000リットルの合成ディーゼルを生産することを計画しています。また、同社は年間4万~5万トンの都市ゴミを調達し、バイオマスペレットと液体燃料に変換することを目指しています。このように、上記のような要因が、長年にわたるプラスチック燃料化市場の成長に寄与しているのです。
プラスチック燃料化市場のいくつかのプレーヤーは、事業を継続し、年間販売統計を増加させるために、さまざまな戦略を採用しています。例えば、プラスチック燃料化市場プレイヤーの先駆者の一人であるAgilyx Inc.は、2020年に使用後のプラスチック原料管理を行うCyclyx International LLCを立ち上げる戦略を展開しました。この新会社は、廃プラスチックのリサイクルを増やすことを目的としています。この戦略は、今後数年間、Agilyx Incのビジネスを後押しすると予想されます。同様に、2020年にはNexus Fuel LLCとShellが契約に合意し、Nexus Fuel LLCはShellにプラスチック廃棄物由来の熱分解液を4年間で6万トンの量を供給することになっています。
プラスチック燃料化市場の規模は、一次情報および二次情報の両方を用いて算出したものです。まず、市場に関する定性・定量情報を得るために、社内外の情報源を用いて徹底的な二次調査を実施しました。このプロセスは、同地域に関連するすべてのセグメントに関して、プラスチック燃料市場の概要と成長予測を得るという目的も兼ねています。また、データを検証し、このテーマについてより分析的な洞察を得るために、業界関係者やコメンテーターに複数の一次インタビューを実施しました。このプロセスの参加者には、副社長、事業開発マネージャー、市場情報マネージャー、国内販売マネージャーなどの業界専門家、およびプラスチック燃料化市場を専門とする評価専門家、研究アナリスト、キーオピニオンリーダーなどの外部コンサルタントが含まれます。Agilyx Inc.、Cassandra Oil AB、Klean Industries Inc.、Nexus Fuel LLC、OMV Aktiengesellschaft、Bradam Group, LLC、RESYNERGI、MK Aromatics Ltd、Plastic2Oil、Inc、およびPlastic Advanced Recycling Corpは、プラスチック燃料化市場で操業する主要企業の一例です。
目次
第1章 イントロダクション
- 調査範囲
- インサイトパートナーズの調査報告書ガイダンス
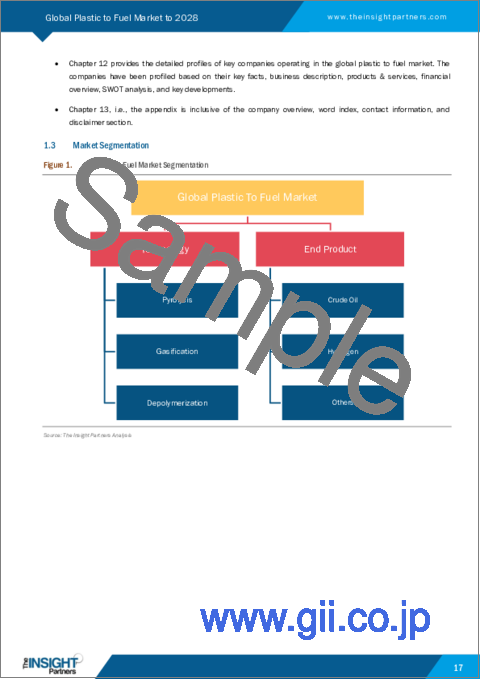
- 市場セグメンテーション
第2章 重要なポイント
第3章 調査手法
- 対象範囲
- 2次調査
- 1次調査
第4章 プラスチック燃料化市場の情勢
- 市場概要
- PEST分析
- 北米-PEST分析
- 欧州-PEST分析
- アジア太平洋-PEST分析
- 世界のその他の地域-PEST分析
- エコシステム分析
第5章 プラスチック燃料化- 主な市場力学
- 市場促進要因
- 燃料製造部門から排出される温室効果ガスに関する意識の高まり
- エネルギー需要の増加
- 市場の抑制要因
- 非再生可能エネルギー源の使用に関する懸念
- 市場機会
- Go Greenプロセスのイントロダクション
- 今後の動向
- 廃棄物燃料化への取り組み
- 推進要因と抑制要因の影響分析
第6章 プラスチック燃料化-世界市場分析
- プラスチックtoフューエルの世界市場概要
- プラスチックtoフューエルの世界市場収益と予測・分析
- 市場のポジショニング-主要5社
- 競合ベンチマーキング
- 競合ベンチマーキング
- 成長マトリクス
第7章 プラスチック燃料化市場-技術別
- プラスチックtoフューエル市場:技術別(2021年、2028年)
- 熱分解
- ガス化
- 解重合
第8章 プラスチック燃料化市場-最終製品別
- プラスチックtoフューエル市場:最終製品別(2021年、2028年)
- 原油
- 水素
- その他
第9章 プラスチック燃料化市場- 地域別分析
- 北米
- 米国
- カナダ
- メキシコ
- 欧州
- ドイツ
- フランス
- イタリア
- 英国
- ロシア
- その他欧州
- APAC
- オーストラリア
- 中国
- インド
- 日本
- 韓国
- APACのその他諸国
- ローワ
第10章 COVID-19のパンデミックによるプラスチック燃料化市場への影響
- 北米
- 欧州
- アジア太平洋地域
- 世界のその他の地域
第11章 業界の情勢
- マーケットイニシアティブ
- 合併・買収
- 新規開発
第12章 企業プロファイル
- Agilyx
- Klean Industries Inc.
- nexus FUELS, LLC
- Plastic2Oil, Inc.
- Cassandra Oil AB
- Bradam Group, LLC.
- RESYNERGI
- MK Aromatics Limited
- Plastic Advanced Recycling Corp.
- OMV Aktiengesellschaft
第13章 付録
- The Insight Partners について
- 単語索引
List Of Tables
- Table 1. Global Plastic to Fuel Market Revenue and Forecast to 2028 (US$ Million)
- Table 2. North America: Plastic to Fuel Market, by Technology - Revenue and Forecast to 2028 (US$ Million)
- Table 3. North America: Plastic to Fuel Market, by End Product - Revenue and Forecast to 2028 (US$ Million)
- Table 4. US: Plastic to Fuel Market, by Technology -Revenue and Forecast to 2028 (US$ Million)
- Table 5. US: Plastic to Fuel Market, by End Product -Revenue and Forecast to 2028 (US$ Million)
- Table 6. Canada: Plastic to Fuel Market, by Technology -Revenue and Forecast to 2028 (US$ Million)
- Table 7. Canada: Plastic to Fuel Market, by End Product -Revenue and Forecast to 2028 (US$ Million)
- Table 8. Mexico: Plastic to Fuel Market, by Technology -Revenue and Forecast to 2028 (US$ Million)
- Table 9. Mexico: Plastic to Fuel Market, by End Product -Revenue and Forecast to 2028 (US$ Million)
- Table 10. Europe: Plastic to Fuel Market, by Technology - Revenue and Forecast to 2028 (US$ Million)
- Table 11. Europe: Plastic to Fuel Market, by End Product - Revenue and Forecast to 2028 (US$ Million)
- Table 12. Germany: Plastic to Fuel Market, by Technology -Revenue and Forecast to 2028 (US$ Million)
- Table 13. Germany: Plastic to Fuel Market, by End Product -Revenue and Forecast to 2028 (US$ Million)
- Table 14. France: Plastic to Fuel Market, by Technology -Revenue and Forecast to 2028 (US$ Million)
- Table 15. France: Plastic to Fuel Market, by End Product -Revenue and Forecast to 2028 (US$ Million)
- Table 16. Italy: Plastic to Fuel Market, by Technology -Revenue and Forecast to 2028 (US$ Million)
- Table 17. Italy: Plastic to Fuel Market, by End Product -Revenue and Forecast to 2028 (US$ Million)
- Table 18. UK: Plastic to Fuel Market, by Technology -Revenue and Forecast to 2028 (US$ Million)
- Table 19. UK: Plastic to Fuel Market, by End Product -Revenue and Forecast to 2028 (US$ Million)
- Table 20. Russia: Plastic to Fuel Market, by Technology -Revenue and Forecast to 2028 (US$ Million)
- Table 21. Russia: Plastic to Fuel Market, by End Product -Revenue and Forecast to 2028 (US$ Million)
- Table 22. Rest of Europe: Plastic to Fuel Market, by Technology -Revenue and Forecast to 2028 (US$ Million)
- Table 23. Rest of Europe: Plastic to Fuel Market, by End Product -Revenue and Forecast to 2028 (US$ Million)
- Table 24. APAC: Plastic to Fuel Market, by Technology - Revenue and Forecast to 2028 (US$ Million)
- Table 25. APAC: Plastic to Fuel Market, by End Product - Revenue and Forecast to 2028 (US$ Million)
- Table 26. Australia: Plastic to Fuel Market, by Technology -Revenue and Forecast to 2028 (US$ Million)
- Table 27. Australia: Plastic to Fuel Market, by End Product -Revenue and Forecast to 2028 (US$ Million)
- Table 28. China: Plastic to Fuel Market, by Technology -Revenue and Forecast to 2028 (US$ Million)
- Table 29. China: Plastic to Fuel Market, by End Product -Revenue and Forecast to 2028 (US$ Million)
- Table 30. India: Plastic to Fuel Market, by Technology -Revenue and Forecast to 2028 (US$ Million)
- Table 31. India: Plastic to Fuel Market, by End Product -Revenue and Forecast to 2028 (US$ Million)
- Table 32. Japan: Plastic to Fuel Market, by Technology -Revenue and Forecast to 2028 (US$ Million)
- Table 33. Japan: Plastic to Fuel Market, by End Product -Revenue and Forecast to 2028 (US$ Million)
- Table 34. South Korea: Plastic to Fuel Market, by Technology -Revenue and Forecast to 2028 (US$ Million)
- Table 35. South Korea: Plastic to Fuel Market, by End Product -Revenue and Forecast to 2028 (US$ Million)
- Table 36. Rest of APAC: Plastic to Fuel Market, by Technology -Revenue and Forecast to 2028 (US$ Million)
- Table 37. Rest of APAC: Plastic to Fuel Market, by End Product -Revenue and Forecast to 2028 (US$ Million)
- Table 38. RoW: Plastic to Fuel Market, by Technology- Revenue and Forecast to 2028 (US$ Million)
- Table 39. RoW: Plastic to Fuel Market, by End Product - Revenue and Forecast to 2028 (US$ Million)
- Table 40. List of Abbreviation
List Of Figures
- Figure 1. Plastic to Fuel Market Segmentation
- Figure 2. Plastic to Fuel Market Segmentation - By Geography
- Figure 3. Global Plastic to Fuel Market Overview
- Figure 4. Plastic to Fuel Market, by Technology
- Figure 5. Plastic to Fuel Market, by End Product
- Figure 6. Plastic to Fuel Market, By Geography
- Figure 7. North America - PEST Analysis
- Figure 8. Europe - PEST Analysis
- Figure 9. Asia-Pacific - PEST Analysis
- Figure 10. Rest of World - PEST Analysis
- Figure 11. Plastic to Fuel Market: Ecosystem Analysis
- Figure 12. Plastic to Fuel Market: Impact Analysis of Drivers and Restraints
- Figure 13. Geographic Overview of Plastic to Fuel Market
- Figure 14. Global Plastic to Fuel Market Revenue Forecast and Analysis (US$ Million)
- Figure 15. Competitive Benchmarking
- Figure 16. Competitive Benchmarking
- Figure 17. Growth Matrix
- Figure 18. Plastic to Fuel Market, by Technology (2021 and 2028)
- Figure 19. Pyrolysis: Plastic to Fuel Market Revenue and Forecast to 2028 (US$ Million)
- Figure 20. Gasification: Plastic to Fuel Market Revenue and Forecast to 2028 (US$ Million)
- Figure 21. Depolymerization: Plastic to Fuel Market Revenue and Forecast to 2028 (US$ Million)
- Figure 22. Plastic to Fuel Market, by End Product (2021 and 2028)
- Figure 23. Crude Oil: Plastic to Fuel Market Revenue and Forecast to 2028 (US$ Million)
- Figure 24. Hydrogen: Plastic to Fuel Market Revenue and Forecast to 2028 (US$ Million)
- Figure 25. Others: Plastic to Fuel Market Revenue and Forecast to 2028 (US$ Million)
- Figure 26. Plastic to Fuel Market Revenue Share, By Region (2021 and 2028)
- Figure 27. North America: Plastic to Fuel Market - Revenue and Forecast to 2028 (US$ Million)
- Figure 28. North America: Plastic to Fuel Market Revenue Share, by Technology (2021 and 2028)
- Figure 29. North America: Plastic to Fuel Market Revenue Share, by End Product (2021 and 2028)
- Figure 30. North America: Plastic to Fuel Market Revenue Share, by Key Country (2021 and 2028)
- Figure 31. US: Plastic to Fuel Market - Revenue and Forecast to 2028 (US$ Million)
- Figure 32. Canada: Plastic to Fuel Market - Revenue and Forecast to 2028 (US$ Million)
- Figure 33. Mexico: Plastic to Fuel Market - Revenue and Forecast to 2028 (US$ Million)
- Figure 34. Europe: Plastic to Fuel Market - Revenue and Forecast to 2028 (US$ Million)
- Figure 35. Europe: Plastic to Fuel Market Revenue Share, by Technology (2021 and 2028)
- Figure 36. Europe: Plastic to Fuel Market Revenue Share, by End Product (2021 and 2028)
- Figure 37. Europe: Plastic to Fuel Market Revenue Share, By Key Country (2021 and 2028)
- Figure 38. Germany: Plastic to Fuel Market - Revenue and Forecast to 2028 (US$ Million)
- Figure 39. France: Plastic to Fuel Market - Revenue and Forecast to 2028 (US$ Million)
- Figure 40. Italy: Plastic to Fuel Market - Revenue and Forecast to 2028 (US$ Million)
- Figure 41. UK: Plastic to Fuel Market - Revenue and Forecast to 2028 (US$ Million)
- Figure 42. Russia: Plastic to Fuel Market - Revenue and Forecast to 2028 (US$ Million)
- Figure 43. Rest of Europe: Plastic to Fuel Market - Revenue and Forecast to 2028 (US$ Million)
- Figure 44. APAC: Plastic to Fuel Market - Revenue and Forecast to 2028 (US$ Million)
- Figure 45. APAC: Plastic to Fuel Market Revenue Share, by Technology (2021 and 2028)
- Figure 46. APAC: Plastic to Fuel Market Revenue Share, by End Product (2021 and 2028)
- Figure 47. APAC: Plastic to Fuel Market Revenue Share, By Key Country (2021 and 2028)
- Figure 48. Australia: Plastic to Fuel Market - Revenue and Forecast to 2028 (US$ Million)
- Figure 49. China: Plastic to Fuel Market - Revenue and Forecast to 2028 (US$ Million)
- Figure 50. India: Plastic to Fuel Market - Revenue and Forecast to 2028 (US$ Million)
- Figure 51. Japan: Plastic to Fuel Market - Revenue and Forecast to 2028 (US$ Million)
- Figure 52. South Korea: Plastic to Fuel Market - Revenue and Forecast to 2028 (US$ Million)
- Figure 53. Rest of APAC: Plastic to Fuel Market - Revenue and Forecast to 2028 (US$ Million)
- Figure 54. RoW: Plastic to Fuel Market - Revenue and Forecast to 2028 (US$ Million)
- Figure 55. RoW: Plastic to Fuel Market Revenue Share, by Technology (2021 and 2028)
- Figure 56. RoW: Plastic to Fuel Market Revenue Share, by End Product (2021 and 2028)
- Figure 57. RoW: Plastic to Fuel Market Revenue Share, By Key Country (2021 and 2028)
- Figure 58. Impact of COVID-19 Pandemic in North American Country Markets
- Figure 59. Impact of COVID-19 Pandemic in Europe Country Markets
- Figure 60. Impact of COVID-19 Pandemic in Asia Pacific Country Markets
- Figure 61. Impact of COVID-19 Pandemic in Rest of World Country Markets
The Plastic to Fuel market is projected to reach US$ 8,804.20 million by 2028; it is expected to grow at a CAGR of 15.8% from 2022 to 2028.
The plastic to fuel is a technology of the circular economy concept, which depends on the creation of high-quality plastic goods from waste. The technology is capital-intensive, and the market's return-on-investment (ROI) time typically ranges from two to five years. However, due to well-established waste management infrastructure, the sector is seeing an increase in the number of producers in the US and Europe. Increasing development in plastics-to-fuel technology and the rising importance of this technology have helped to power America's transportation system and local economies by reducing the amount of garbage sent to landfills and generating fuel and other valuable goods. Waste plastics can be converted to chemical feedstock or fuel. Depolymerization and pyrolysis are the processes used in these conversion technologies.
Based on technology, the gasification segment is expected to grow at a fastest CAGR during the forecast period of global plastic to fuel market analysis. Gasification is the process of heating waste plastic with air or steam to create useful industrial gas mixes known as "synthesis gas" or "syngas." This can then be used to make diesel and petrol, or directly burnt to create power in boilers. This technology is gaining popularity because to the growing need for industrial fuel throughout the world. In the plastic to fuel market, the most important benefit of gasification is that it decreases landfill space needs while simultaneously decreasing methane emissions. In addition, gasification has been successfully used on a commercial scale in the refining, fertilizer, and chemical sectors all over the world. As a result, as the uses for gasification expand into fuel generation, PTF Plant operators will have the opportunity to conserve resources and minimize hazardous emissions. The gradual adoption of gasification will help in propelling the demand for more plastic to fuel technology, and later is projected to contribute towards the global plastic to fuel market analysis.
The North American countries produce and consume plastic in tremendously high volume. In 2020, the demand for plastic rose enormously due to the production of medical devices and protection equipment. This highlighted enormous volume of plastic waste as at the end of life of the plastic made medical devices and protection equipment, these products were disposed to plastic landfills/pits. The North American region has several plastics to fuel recycling companies, especially in the US and Canada. The massive outbreak of the virus in the US had crippled the operations of various plastic to fuel recycling units. The disruption in logistics of plastic waste to fuel conversion units/plants resulted in lower volume of production in the year. This highlighted lower revenue among the companies as well as in the plastic to fuel market.
In North America, constant government initiative and investment to promote recycling and R&D of various technologies of recycling plastic is influencing the North America plastic to fuel market share. For instance, The DOE investment on R&D of plastic waste recycling is expected to influence the plastic to fuel market growth. Moreover, the population of the US enjoys the lofty standard of living, and the spending capacity of people is also immense owing to the high per capita income of the country. This results in the consumption of more plastic across the region contributing to the rise in plastic waste across the region. Also, North America is a technologically advanced region. IoT, and RFID technologies have witnessed high adoptions in this region. These technologies, are integrated with waste management systems to segregate plastic waste from other MSW which is further process thorough various technologies like pyrolysis, thereby influencing the growth of the market. The mentioned aspect will help in driving the plastic to fuel market size.
With the growing population of Canada, the amount of plastic waste produce of the country each year is also rising. For instance, according to the Canadian government 2.8 million tons of plastic waste are dumped into landfills each year in Canada. This rise in plastic waste have influenced the government to active steps for recycling of the same and produce other materials material like crude oil and diesel amongst others. For instance, Trenton a Canada based firm is engaged into producing diesel fuel and gasoline from plastic waste dumped across landfills in the country since 2019. Similarly, Sustane Technologies plans to produce 9,000 litres of synthetic diesel per day from 10 tonnes of plastic at Chester area. The company also aims to procure 40,000 to 50,000 tonnes of municipal garbage per year and convert it into biomass pellets and liquid fuel. Thus, the above-mentioned factors are contributing to the growth of the plastic to fuel market over the years.
Several plastic to fuel market players have adopted different strategies to continue their operations and increase their annual sales statistics. For instance, Agilyx Inc., one of the forerunners in the plastic to fuel market players developed a strategy to launch Cyclyx International LLC, a post-use plastic feedstock management in 2020. The new company aims at increasing recycling of waste plastic. This strategy is anticipated to boost Agilyx Inc's business in the coming years. Similarly, in 2020, Nexus Fuel LLC and Shell agreed on contract, where Nexus Fuel LLC would supply Shell a volume of 60,000 tonnes of pyrolysis liquid derived from plastic waste to Shell over a period of 4years.
The overall plastic to fuel market size has been derived using both primary and secondary sources. To begin the research process, exhaustive secondary research has been conducted using internal and external sources to obtain qualitative and quantitative information related to the market. The process also serves the purpose of obtaining an overview and forecast for the plastic to fuel market growth with respect to all the segments pertaining to the region. Also, multiple primary interviews have been conducted with industry participants and commentators to validate the data, as well as to gain more analytical insights into the topic. The participants of this process include industry experts such as VPs, business development managers, market intelligence managers, and national sales managers, along with external consultants such as valuation experts, research analysts, and key opinion leaders, specializing in the plastic to fuel market. Agilyx Inc.; Cassandra Oil AB; Klean Industries Inc.; Nexus Fuel LLC; OMV Aktiengesellschaft; Bradam Group, LLC; RESYNERGI; MK Aromatics Ltd.; Plastic2Oil, Inc.; and Plastic Advanced Recycling Corp. are among key players operating in the plastic to fuel market.
Reasons to Buy:
Save and reduce time carrying out entry-level research by identifying the growth, size, leading players and segments in the global plastic to fuel market
Highlights key business priorities in order to assist companies to realign their business strategies
The key findings and recommendations highlight crucial progressive industry trends in the global plastic to fuel market, thereby allowing players across the value chain to develop effective long-term strategies
Develop/modify business expansion plans by using substantial growth offering developed and emerging markets
Scrutinize in-depth global market trends and outlook coupled with the factors driving the market, as well as those hindering it
Enhance the decision-making process by understanding the strategies that underpin commercial interest with respect to client products, segmentation, pricing and distribution
Table Of Contents
1. Introduction
- 1.1 Study Scope
- 1.2 The Insight Partners Research Report Guidance
- 1.3 Market Segmentation
2. Key Takeaways
3. Research Methodology
- 3.1 Coverage
- 3.2 Secondary Research
- 3.3 Primary Research
4. Plastic to Fuel Market Landscape
- 4.1 Market Overview
- 4.2 PEST Analysis
- 4.2.1 North America - PEST Analysis
- 4.2.2 Europe - PEST Analysis
- 4.2.3 Asia-Pacific - PEST Analysis
- 4.2.4 Rest of World - PEST Analysis
- 4.3 Ecosystem Analysis
5. Plastic to Fuel - Key Market Dynamics
- 5.1 Market Drivers
- 5.1.1 Growing Awareness Regarding Green House Gas Emission from Fuel Making Sector
- 5.1.2 Increasing Energy Requirement
- 5.2 Market Restraints
- 5.2.1 Concerns Regarding Usage of Non-renewable Energy Sources
- 5.3 Market Opportunities
- 5.3.1 Introduction of Go Green Process
- 5.4 Future Trends
- 5.4.1 Waste to Fuel Initiatives
- 5.5 Impact Analysis of Drivers and Restraints
6. Plastic to Fuel - Global Market Analysis
- 6.1 Global Plastic to Fuel Market Overview
- 6.2 Global Plastic to Fuel Market Revenue Forecast and Analysis
- 6.3 Market Positioning - Five Key Players
- 6.4 Competitive Benchmarking
- 6.4.1 Competitive Benchmarking
- 6.5 Growth Matrix
7. Plastic to Fuel Market- by Technology
- 7.1 Overview
- 7.2 Plastic to Fuel Market, by Technology (2021 and 2028)
- 7.3 Pyrolysis
- 7.3.1 Overview
- 7.3.2 Pyrolysis: Plastic to Fuel Market Revenue and Forecast to 2028 (US$ Million)
- 7.4 Gasification
- 7.4.1 Overview
- 7.4.2 Gasification: Plastic to Fuel Market Revenue and Forecast to 2028 (US$ Million)
- 7.5 Depolymerization
- 7.5.1 Overview
- 7.5.2 Depolymerization: Plastic to Fuel Market Revenue and Forecast to 2028 (US$ Million)
8. Plastic to Fuel Market- by End Product
- 8.1 Overview
- 8.2 Plastic to Fuel Market, by End Product (2021 and 2028)
- 8.3 Crude Oil
- 8.3.1 Overview
- 8.3.2 Crude Oil: Plastic to Fuel Market Revenue and Forecast to 2028 (US$ Million)
- 8.4 Hydrogen
- 8.4.1 Overview
- 8.4.2 Hydrogen: Plastic to Fuel Market Revenue and Forecast to 2028 (US$ Million)
- 8.5 Others
- 8.5.1 Overview
- 8.5.2 Others: Plastic to Fuel Market Revenue and Forecast to 2028 (US$ Million)
9. Plastic to Fuel Market - Geographic Analysis
- 9.1 Overview
- 9.2 North America: Plastic to Fuel Market
- 9.2.1 North America: Plastic to Fuel Market - Revenue and Forecast to 2028 (US$ Million)
- 9.2.2 North America: Plastic to Fuel Market, by Technology
- 9.2.3 North America: Plastic to Fuel Market, by End Product
- 9.2.4 North America: Plastic to Fuel Market, by Key Country
- 9.2.4.1 US: Plastic to Fuel Market - Revenue and Forecast to 2028 (US$ Million)
- 9.2.4.1.1 US: Plastic to Fuel Market, by Technology
- 9.2.4.1.2 US: Plastic to Fuel Market, by End Product
- 9.2.4.2 Canada: Plastic to Fuel Market - Revenue and Forecast to 2028 (US$ Million)
- 9.2.4.2.1 Canada: Plastic to Fuel Market, by Technology
- 9.2.4.2.2 Canada: Plastic to Fuel Market, by End Product
- 9.2.4.3 Mexico: Plastic to Fuel Market - Revenue and Forecast to 2028 (US$ Million)
- 9.2.4.3.1 Mexico: Plastic to Fuel Market, by Technology
- 9.2.4.3.2 Mexico: Plastic to Fuel Market, by End Product
- 9.2.4.1 US: Plastic to Fuel Market - Revenue and Forecast to 2028 (US$ Million)
- 9.3 Europe: Plastic to Fuel Market
- 9.3.1 Europe: Plastic to Fuel Market - Revenue and Forecast to 2028 (US$ Million)
- 9.3.2 Europe: Plastic to Fuel Market, by Technology
- 9.3.3 Europe: Plastic to Fuel Market, by End Product
- 9.3.4 Europe: Plastic to Fuel Market, by Key Country
- 9.3.4.1 Germany: Plastic to Fuel Market - Revenue and Forecast to 2028 (US$ Million)
- 9.3.4.1.1 Germany: Plastic to Fuel Market, by Technology
- 9.3.4.1.2 Germany: Plastic to Fuel Market, by End Product
- 9.3.4.2 France: Plastic to Fuel Market - Revenue and Forecast to 2028 (US$ Million)
- 9.3.4.2.1 France: Plastic to Fuel Market, by Technology
- 9.3.4.2.2 France: Plastic to Fuel Market, by End Product
- 9.3.4.3 Italy: Plastic to Fuel Market - Revenue and Forecast to 2028 (US$ Million)
- 9.3.4.3.1 Italy: Plastic to Fuel Market, by Technology
- 9.3.4.3.2 Italy: Plastic to Fuel Market, by End Product
- 9.3.4.4 UK: Plastic to Fuel Market - Revenue and Forecast to 2028 (US$ Million)
- 9.3.4.4.1 UK: Plastic to Fuel Market, by Technology
- 9.3.4.4.2 UK: Plastic to Fuel Market, by End Product
- 9.3.4.5 Russia: Plastic to Fuel Market - Revenue and Forecast to 2028 (US$ Million)
- 9.3.4.5.1 Russia: Plastic to Fuel Market, by Technology
- 9.3.4.5.2 Russia: Plastic to Fuel Market, by End Product
- 9.3.4.6 Rest of Europe: Plastic to Fuel Market - Revenue and Forecast to 2028 (US$ Million)
- 9.3.4.6.1 Rest of Europe: Plastic to Fuel Market, by Technology
- 9.3.4.6.2 Rest of Europe: Plastic to Fuel Market, by End Product
- 9.3.4.1 Germany: Plastic to Fuel Market - Revenue and Forecast to 2028 (US$ Million)
- 9.4 APAC: Plastic to Fuel Market
- 9.4.1 APAC: Plastic to Fuel Market - Revenue and Forecast to 2028 (US$ Million)
- 9.4.2 APAC: Plastic to Fuel Market, by Technology
- 9.4.3 APAC: Plastic to Fuel Market, by End Product
- 9.4.4 APAC: Plastic to Fuel Market, by Key Country
- 9.4.4.1 Australia: Plastic to Fuel Market - Revenue and Forecast to 2028 (US$ Million)
- 9.4.4.1.1 Australia: Plastic to Fuel Market, by Technology
- 9.4.4.1.2 Australia: Plastic to Fuel Market, by End Product
- 9.4.4.2 China: Plastic to Fuel Market - Revenue and Forecast to 2028 (US$ Million)
- 9.4.4.2.1 China: Plastic to Fuel Market, by Technology
- 9.4.4.2.2 China: Plastic to Fuel Market, by End Product
- 9.4.4.3 India: Plastic to Fuel Market - Revenue and Forecast to 2028 (US$ Million)
- 9.4.4.3.1 India: Plastic to Fuel Market, by Technology
- 9.4.4.3.2 India: Plastic to Fuel Market, by End Product
- 9.4.4.4 Japan: Plastic to Fuel Market - Revenue and Forecast to 2028 (US$ Million)
- 9.4.4.4.1 Japan: Plastic to Fuel Market, by Technology
- 9.4.4.4.2 Japan: Plastic to Fuel Market, by End Product
- 9.4.4.5 South Korea: Plastic to Fuel Market - Revenue and Forecast to 2028 (US$ Million)
- 9.4.4.5.1 South Korea: Plastic to Fuel Market, by Technology
- 9.4.4.5.2 South Korea: Plastic to Fuel Market, by End Product
- 9.4.4.6 Rest of APAC: Plastic to Fuel Market - Revenue and Forecast to 2028 (US$ Million)
- 9.4.4.6.1 Rest of APAC: Plastic to Fuel Market, by Technology
- 9.4.4.6.2 Rest of APAC: Plastic to Fuel Market, by End Product
- 9.4.4.1 Australia: Plastic to Fuel Market - Revenue and Forecast to 2028 (US$ Million)
- 9.5 RoW: Plastic to Fuel Market
- 9.5.1 RoW: Plastic to Fuel Market - Revenue and Forecast to 2028 (US$ Million)
- 9.5.2 RoW: Plastic to Fuel Market, by Technology
- 9.5.3 RoW: Plastic to Fuel Market, by End Product
- 9.5.4 RoW: Plastic to Fuel Market, by Key Country
10. Impact of COVID-19 Pandemic on Plastic to Fuel Market
- 10.1 Overview
- 10.2 North America
- 10.3 Europe
- 10.4 Asia-Pacific
- 10.5 Rest of World
11. Industry Landscape
- 11.1 Market Initiative
- 11.2 Merger and Acquisition
- 11.3 New Development
12. Company Profiles
- 12.1 Agilyx
- 12.1.1 Key Facts
- 12.1.2 Business Description
- 12.1.3 Products and Services
- 12.1.4 Financial Overview
- 12.1.5 SWOT Analysis
- 12.1.6 Key Developments
- 12.2 Klean Industries Inc.
- 12.2.1 Key Facts
- 12.2.2 Business Description
- 12.2.3 Products and Services
- 12.2.4 Financial Overview
- 12.2.5 SWOT Analysis
- 12.2.6 Key Developments
- 12.3 nexus FUELS, LLC
- 12.3.1 Key Facts
- 12.3.2 Business Description
- 12.3.3 Products and Services
- 12.3.4 Financial Overview
- 12.3.5 SWOT Analysis
- 12.3.6 Key Developments
- 12.4 Plastic2Oil, Inc.
- 12.4.1 Key Facts
- 12.4.2 Business Description
- 12.4.3 Products and Services
- 12.4.4 Financial Overview
- 12.4.5 SWOT Analysis
- 12.4.6 Key Developments
- 12.5 Cassandra Oil AB
- 12.5.1 Key Facts
- 12.5.2 Business Description
- 12.5.3 Products and Services
- 12.5.4 Financial Overview
- 12.5.5 SWOT Analysis
- 12.5.6 Key Developments
- 12.6 Bradam Group, LLC.
- 12.6.1 Key Facts
- 12.6.2 Business Description
- 12.6.3 Products and Services
- 12.6.4 Financial Overview
- 12.6.5 SWOT Analysis
- 12.6.6 Key Developments
- 12.7 RESYNERGI
- 12.7.1 Key Facts
- 12.7.2 Business Description
- 12.7.3 Products and Services
- 12.7.4 Financial Overview
- 12.7.5 SWOT Analysis
- 12.7.6 Key Developments
- 12.8 MK Aromatics Limited
- 12.8.1 Key Facts
- 12.8.2 Business Description
- 12.8.3 Products and Services
- 12.8.4 Financial Overview
- 12.8.5 SWOT Analysis
- 12.8.6 Key Developments
- 12.9 Plastic Advanced Recycling Corp.
- 12.9.1 Key Facts
- 12.9.2 Business Description
- 12.9.3 Products and Services
- 12.9.4 Financial Overview
- 12.9.5 SWOT Analysis
- 12.9.6 Key Developments
- 12.10 OMV Aktiengesellschaft
- 12.10.1 Key Facts
- 12.10.2 Business Description
- 12.10.3 Products and Services
- 12.10.4 Financial Overview
- 12.10.5 SWOT Analysis
- 12.10.6 Key Developments
13. Appendix
- 13.1 About The Insight Partners
- 13.2 Word Index