|
|
市場調査レポート
商品コード
1264013
世界のエビ市場:金額、規模、予測(2023年~2028年)、業界動向、成長、シェア、見通し、インフレの影響、企業の機会分析Global Shrimp Market, Volume, Size, Forecast 2023-2028, Industry Trends, Growth, Share, Outlook, Impact of Inflation, Opportunity Company Analysis |
||||||
|
|
|||||||


| 世界のエビ市場:金額、規模、予測(2023年~2028年)、業界動向、成長、シェア、見通し、インフレの影響、企業の機会分析 |
|
出版日: 2023年04月01日
発行: Renub Research
ページ情報: 英文 280 Pages
納期: 即日から翌営業日
|
- 全表示
- 概要
- 図表
- 目次
世界のエビの市場規模は、2022年に469億4,000万米ドルとなり、2028年までに693億5,000万米ドルになると予測されています。2022年~2028年にかけて、CAGRで6.72%の成長が見込まれています。エビ産業の長期的な安定成長の見込みは、その高い需要と供給の改善によるものです。
当レポートでは、世界のエビ市場について調査し、市場の概要とともに、生産別、輸出入別、種別、サイズカテゴリー別、製品形態別、地域別の動向、および市場に参入する企業のプロファイルなどを提供しています。
目次
第1章 イントロダクション
第2章 調査と調査手法
第3章 エグゼクティブサマリー
第4章 市場力学
- 促進要因
- 課題
第5章 SWOT分析
第6章 ポーターのファイブフォース
第7章 世界のエビ市場
第8章 世界のエビ市場の規模
第9章 市場シェア- 世界エビ分析
- 生産別
- 輸入別
- 輸出別
- 種別
- サイズカテゴリー別
- 製品形態別
第10章 世界のエビ市場、生産別
- 中国
- インド
- ベトナム
- インドネシア
- タイ
- フィリピン
- バングラデシュ
- マレーシア
- ラテンアメリカ
- その他
第11章 世界のエビ市場、輸入別
- EU
- 米国
- 中国
- 日本
- 韓国
- カナダ
- ベトナム
第12章 世界のエビ市場、輸出別
- エクアドル
- インド
- ベトナム
- インドネシア
- 中国
- タイ
- アルゼンチン
第13章 世界のエビ市場、種別
- バナメイエビ
- ウシエビ
- オニテナガエビ
- その他
第14章 世界のエビ市場、サイズカテゴリー別
- 15未満
- 15~20
- 21~25
- 26~30
- 31~40
- 41~50
- 51~60
- 61~70
- 70超
第15章 世界のエビ市場、製品形態別
- フライ用
- 調理済み
- 殻無し
- グリーン/無頭
- グリーン/有頭
- その他
第16章 企業分析-世界のエビ市場
- Avanti Feeds Ltd
- High Liner Foods Inc.
- Surapon Foods
- Thai Union Group
- The Waterbase Ltd.
- Royal Greenland
- Maruha Nichiro Corporation
- Marine Harvest
- Mowi ASA
List of Figures
- Figure-01: Global - Shrimp Market (Billion US$), 2018 - 2022
- Figure-02: Global - Forecast for Shrimp Market (Billion US$), 2023 - 2028
- Figure-03: Global - Shrimp Volume (Thousand Tons), 2018 - 2022
- Figure-04: Global - Forecast for Shrimp Volume (Thousand Tons), 2023 - 2028
- Figure-05: China - Shrimp Production Market (Million US$), 2018 - 2022
- Figure-06: China - Forecast for Shrimp Production Market (Million US$), 2023 - 2028
- Figure-07: China - Shrimp Production Volume (Thousand Tons), 2018 - 2022
- Figure-08: China - Forecast for Shrimp Production Volume (Thousand Tons), 2023 - 2028
- Figure-09: Other - Shrimp Production Market (Million US$), 2018 - 2022
- Figure-10: Other - Forecast for Shrimp Production Market (Million US$), 2023 - 2028
- Figure-11: Other - Shrimp Production Volume (Thousand Tons), 2018 - 2022
- Figure-12: Other - Forecast for Shrimp Production Volume (Thousand Tons), 2023 - 2028
- Figure-13: India - Shrimp Production Market (Million US$), 2018 - 2022
- Figure-14: India - Forecast for Shrimp Production Market (Million US$), 2023 - 2028
- Figure-15: India - Shrimp Production Volume (Thousand Tons), 2018 - 2022
- Figure-16: India - Forecast for Shrimp Production Volume (Thousand Tons), 2023 - 2028
- Figure-17: Vietnam - Shrimp Production Market (Million US$), 2018 - 2022
- Figure-18: Vietnam - Forecast for Shrimp Production Market (Million US$), 2023 - 2028
- Figure-19: Vietnam - Shrimp Production Volume (Thousand Tons), 2018 - 2022
- Figure-20: Vietnam - Forecast for Shrimp Production Volume (Thousand Tons), 2023 - 2028
- Figure-21: Indonesia - Shrimp Production Market (Million US$), 2018 - 2022
- Figure-22: Indonesia - Forecast for Shrimp Production Market (Million US$), 2023 - 2028
- Figure-23: Indonesia - Shrimp Production Volume (Thousand Tons), 2018 - 2022
- Figure-24: Indonesia - Forecast for Shrimp Production Volume (Thousand Tons), 2023 - 2028
- Figure-25: Thailand - Shrimp Production Market (Million US$), 2018 - 2022
- Figure-26: Thailand - Forecast for Shrimp Production Market (Million US$), 2023 - 2028
- Figure-27: Thailand - Shrimp Production Volume (Thousand Tons), 2018 - 2022
- Figure-28: Thailand - Forecast for Shrimp Production Volume (Thousand Tons), 2023 - 2028
- Figure-29: Philippines - Shrimp Production Market (Million US$), 2018 - 2022
- Figure-30: Philippines - Forecast for Shrimp Production Market (Million US$), 2023 - 2028
- Figure-31: Philippines - Shrimp Production Volume (Thousand Tons), 2018 - 2022
- Figure-32: Philippines - Forecast for Shrimp Production Volume (Thousand Tons), 2023 - 2028
- Figure-33: Bangladesh - Shrimp Production Market (Million US$), 2018 - 2022
- Figure-34: Bangladesh - Forecast for Shrimp Production Market (Million US$), 2023 - 2028
- Figure-35: Bangladesh - Shrimp Production Volume (Thousand Tons), 2018 - 2022
- Figure-36: Bangladesh - Forecast for Shrimp Production Volume (Thousand Tons), 2023 - 2028
- Figure-37: Malaysia - Shrimp Production Market (Million US$), 2018 - 2022
- Figure-38: Malaysia - Forecast for Shrimp Production Market (Million US$), 2023 - 2028
- Figure-39: Malaysia - Shrimp Production Volume (Thousand Tons), 2018 - 2022
- Figure-40: Malaysia - Forecast for Shrimp Production Volume (Thousand Tons), 2023 - 2028
- Figure-41: Latin America - Shrimp Production Market (Million US$), 2018 - 2022
- Figure-42: Latin America - Forecast for Shrimp Production Market (Million US$), 2023 - 2028
- Figure-43: Latin America - Shrimp Production Volume (Thousand Tons), 2018 - 2022
- Figure-44: Latin America - Forecast for Shrimp Production Volume (Thousand Tons), 2023 - 2028
- Figure-45: Others Countries - Shrimp Production Market (Million US$), 2018 - 2022
- Figure-46: Others Countries - Forecast for Shrimp Production Market (Million US$), 2023 - 2028
- Figure-47: Others Countries - Shrimp Production Volume (Thousand Tons), 2018 - 2022
- Figure-48: Others Countries - Forecast for Shrimp Production Volume (Thousand Tons), 2023 - 2028
- Figure-49: European Union 28 - Shrimp Import Volume (Thousand Tons), 2018 - 2022
- Figure-50: European Union 28 - Forecast for Shrimp Import Volume (Thousand Tons), 2023 - 2028
- Figure-51: United States - Shrimp Import Volume (Thousand Tons), 2018 - 2022
- Figure-52: United States - Forecast for Shrimp Import Volume (Thousand Tons), 2023 - 2028
- Figure-53: China - Shrimp Import Volume (Thousand Tons), 2018 - 2022
- Figure-54: China - Forecast for Shrimp Import Volume (Thousand Tons), 2023 - 2028
- Figure-55: Japan - Shrimp Import Volume (Thousand Tons), 2018 - 2022
- Figure-56: Japan - Forecast for Shrimp Import Volume (Thousand Tons), 2023 - 2028
- Figure-57: South Korea - Shrimp Import Volume (Thousand Tons), 2018 - 2022
- Figure-58: South Korea - Forecast for Shrimp Import Volume (Thousand Tons), 2023 - 2028
- Figure-59: Canada - Shrimp Import Volume (Thousand Tons), 2018 - 2022
- Figure-60: Canada - Forecast for Shrimp Import Volume (Thousand Tons), 2023 - 2028
- Figure-61: Vietnam - Shrimp Import Volume (Thousand Tons), 2018 - 2022
- Figure-62: Vietnam - Forecast for Shrimp Import Volume (Thousand Tons), 2023 - 2028
- Figure-63: Ecuador - Shrimp Export Volume (Thousand Tons), 2018 - 2022
- Figure-64: Ecuador - Forecast for Shrimp Export Volume (Thousand Tons), 2023 - 2028
- Figure-65: India - Shrimp Export Volume (Thousand Tons), 2018 - 2022
- Figure-66: India - Forecast for Shrimp Export Volume (Thousand Tons), 2023 - 2028
- Figure-67: Vietnam - Shrimp Export Volume (Thousand Tons), 2018 - 2022
- Figure-68: Vietnam - Forecast for Shrimp Export Volume (Thousand Tons), 2023 - 2028
- Figure-69: Indonesia - Shrimp Export Volume (Thousand Tons), 2018 - 2022
- Figure-70: Indonesia - Forecast for Shrimp Export Volume (Thousand Tons), 2023 - 2028
- Figure-71: China - Shrimp Export Volume (Thousand Tons), 2018 - 2022
- Figure-72: China - Forecast for Shrimp Export Volume (Thousand Tons), 2023 - 2028
- Figure-73: Thailand - Shrimp Export Volume (Thousand Tons), 2018 - 2022
- Figure-74: Thailand - Forecast for Shrimp Export Volume (Thousand Tons), 2023 - 2028
- Figure-75: Argentina - Shrimp Export Volume (Thousand Tons), 2018 - 2022
- Figure-76: Argentina - Forecast for Shrimp Export Volume (Thousand Tons), 2023 - 2028
- Figure-77: Species - L. vannamei Market (Million US$), 2018 - 2022
- Figure-78: Species - Forecast for L. vannamei Market (Million US$), 2023 - 2028
- Figure-79: Species - P. monodon Market (Million US$), 2018 - 2022
- Figure-80: Species - Forecast for P. monodon Market (Million US$), 2023 - 2028
- Figure-81: Species - M.rosenbergii Market (Million US$), 2018 - 2022
- Figure-82: Species - Forecast for M.rosenbergii Market (Million US$), 2023 - 2028
- Figure-83: Species - Others Market (Million US$), 2018 - 2022
- Figure-84: Species - Forecast for Others Market (Million US$), 2023 - 2028
- Figure-85: Size Category - <15 Market (Million US$), 2018 - 2022
- Figure-86: Size Category - Forecast for <15 Market (Million US$), 2023 - 2028
- Figure-87: Size Category - 15-20 Market (Million US$), 2018 - 2022
- Figure-88: Size Category - Forecast for 15-20 Market (Million US$), 2023 - 2028
- Figure-89: Size Category - 21-25 Market (Million US$), 2018 - 2022
- Figure-90: Size Category - Forecast for 21-25 Market (Million US$), 2023 - 2028
- Figure-91: Size Category - 26-30 Market (Million US$), 2018 - 2022
- Figure-92: Size Category - Forecast for 26-30 Market (Million US$), 2023 - 2028
- Figure-93: Size Category - 31-40 Market (Million US$), 2018 - 2022
- Figure-94: Size Category - Forecast for 31-40 Market (Million US$), 2023 - 2028
- Figure-95: Size Category - 41-50 Market (Million US$), 2018 - 2022
- Figure-96: Size Category - Forecast for 41-50 Market (Million US$), 2023 - 2028
- Figure-97: Size Category - 51-60 Market (Million US$), 2018 - 2022
- Figure-98: Size Category - Forecast for 51-60 Market (Million US$), 2023 - 2028
- Figure-99: Size Category - 61-70 Market (Million US$), 2018 - 2022
- Figure-100: Size Category - Forecast for 61-70 Market (Million US$), 2023 - 2028
- Figure-101: Size Category - >70 Market (Million US$), 2018 - 2022
- Figure-102: Size Category - Forecast for >70 Market (Million US$), 2023 - 2028
- Figure-103: Product Form - Breaded Market (Million US$), 2018 - 2022
- Figure-104: Product Form - Forecast for Breaded Market (Million US$), 2023 - 2028
- Figure-105: Product Form - Cooked Market (Million US$), 2018 - 2022
- Figure-106: Product Form - Forecast for Cooked Market (Million US$), 2023 - 2028
- Figure-107: Product Form - Peeled Market (Million US$), 2018 - 2022
- Figure-108: Product Form - Forecast for Peeled Market (Million US$), 2023 - 2028
- Figure-109: Product Form - Green/Head-off Market (Million US$), 2018 - 2022
- Figure-110: Product Form - Forecast for Green/Head-off Market (Million US$), 2023 - 2028
- Figure-111: Product Form - Green/Head-on Market (Million US$), 2018 - 2022
- Figure-112: Product Form - Forecast for Green/Head-on Market (Million US$), 2023 - 2028
- Figure-113: Product Form - Other Forms Market (Million US$), 2018 - 2022
- Figure-114: Product Form - Forecast for Other Forms Market (Million US$), 2023 - 2028
- Figure-115: Avanti Feeds Ltd. - Global Revenue (Million US$), 2018 - 2022
- Figure-116: Avanti Feeds Ltd. - Forecast for Global Revenue (Million US$), 2023 - 2028
- Figure-117: High Liner Foods Inc. - Global Revenue (Million US$), 2018 - 2022
- Figure-118: High Liner Foods Inc. - Forecast for Global Revenue (Million US$), 2023 - 2028
- Figure-119: Surapon Foods - Global Revenue (Million US$), 2018 - 2022
- Figure-120: Surapon Foods - Forecast for Global Revenue (Million US$), 2023 - 2028
- Figure-121: Thai Union Group - Global Revenue (Million US$), 2018 - 2022
- Figure-122: Thai Union Group - Forecast for Global Revenue (Million US$), 2023 - 2028
- Figure-123: The Waterbase Ltd. - Global Revenue (Million US$), 2018 - 2022
- Figure-124: The Waterbase Ltd. - Forecast for Global Revenue (Million US$), 2023 - 2028
- Figure-125: Royal Greenland - Global Revenue (Million US$), 2018 - 2022
- Figure-126: Royal Greenland - Forecast for Global Revenue (Million US$), 2023 - 2028
- Figure-127: Maruha Nichiro Corporation - Global Revenue (Million US$), 2018 - 2022
- Figure-128: Maruha Nichiro Corporation - Forecast for Global Revenue (Million US$), 2023 - 2028
- Figure-129: Marine Harvest - Global Revenue (Million US$), 2018 - 2022
- Figure-130: Marine Harvest - Forecast for Global Revenue (Million US$), 2023 - 2028
- Figure-131: Mowi ASA - Global Revenue (Million US$), 2018 - 2022
- Figure-132: Mowi ASA - Forecast for Global Revenue (Million US$), 2023 - 2028
List of Tables
- Table-01: Global - Shrimp Production Market Share by Countries (Percent), 2018 - 2022
- Table-02: Global - Forecast for Shrimp Production Market Share by Countries (Percent), 2023 - 2028
- Table-03: Global - Shrimp Production Volume Share by Countries (Percent), 2018 - 2022
- Table-04: Global - Forecast for Shrimp Production Volume Share by Countries (Percent), 2023 - 2028
- Table-05: Global - Shrimp Import Volume Share by Countries (Percent), 2018 - 2022
- Table-06: Global - Forecast for Shrimp Import Volume Share by Countries (Percent), 2023 - 2028
- Table-07: Global - Shrimp Export Volume Share by Countries (Percent), 2018 - 2022
- Table-08: Global - Forecast for Shrimp Export Volume Share by Countries (Percent), 2023 - 2028
- Table-09: Global - Shrimp Market Share by Species (Percent), 2018 - 2022
- Table-10: Global - Forecast for Shrimp Market Share by Species (Percent), 2023 - 2028
- Table-11: Global - Shrimp Market Share by Size Category (Percent), 2018 - 2022
- Table-12: Global - Forecast for Shrimp Market Share by Size Category (Percent), 2023 - 2028
- Table-13: Global - Shrimp Market Share by Product Form (Percent), 2018 - 2022
- Table-14: Global - Forecast for Shrimp Market Share by Product Form (Percent), 2023 - 2028
Global Shrimp Market is expected to be US$ 69.35 Billion by 2028, according to Renub Research. Making shrimp one of the most traded species of seafood worldwide. The demand for shrimp is increasing not only in the food industry but also in other sectors such as pharmaceuticals, healthcare, and cosmetics, mainly because of its beneficial properties such as antioxidant and anti-aging effects. Shrimp is an excellent source of protein, phosphorus, and selenium, making it highly nutritious and easy to obtain.
The shrimp industry's stable long-term growth prospects are due to its high demand and improved supply. This makes it a significant driving force behind the growth of the global seafood industry. Additionally, shrimp is a popular ingredient in various dishes, especially in Asian cuisine, which can further increase its popularity and contribute to market expansion.
Global Shrimp Market is projected to experience a compound annual growth rate (CAGR) of 6.72% between 2022 and 2028
To meet market requirements, small-scale farmers in Asian countries are being empowered by governments and organizations to increase stakeholder interaction and involvement in the cluster. Additionally, fiscal reliefs and incentives are being provided by governments to promote shrimp cluster farming in response to the rising global demand for shrimp. The seafood sector has been identified as a high-priority industry by major producing countries.
Therefore, adopting cluster farming through a participatory approach increases shrimp production, promotes sustainability, and reduces the risk of diseases. During the forecast period, the Global Shrimp Market is expected to witness growth, driven by government support for shrimp culture through cluster farming in countries such as China, India, Vietnam, and Thailand. This support is likely to attract new investors to the industry. In 2022, the global shrimp market size was valued at US$ 46.94 Billion.
India and Vietnam have emerged as the World's leading Shrimp Producers
The Global Shrimp market is categorized by producing countries, including China, India, Vietnam, Indonesia, Thailand, Philippines, Bangladesh, Malaysia, and Latin America. India is recognized as a significant supplier of value-added shrimp globally, thanks to its low labor costs and the economy of scale it has achieved by becoming one of the most extensive producers of farmed shrimp. The existing hatcheries, feed mills, and processing plants' capacity provide a solid foundation for future expansion.
Vietnam's shrimp industry faces a persistent challenge of ramping up production to meet the rising demand in both domestic and global markets, fueled by improving living standards. The country's shrimp production has grown significantly over the years, nearing the one million tons mark, mainly due to the cultivation of vannamei shrimp, which offers high yields through intensive farming, unlike black tiger shrimp that have low productivity in extensive farming. Vietnam's shrimp production is expected to rise by expanding the farming area and boosting the productivity of vannamei shrimp.
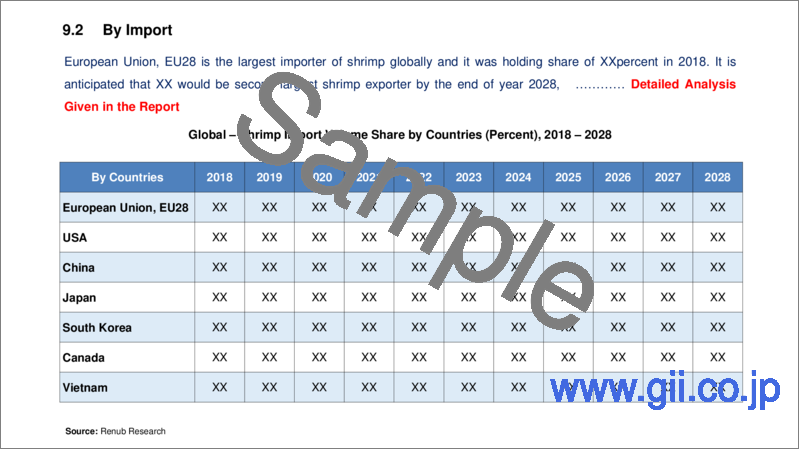
China becomes the Top Shrimp Importer Globally
The Global Shrimp Industry is categorized by importing countries, with China now ranked as the world's top shrimp importer. The other countries in this category include the European Union, EU28, United States of America, Japan, South Korea, Canada, and Vietnam. Due to unfavorable weather conditions, China has experienced a decline in domestic seafood production, leading to a high demand for imported shrimp. As a result, imports have increased to meet supply gaps, especially in the retail and catering industries.
Ecuadorian shrimp is the most commonly imported product, other countries such as India, Vietnam, Canada, and Greenland. The United States of America is also one the largest importer of shrimp in the world. The majority of imported frozen shrimp comes from India, Vietnam, and Indonesia.
India Shrimp Exports are facing competition from Ecuador, which is emerging as a major player in the Global Shrimp Market
By Exporting Countries, Worldwide Shrimp Market was classified into Ecuador, India, Vietnam, Indonesia, China, Thailand and Argentina. Ecuadorian shrimp is known for its high quality and is becoming increasingly popular in international markets, including the United States, China, and Europe. Ecuador's emphasis on sustainable production and implementation of technology to drive efficiency may potentially enable it to overtake other countries and emerge as the top player in the global shrimp market. It is anticipated that the future of farmed shrimp production could shift towards South and Central America.
India is benefiting from the increasing demand for disease-free and healthy shrimp, and has now become one of the largest shrimp exporters to both the US and the European Union. An expanding food industry is also being observed in India due to the rising demand for ready-to-eat food products, driven by forces such as rapid urbanization, changing lifestyles, hectic work schedules, and an increasing population of working women. Additionally, the rising worldwide demand for shrimp is positively affecting shrimp imports from India.
Litopenaeusvannamei (L. vannamei) is the most commonly sold Species of Shrimp Worldwide
The global shrimp market is segmented by species into L. vannamei, P. monodon, M.rosenbergii, and others. Litopenaeusvannamei, also known as the Pacific white shrimp, has emerged as the most popular species in the market, accounting for over 50% of the global shrimp industry's production. This is due to its adaptability to a wide range of environments, high growth rates, and ability to withstand extreme conditions. Ecuador, China, India, Indonesia, and Vietnam are the major producers of L. vannamei shrimp. It is anticipated that the market for M.rosenbergii and P. monodon shrimp will see further growth in the future, driven by heavy imports from major shrimp-consuming countries such as China and the USA.
Shrimp that fall in the 21-25 Size Range belong to the Medium-sized category, and are commonly used in a variety of Shrimp dishes due to their Popularity
By Size Category, Global Shrimp Market is sub-divided into <15, 15-20, 21-25, 26-30, 31-40, 41-50, 51-60, 61-70 and >70. The 21-25 size range of shrimp is a common size range for shrimp sold in the market. Shrimp that falls within the 21-25 size range is considered a popular medium size and is often sold as "jumbo" or "extra-large" both fresh and frozen. The top shrimp-producing countries in the world are China, Indonesia, India, Vietnam, and Thailand.
The shrimp industry also commonly sells the 26-30 size range of shrimp, which is another popular size range referred to as "large" or "extra-large" shrimp. These shrimp are commonly sold in both fresh and frozen forms, and their market demand and production are similar to those of the 21-25 size range. The largest shrimp-producing countries in the world, including China, Indonesia, India, Vietnam, and Thailand, also produce significant quantities of this size range.
Green/head-on Shrimp Industry is a significant sector of the Global Seafood Market, serving an important segment of Seafood Consumers
Global Shrimp Industry is divided by product form into Breaded, Cooked, Peeled, Green/Head-off, Green/Head-on, and Other Forms. Green or head-on shrimp refers to shrimp that has not been peeled, deveined, or had its head removed. These shrimp are usually sold fresh or frozen and are often considered a delicacy due to their rich flavor and texture. The green/head-on shrimp industry plays an important role in the global seafood market, catering to a significant segment of discerning consumers and high-end restaurants. The production of green/head-on shrimp is similar to that of other shrimp products, with major producing countries including China, India, Vietnam, Indonesia, and Ecuador.
Key Company
Some prominent players in the global shrimp market include Avanti Feeds Ltd, Liner Foods Inc, SuraponFoods, Thai Union Group, The Waterbase Ltd., Royal Greenland, Maruha Nichiro Corporation, Marine Harvest and Mowi ASA.
A US$ 93 million loan was granted by the Asian Development Bank (ADB) in December 2022 to support the implementation of sustainable and climate-resilient shrimp farming practices by small holder farmers across seven provinces in Indonesia. The primary goal of the project is to boost the productivity and income of these farmers while advocating sustainable aquaculture practices that minimize negative environmental impacts.
Renub Research report titled "Global Shrimp Market by Producing Countries (China, India, Vietnam, Indonesia, Thailand, Philippines, Bangladesh, Malaysia, Latin America and Others Countries), By Importing Countries (European Union, EU28, United States of America, China, Japan, South Korea, Canada, Vietnam), Exporting Countries(Ecuador, India, Vietnam, Indonesia, China, Thailand, Argentina), By Species (L. vannamei, P. monodon, M.rosenbergii, Others), Product Form (Breaded, Cooked, Peeled, Green/Head-off, Green/Head-on, and Other Forms), Size (<15, 15-20, 21-25, 26-30, 31-40, 41-50, 51-60, 61-70 and >70), Company (Avanti Feeds Ltd, Liner Foods Inc, Surapon Foods, Thai Union Group, The Waterbase Ltd., Royal Greenland, Maruha Nichiro Corporation, Marine Harvest and Mowi ASA.), Value Chain Analysis & Forecast" provides a complete analysis of global shrimp market.
Production - Shrimp Market & Volume breakup of top 10 Countries
1. China
2. India
3. Viet Nam
4. Indonesia
5. Thailand
6. Philippines
7. Bangladesh
8. Malasia
9. Latin America
10. Others Countries
Import - Shrimp Volume breakup of top 7 Countries
1. European Union (EU28)
2. United States of America
3. China
4. Japan
5. South Korea
6. Canada
7. Vietnam
Export - Shrimp Volume breakup of top 7 Countries
1. Ecuador
2. India
3. Vietnam
4. Indonesia
5. China
6. Thailand
7. Argentina
Species- Shrimp Volume breakup in 4 parts
1. L. vannamei
2. P. monodon
3. M.rosenbergii
4. Others
By Product Form - Shrimp Volume breakup of 6 Form
1. Breaded
2. Cooked
3. Peeled
4. Green/Head-off
5. Green/Head-on
6. Other Forms
All companies have been covered from 3 Viewpoints
- Overview
- Recent Development
- Revenue
Company Analysis
1. Avanti Feeds Ltd.
2. High Liner Foods Inc
3. Surapon Foods
4. Thai Union Group
5. The Waterbase Ltd.
6. Royal Greenland
7. Maruha Nichiro Corporation
8. Marine Harvest
9. Mowi ASA
Table of Contents
1. Introduction
2. Research & Methodology
3. Executive Summary
4. Market Dynamics
- 4.1 Growth Drivers
- 4.2 Challenges
5. SWOT Analysis
- 5.1 Strength
- 5.2 Weakness
- 5.3 Opportunity
- 5.4 Threat
6. Porter's Five Forces
- 6.1 Bargaining Power of Buyers
- 6.2 Bargaining Power of Suppliers
- 6.3 Degree of Competition
- 6.4 Threat of New Entrants
- 6.5 Threat of Substitutes
7. Global Shrimp Market
8. Global Shrimp Volume
9. Market Share - Global Shrimp Analysis
- 9.1 By Production
- 9.2 By Import
- 9.3 By Export
- 9.4 By Species
- 9.5 By Size Category
- 9.6 By Product Form
10. Production - Global Shrimp Market & Volume
- 10.1 China
- 10.1.1 Market
- 10.1.2 Volume
- 10.2 India
- 10.2.1 Market
- 10.2.2 Volume
- 10.3 Vietnam
- 10.3.1 Market
- 10.3.2 Volume
- 10.4 Indonesia
- 10.4.1 Market
- 10.4.2 Volume
- 10.5 Thailand
- 10.5.1 Market
- 10.5.2 Volume
- 10.6 Philippines
- 10.6.1 Market
- 10.6.2 Volume
- 10.7 Bangladesh
- 10.7.1 Market
- 10.7.2 Volume
- 10.8 Malaysia
- 10.8.1 Market
- 10.8.2 Volume
- 10.9 Latin America
- 10.9.1 Market
- 10.9.2 Volume
- 10.10 Others Countries
- 10.10.1 Market
- 10.10.2 Volume
11. Import - Global Shrimp Volume
- 11.1 European Union 28
- 11.2 United States
- 11.3 China
- 11.4 Japan
- 11.5 South Korea
- 11.6 Canada
- 11.7 Vietnam
12. Export - Global Shrimp Volume
- 12.1 Ecuador
- 12.2 India
- 12.3 Vietnam
- 12.4 Indonesia
- 12.5 China
- 12.6 Thailand
- 12.7 Argentina
13. Species - Global Shrimp Market
- 13.1 L. vannamei
- 13.2 P. monodon
- 13.3 M.rosenbergii
- 13.4 Others
14. Size Category - Global Shrimp Market
- 14.1 <15
- 14.2 15-20
- 14.3 21-25
- 14.4 26-30
- 14.5 31-40
- 14.6 41-50
- 14.7 51-60
- 14.8 61-70
- 14.9 >70
15. Product Form - Global Shrimp Market
- 15.1 Breaded
- 15.2 Cooked
- 15.3 Peeled
- 15.4 Green/Head-off
- 15.5 Green/Head-on
- 15.6 Other Forms
16. Company Analysis - Global Shrimp Market
- 16.1 Avanti Feeds Ltd.
- 16.1.1 Overview
- 16.1.2 Recent Development
- 16.1.3 Revenue
- 16.2 High Liner Foods Inc.
- 16.2.1 Overview
- 16.2.2 Recent Development
- 16.2.3 Revenue
- 16.3 Surapon Foods
- 16.3.1 Overview
- 16.3.2 Recent Development
- 16.3.3 Revenue
- 16.4 Thai Union Group
- 16.4.1 Overview
- 16.4.2 Recent Development
- 16.4.3 Revenue
- 16.5 The Waterbase Ltd.
- 16.5.1 Overview
- 16.5.2 Recent Development
- 16.5.3 Revenue
- 16.6 Royal Greenland
- 16.6.1 Overview
- 16.6.2 Recent Development
- 16.6.3 Revenue
- 16.7 Maruha Nichiro Corporation
- 16.7.1 Overview
- 16.7.2 Recent Development
- 16.7.3 Revenue
- 16.8 Marine Harvest
- 16.8.1 Overview
- 16.8.2 Recent Development
- 16.8.3 Revenue
- 16.9 Mowi ASA
- 16.9.1 Overview
- 16.9.2 Recent Development
- 16.9.3 Revenue