|
|
市場調査レポート
商品コード
1212723
ポータブル電源の世界市場:分析・実績・予測 (2017年~2028年)Global Portable Power Supply Market Report, History and Forecast 2017-2028 - Customized Version |
||||||
|
|
|||||||
|
● お客様のご希望に応じて、既存データの加工や未掲載情報(例:国別セグメント)の追加などの対応が可能です。 詳細はお問い合わせください。 |
|||||||


| ポータブル電源の世界市場:分析・実績・予測 (2017年~2028年) |
|
出版日: 2023年02月07日
発行: QYResearch
ページ情報: 英文 178 Pages
納期: 2~3営業日
|
- 全表示
- 概要
- 図表
- 目次
世界のポータブル電源の市場規模は、COVID-19のパンデミックとロシア・ウクライナ戦争の影響により、2022年に19億1,000万米ドル、2028年までに117億2,000万米ドルの修正規模に達する見通しです。
また、予測期間中 (2023年~2028年) に32.59%のCAGRで成長すると予測されています。
北米のポータブル電源の市場規模は、予測期間中 (2023年~2028年) に30.47%のCAGRで成長し、2022年には10億3,000万米ドル、2028年には57億6,000万米ドルに達すると予測されます。
アジア太平洋のポータブル電源の市場規模は、予測期間中 (2023年~2028年) に32.89%のCAGRで成長し、2022年には 6億7,628万米ドル、2028年には42億米ドルに達すると予測されます。
欧州のポータブル電源の市場規模は、予測期間中 (2023年~2028年) に42.76%のCAGRで成長し、2022年には 1億4,825万米ドル、2028年には14億4,000万米ドルに達すると予測されています。
当レポートでは、世界のポータブル電源の市場について分析し、種類別・用途別・地域別 (国別) の市場動向の見通し (2017年~2028年)、主要企業のプロファイルなどについて調査しております。
目次
第1章 ポータブル電源:市場概要
- ポータブル電源:製品概要
- 種類別の市場セグメント
- 出力電力1kW未満
- 出力電力1kW~2KW
- 出力電力2kW~3KW
- 出力電力3kW以上
- 種類別の市場規模
- 市場規模の概要:種類別 (2017年~2028年)
- 過去の市場規模:種類別 (2017年~2022年)
- 市場規模の予測:種類別 (2023年~2028年)
- 主要地域の市場規模:種類別
- 北米のポータブル電源の販売:種類別 (2017年~2028年)
- 欧州のポータブル電源の販売:種類別 (2017年~2028年)
- アジア太平洋のポータブル電源の販売:種類別 (2017年~2028年)
- ラテンアメリカのポータブル電源の販売:種類別 (2017年~2028年)
- 中東・アフリカのポータブル電源の販売:種類別 (2017年~2028年)
第2章 ポータブル電源:企業別の市場競争
- 世界のポータブル電源の主要企業の販売 (2019年~2022年)
- 世界のポータブル電源の主要企業の収益 (2019年~2022年)
- 世界のポータブル電源の主要企業の価格 (2019年~2022年)
- 世界のポータブル電源の主要メーカーの製造拠点・本社
- ポータブル電源市場の競争状況と動向
- 世界の主要メーカー:企業の種類別 (ティア1、ティア2、ティア3) (収益別、2022年)
- 主要メーカーの市場参入時期
- 主要メーカーの主力製品
- 企業合併・買収 (M&A)、拡大
第3章 ポータブル電源:地域別の現状と展望
- 世界のポータブル電源の市場規模・CAGR:地域別 (2017年・2022年・2028年)
- 過去の市場規模:地域別
- 市場規模の予測:地域別
第4章 ポータブル電源:用途別
- 用途別の市場セグメント
- 家電
- 電動工具
- 自動車
- その他
- 用途別の市場規模
- 市場規模の概要:用途別 (2017年~2028年)
- 過去の市場規模:用途別 (2017年~2022年)
- 市場規模の予測:用途別 (2023年~2028年)
- 主要地域の市場規模:用途別
- 北米のポータブル電源の販売:用途別 (2017年~2028年)
- 欧州のポータブル電源の販売:用途別 (2017年~2028年)
- アジア太平洋のポータブル電源の販売:用途別 (2017年~2028年)
- ラテンアメリカのポータブル電源の販売:用途別 (2017年~2028年)
- 中東・アフリカのポータブル電源の販売:用途別 (2017年~2028年)
第5章 北米のポータブル電源:国別
- 過去の市場規模:国別
- 市場規模の予測:国別
第6章 欧州のポータブル電源:国別
第7章 アジア太平洋のポータブル電源:地域別
第8章 ラテンアメリカのポータブル電源:国別
第9章 中東・アフリカのポータブル電源:国別
第10章 企業プロファイル:ポータブル電源事業の主要指標
- EcoFlow
- Shenzhen Hello Tech Energy
- GOAL ZERO
- PowerOak
- Westinghouse
- ANKER
- Dbk Electronics
- Allpowers
- JVC
- Pisen
- SBASE
- YOOBAO
- Letsolar
- Newsmy
- ORICO Technologies
- Flashfish
- Pecron
第11章 上流工程・機会・課題・リスク・影響要因の分析
- ポータブル電源の主要原材料
- 製造コストの構造
- ポータブル電源の産業チェーンの分析
- ポータブル電源の市場力学
第12章 マーケティング戦略分析、流通業者
- 販売チャンネル
- 世界のポータブル電源の市場規模:販売チャネル別
- 北米のポータブル電源の販売量:販売チャネル別
- 欧州のポータブル電源の販売量:販売チャネル別
- アジア太平洋のポータブル電源の販売量:販売チャネル別
- ラテンアメリカのポータブル電源の販売量:販売チャネル別
- 中東・アフリカのポータブル電源の販売量:販売チャネル別
- ポータブル電源の流通業者
- ポータブル電源のオンライン販売プラットフォーム
- ポータブル電源の下流工程での用途
- アウトドアキャンプ
- 医療用電源
- 自然災害
- ポータブル電源の下流工程の顧客
第13章 調査結果と結論
第14章 付録
List of Tables
- Table 1. Major Company of Output Power less than 1kW
- Table 2. Major Company of 1KW-2KW
- Table 3. Major Company of 2KW-3KW
- Table 4. Major Company of Output Power<3kW
- Table 5. Global Portable Power Supply Sales by Type: 2017 VS 2022 VS 2028 (US$ Million)
- Table 6. Global Portable Power Supply Sales by Type (2017-2022) & (K Units)
- Table 7. Global Portable Power Supply Sales Market Share in Volume by Type (2017-2022)
- Table 8. Global Portable Power Supply Sales by Type (2017-2022) & (US$ Million)
- Table 9. Global Portable Power Supply Sales Market Share in Value by Type (2017-2022)
- Table 10. Global Portable Power Supply Price by Type (2017-2022) & (US$/Unit)
- Table 11. Global Portable Power Supply Sales by Type (2023-2028) & (K Units)
- Table 12. Global Portable Power Supply Sales Market Share in Volume by Type (2023-2028)
- Table 13. Global Portable Power Supply Sales by Type (2023-2028) & (US$ Million)
- Table 14. Global Portable Power Supply Sales Market Share in Value by Type (2023-2028)
- Table 15. Global Portable Power Supply Price by Type (2023-2028) & (US$/Unit)
- Table 16. North America Portable Power Supply Sales by Type (2017-2022) & (K Units)
- Table 17. North America Portable Power Supply Sales Market Share in Volume by Type (2017-2022)
- Table 18. North America Portable Power Supply Sales by Type (2023-2028) & (K Units)
- Table 19. North America Portable Power Supply Sales Market Share in Volume by Type (2023-2028)
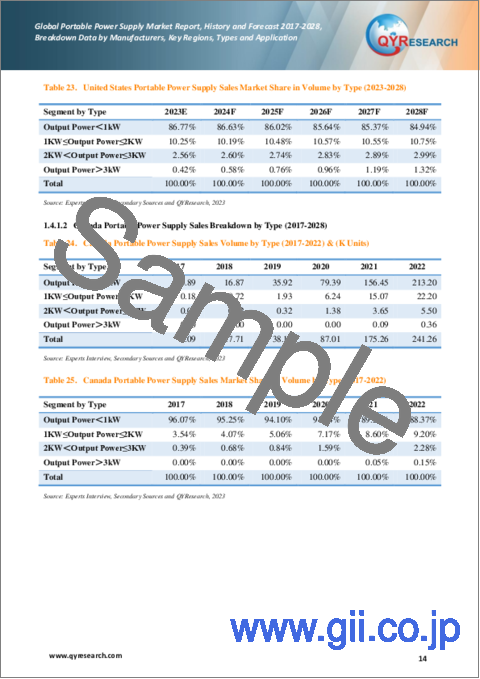
- Table 20. United States Portable Power Supply Sales Volume by Type (2017-2022) & (K Units)
- Table 21. United States Portable Power Supply Sales Market Share in Volume by Type (2017-2022)
- Table 22. United States Portable Power Supply Sales Volume by Type (2023-2028) & (K Units)
- Table 23. United States Portable Power Supply Sales Market Share in Volume by Type (2023-2028)
- Table 24. Canada Portable Power Supply Sales Volume by Type (2017-2022) & (K Units)
- Table 25. Canada Portable Power Supply Sales Market Share in Volume by Type (2017-2022)
- Table 26. Canada Portable Power Supply Sales Volume by Type (2023-2028) & (K Units)
- Table 27. Canada Portable Power Supply Sales Market Share in Volume by Type (2023-2028)
- Table 28. Europe Portable Power Supply Sales by Type (2017-2022) & (K Units)
- Table 29. Europe Portable Power Supply Sales Market Share in Volume by Type (2017-2022)
- Table 30. Europe Portable Power Supply Sales by Type (2023-2028) & (K Units)
- Table 31. Europe Portable Power Supply Sales Market Share in Volume by Type (2023-2028)
- Table 32. Germany Portable Power Supply Sales Volume by Type (2017-2022) & (K Units)
- Table 33. Germany Portable Power Supply Sales Market Share in Volume by Type (2017-2022)
- Table 34. Germany Portable Power Supply Sales Volume by Type (2023-2028) & (K Units)
- Table 35. Germany Portable Power Supply Sales Market Share in Volume by Type (2023-2028)
- Table 36. France Portable Power Supply Sales Volume by Type (2017-2022) & (K Units)
- Table 37. France Portable Power Supply Sales Market Share in Volume by Type (2017-2022)
- Table 38. France Portable Power Supply Sales Volume by Type (2023-2028) & (K Units)
- Table 39. France Portable Power Supply Sales Market Share in Volume by Type (2023-2028)
- Table 40. U.K. Portable Power Supply Sales Volume by Type (2017-2022) & (K Units)
- Table 41. U.K. Portable Power Supply Sales Market Share in Volume by Type (2017-2022)
- Table 42. U.K. Portable Power Supply Sales Volume by Type (2023-2028) & (K Units)
- Table 43. U.K. Portable Power Supply Sales Market Share in Volume by Type (2023-2028)
- Table 44. Italy Portable Power Supply Sales Volume by Type (2017-2022) & (K Units)
- Table 45. Italy Portable Power Supply Sales Market Share in Volume by Type (2017-2022)
- Table 46. Italy Portable Power Supply Sales Volume by Type (2023-2028) & (K Units)
- Table 47. Italy Portable Power Supply Sales Market Share in Volume by Type (2023-2028)
- Table 48. Asia-Pacific Portable Power Supply Sales by Type (2017-2022) & (K Units)
- Table 49. Asia-Pacific Portable Power Supply Sales Market Share in Volume by Type (2017-2022)
- Table 50. Asia-Pacific Portable Power Supply Sales by Type (2023-2028) & (K Units)
- Table 51. Asia-Pacific Portable Power Supply Sales Market Share in Volume by Type (2023-2028)
- Table 52. Japan Portable Power Supply Sales Volume by Type (2017-2022) & (K Units)
- Table 53. Japan Portable Power Supply Sales Market Share in Volume by Type (2017-2022)
- Table 54. Japan Portable Power Supply Sales Volume by Type (2023-2028) & (K Units)
- Table 55. Japan Portable Power Supply Sales Market Share in Volume by Type (2023-2028)
- Table 56. China Portable Power Supply Sales Volume by Type (2017-2022) & (K Units)
- Table 57. China Portable Power Supply Sales Market Share in Volume by Type (2017-2022)
- Table 58. China Portable Power Supply Sales Volume by Type (2023-2028) & (K Units)
- Table 59. China Portable Power Supply Sales Market Share in Volume by Type (2023-2028)
- Table 60. India Portable Power Supply Sales Volume by Type (2017-2022) & (K Units)
- Table 61. India Portable Power Supply Sales Market Share in Volume by Type (2017-2022)
- Table 62. India Portable Power Supply Sales Volume by Type (2023-2028) & (K Units)
- Table 63. India Portable Power Supply Sales Market Share in Volume by Type (2023-2028)
- Table 64. Southeast Asia Portable Power Supply Sales Volume by Type (2017-2022) & (K Units)
- Table 65. Southeast Asia Portable Power Supply Sales Market Share in Volume by Type (2017-2022)
- Table 66. Southeast Asia Portable Power Supply Sales Volume by Type (2023-2028) & (K Units)
- Table 67. Southeast Asia Portable Power Supply Sales Market Share in Volume by Type (2023-2028)
- Table 68. Indonesia Portable Power Supply Sales Volume by Type (2017-2022) & (K Units)
- Table 69. Indonesia Portable Power Supply Sales Market Share in Volume by Type (2017-2022)
- Table 70. Indonesia Portable Power Supply Sales Volume by Type (2023-2028) & (K Units)
- Table 71. Indonesia Portable Power Supply Sales Market Share in Volume by Type (2023-2028)
- Table 72. Thailand Portable Power Supply Sales Volume by Type (2017-2022) & (K Units)
- Table 73. Thailand Portable Power Supply Sales Market Share in Volume by Type (2017-2022)
- Table 74. Thailand Portable Power Supply Sales Volume by Type (2023-2028) & (K Units)
- Table 75. Thailand Portable Power Supply Sales Market Share in Volume by Type (2023-2028)
- Table 76. Malaysia Portable Power Supply Sales Volume by Type (2017-2022) & (K Units)
- Table 77. Malaysia Portable Power Supply Sales Market Share in Volume by Type (2017-2022)
- Table 78. Malaysia Portable Power Supply Sales Volume by Type (2023-2028) & (K Units)
- Table 79. Malaysia Portable Power Supply Sales Market Share in Volume by Type (2023-2028)
- Table 80. Australia Portable Power Supply Sales Volume by Type (2017-2022) & (K Units)
- Table 81. Australia Portable Power Supply Sales Market Share in Volume by Type (2017-2022)
- Table 82. Australia Portable Power Supply Sales Volume by Type (2023-2028) & (K Units)
- Table 83. Australia Portable Power Supply Sales Market Share in Volume by Type (2023-2028)
- Table 84. Latin America Portable Power Supply Sales by Type (2017-2022) & (K Units)
- Table 85. Latin America Portable Power Supply Sales Market Share in Volume by Type (2017-2022)
- Table 86. Latin America Portable Power Supply Sales by Type (2023-2028) & (K Units)
- Table 87. Latin America Portable Power Supply Sales Market Share in Volume by Type (2023-2028)
- Table 88. Middle East and Africa Portable Power Supply Sales by Type (2017-2022) & (K Units)
- Table 89. Middle East and Africa Portable Power Supply Sales Market Share in Volume by Type (2017-2022)
- Table 90. Middle East and Africa Portable Power Supply Sales by Type (2023-2028) & (K Units)
- Table 91. Middle East and Africa Portable Power Supply Sales Market Share in Volume by Type (2023-2028)
- Table 92. Global Portable Power Supply Sales by Company (2019-2022) & (K Units)
- Table 93. Global Portable Power Supply Sales Share by Company (2019-2022)
- Table 94. Global Portable Power Supply Revenue by Company (2019-2022) & (US$ Million)
- Table 95. Global Portable Power Supply Revenue Share by Company (2019-2022)
- Table 96. Global Market Portable Power Supply Price by Company (2019-2022) & (US$/Unit)
- Table 97. Global Portable Power Supply Top Manufacturers Manufacturing Base Distribution and Headquarters
- Table 98. Global Portable Power Supply Manufacturers Market Concentration Ratio (CR5 and HHI)
- Table 99. Global Top Manufacturers Market Share by Company Type (Tier 1, Tier 2, and Tier 3) & (based on the Revenue in Portable Power Supply as of 2021)
- Table 100. Date of Key Manufacturers Enter into Portable Power Supply Market
- Table 101. Key Manufacturers Portable Power Supply Product Type
- Table 102. Mergers & Acquisitions, Expansion Plans
- Table 103. Global Portable Power Supply Market Size Comparison by Region (US$ Million): 2017 VS 2022 VS 2028
- Table 104. Global Portable Power Supply Sales by Region (2017-2022) & (K Units)
- Table 105. Global Portable Power Supply Sales Market Share in Volume by Region (2017-2022)
- Table 106. Global Portable Power Supply Sales by Region (2017-2022) & (US$ Million)
- Table 107. Global Portable Power Supply Sales Market Share in Value by Region (2017-2022)
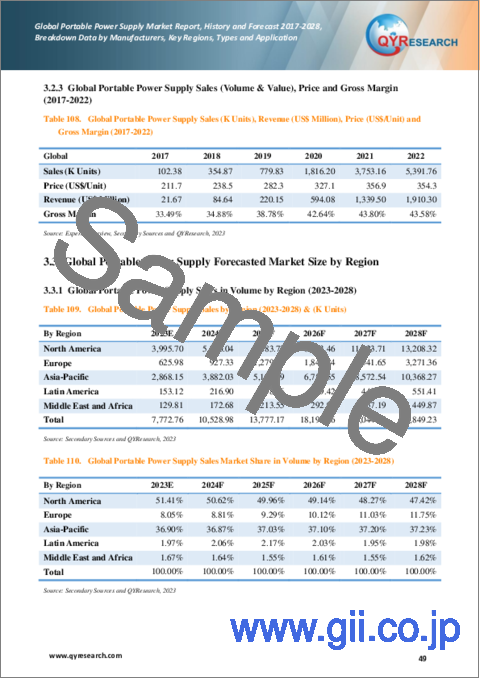
- Table 108. Global Portable Power Supply Sales (K Units), Revenue (US$ Million), Price (US$/Unit) and Gross Margin (2017-2022)
- Table 109. Global Portable Power Supply Sales by Region (2023-2028) & (K Units)
- Table 110. Global Portable Power Supply Sales Market Share in Volume by Region (2023-2028)
- Table 111. Global Portable Power Supply Sales by Region (2023-2028) & (US$ Million)
- Table 112. Global Portable Power Supply Sales Market Share in Value by Region (2023-2028)
- Table 113. Global Portable Power Supply Sales (K Units), Value (US$ Million), Price (US$/Unit) and Gross Margin (2023-2028)
- Table 114. Global Portable Power Supply Sales by Application: 2017 VS 2022 VS 2028 (US$ Million)
- Table 115. Global Portable Power Supply Sales in Volume by Application (2017-2022) & (K Units)
- Table 116. Global Portable Power Supply Sales Market Share in Volume by Application (2017-2022)
- Table 117. Global Portable Power Supply Sales in Value by Application (2017-2022) & (US$ Million)
- Table 118. Global Portable Power Supply Sales Market Share in Value by Application (2017-2022)
- Table 119. Global Portable Power Supply Price by Application (2017-2022) & (US$/Unit)
- Table 120. Global Portable Power Supply Sales in Volume by Application (2023-2028) & (K Units)
- Table 121. Global Portable Power Supply Sales Market Share in Volume by Application (2023-2028)
- Table 122. Global Portable Power Supply Sales in Value by Application (2023-2028) & (US$ Million)
- Table 123. Global Portable Power Supply Sales Market Share in Value by Application (2023-2028)
- Table 124. Global Portable Power Supply Price by Application (2023-2028) & (US$/Unit)
- Table 125. North America Portable Power Supply Sales in Volume by Application (2017-2022) & (K Units)
- Table 126. North America Portable Power Supply Sales Market Share in Volume by Application (2017-2022)
- Table 127. North America Portable Power Supply Sales in Volume by Application (2023-2028) & (K Units)
- Table 128. North America Portable Power Supply Sales Market Share in Volume by Application (2023-2028)
- Table 129. United States Portable Power Supply Sales in Volume by Application (2017-2022) & (K Units)
- Table 130. United States Portable Power Supply Sales Market Share in Volume by Application (2017-2022)
- Table 131. United States Portable Power Supply Sales in Volume by Application (2023-2028) & (K Units)
- Table 132. United States Portable Power Supply Sales Market Share in Volume by Application (2023-2028)
- Table 133. Canada Portable Power Supply Sales in Volume by Application (2017-2022) & (K Units)
- Table 134. Canada Portable Power Supply Sales Market Share in Volume by Application (2017-2022)
- Table 135. Canada Portable Power Supply Sales in Volume by Application (2023-2028) & (K Units)
- Table 136. Canada Portable Power Supply Sales Market Share in Volume by Application (2023-2028)
- Table 137. Europe Portable Power Supply Sales in Volume by Application (2017-2022) & (K Units)
- Table 138. Europe Portable Power Supply Sales Market Share in Volume by Application (2017-2022)
- Table 139. Europe Portable Power Supply Sales in Volume by Application (2023-2028) & (K Units)
- Table 140. Europe Portable Power Supply Sales Market Share in Volume by Application (2023-2028)
- Table 141. Germany Portable Power Supply Sales in Volume by Application (2017-2022) & (K Units)
- Table 142. Germany Portable Power Supply Sales Market Share in Volume by Application (2017-2022)
- Table 143. Germany Portable Power Supply Sales in Volume by Application (2023-2028) & (K Units)
- Table 144. Germany Portable Power Supply Sales Market Share in Volume by Application (2023-2028)
- Table 145. France Portable Power Supply Sales in Volume by Application (2017-2022) & (K Units)
- Table 146. France Portable Power Supply Sales Market Share in Volume by Application (2017-2022)
- Table 147. France Portable Power Supply Sales in Volume by Application (2023-2028) & (K Units)
- Table 148. France Portable Power Supply Sales Market Share in Volume by Application (2023-2028)
- Table 149. U.K. Portable Power Supply Sales in Volume by Application (2017-2022) & (K Units)
- Table 150. U.K. Portable Power Supply Sales Market Share in Volume by Application (2017-2022)
- Table 151. U.K. Portable Power Supply Sales in Volume by Application (2023-2028) & (K Units)
- Table 152. U.K. Portable Power Supply Sales Market Share in Volume by Application (2023-2028)
- Table 153. Italy Portable Power Supply Sales in Volume by Application (2017-2022) & (K Units)
- Table 154. Italy Portable Power Supply Sales Market Share in Volume by Application (2017-2022)
- Table 155. Italy Portable Power Supply Sales in Volume by Application (2023-2028) & (K Units)
- Table 156. Italy Portable Power Supply Sales Market Share in Volume by Application (2023-2028)
- Table 157. Asia-Pacific Portable Power Supply Sales in Volume by Application (2017-2022) & (K Units)
- Table 158. Asia-Pacific Portable Power Supply Sales Market Share in Volume by Application (2017-2022)
- Table 159. Asia-Pacific Portable Power Supply Sales in Volume by Application (2023-2028) & (K Units)
- Table 160. Asia-Pacific Portable Power Supply Sales Market Share in Volume by Application (2023-2028)
- Table 161. Japan Portable Power Supply Sales in Volume by Application (2017-2022) & (K Units)
- Table 162. Japan Portable Power Supply Sales Market Share in Volume by Application (2017-2022)
- Table 163. Japan Portable Power Supply Sales in Volume by Application (2023-2028) & (K Units)
- Table 164. Japan Portable Power Supply Sales Market Share in Volume by Application (2023-2028)
- Table 165. China Portable Power Supply Sales in Volume by Application (2017-2022) & (K Units)
- Table 166. China Portable Power Supply Sales Market Share in Volume by Application (2017-2022)
- Table 167. China Portable Power Supply Sales in Volume by Application (2023-2028) & (K Units)
- Table 168. China Portable Power Supply Sales Market Share in Volume by Application (2023-2028)
- Table 169. India Portable Power Supply Sales in Volume by Application (2017-2022) & (K Units)
- Table 170. India Portable Power Supply Sales Market Share in Volume by Application (2017-2022)
- Table 171. India Portable Power Supply Sales in Volume by Application (2023-2028) & (K Units)
- Table 172. India Portable Power Supply Sales Market Share in Volume by Application (2023-2028)
- Table 173. Southeast Asia Portable Power Supply Sales in Volume by Application (2017-2022) & (K Units)
- Table 174. Southeast Asia Portable Power Supply Sales Market Share in Volume by Application (2017-2022)
- Table 175. Southeast Asia Portable Power Supply Sales in Volume by Application (2023-2028) & (K Units)
- Table 176. Southeast Asia Portable Power Supply Sales Market Share in Volume by Application (2023-2028)
- Table 177. Indonesia Portable Power Supply Sales in Volume by Application (2017-2022) & (K Units)
- Table 178. Indonesia Portable Power Supply Sales Market Share in Volume by Application (2017-2022)
- Table 179. Indonesia Portable Power Supply Sales in Volume by Application (2023-2028) & (K Units)
- Table 180. Indonesia Portable Power Supply Sales Market Share in Volume by Application (2023-2028)
- Table 181. Thailand Portable Power Supply Sales in Volume by Application (2017-2022) & (K Units)
- Table 182. Thailand Portable Power Supply Sales Market Share in Volume by Application (2017-2022)
- Table 183. Thailand Portable Power Supply Sales in Volume by Application (2023-2028) & (K Units)
- Table 184. Thailand Portable Power Supply Sales Market Share in Volume by Application (2023-2028)
- Table 185. Malaysia Portable Power Supply Sales in Volume by Application (2017-2022) & (K Units)
- Table 186. Malaysia Portable Power Supply Sales Market Share in Volume by Application (2017-2022)
- Table 187. Malaysia Portable Power Supply Sales in Volume by Application (2023-2028) & (K Units)
- Table 188. Malaysia Portable Power Supply Sales Market Share in Volume by Application (2023-2028)
- Table 189. Australia Portable Power Supply Sales in Volume by Application (2017-2022) & (K Units)
- Table 190. Australia Portable Power Supply Sales Market Share in Volume by Application (2017-2022)
- Table 191. Australia Portable Power Supply Sales in Volume by Application (2023-2028) & (K Units)
- Table 192. Australia Portable Power Supply Sales Market Share in Volume by Application (2023-2028)
- Table 193. Latin America Portable Power Supply Sales in Volume by Application (2017-2022) & (K Units)
- Table 194. Latin America Portable Power Supply Sales Market Share in Volume by Application (2017-2022)
- Table 195. Latin America Portable Power Supply Sales in Volume by Application (2023-2028) & (K Units)
- Table 196. Latin America Portable Power Supply Sales Market Share in Volume by Application (2023-2028)
- Table 197. Middle East and Africa Portable Power Supply Sales in Volume by Application (2017-2022) & (K Units)
- Table 198. Middle East and Africa Portable Power Supply Sales Market Share in Volume by Application (2017-2022)
- Table 199. Middle East and Africa Portable Power Supply Sales in Volume by Application (2023-2028) & (K Units)
- Table 200. Middle East and Africa Portable Power Supply Sales Market Share in Volume by Application (2023-2028)
- Table 201. North America Portable Power Supply Sales in Volume by Country (2017-2022) & (K Units)
- Table 202. North America Portable Power Supply Sales Market Share in Volume by Country (2017-2022)
- Table 203. North America Portable Power Supply Sales in Value by Country (2017-2022) & (US$ Million)
- Table 204. North America Portable Power Supply Sales Market Share in Value by Country (2017-2022)
- Table 205. North America Portable Power Supply Sales in Volume by Country (2023-2028) & (K Units)
- Table 206. North America Portable Power Supply Sales Market Share in Volume by Country (2023-2028)
- Table 207. North America Portable Power Supply Sales in Value by Country (2023-2028) & (US$ Million)
- Table 208. North America Portable Power Supply Sales Market Share in Value by Country (2023-2028)
- Table 209. North America Portable Power Supply Market Analysis by Country (2023-2028)
- Table 210. Europe Portable Power Supply Sales in Volume by Country (2017-2022) & (K Units)
- Table 211. Europe Portable Power Supply Sales Market Share in Volume by Country (2017-2022)
- Table 212. Europe Portable Power Supply Sales in Value by Country (2017-2022) & (US$ Million)
- Table 213. Europe Portable Power Supply Sales Market Share in Value by Country (2017-2022)
- Table 214. Europe Portable Power Supply Sales in Volume by Country (2023-2028) & (K Units)
- Table 215. Europe Portable Power Supply Sales Market Share in Volume by Country (2023-2028)
- Table 216. Europe Portable Power Supply Sales in Value by Country (2023-2028) & (US$ Million)
- Table 217. Europe Portable Power Supply Sales Market Share in Value by Country (2023-2028)
- Table 218. Europe Portable Power Supply Market Analysis by Country (2023-2028)
- Table 219. Asia-Pacific Portable Power Supply Sales in Volume by Region (2017-2022) & (K Units)
- Table 220. Asia-Pacific Portable Power Supply Sales Market Share in Volume by Region (2017-2022)
- Table 221. Asia-Pacific Portable Power Supply Sales in Value by Region (2017-2022) & (US$ Million)
- Table 222. Asia-Pacific Portable Power Supply Sales Market Share in Value by Region (2017-2022)
- Table 223. Asia-Pacific Portable Power Supply Sales in Volume by Region (2023-2028) & (K Units)
- Table 224. Asia-Pacific Portable Power Supply Sales Market Share in Volume by Region (2023-2028)
- Table 225. Asia-Pacific Portable Power Supply Sales in Value by Region (2023-2028) & (US$ Million)
- Table 226. Asia-Pacific Portable Power Supply Sales Market Share in Value by Region (2023-2028)
- Table 227. Asia-Pacific Portable Power Supply Market Analysis by Country (2023-2028)
- Table 228. Latin America Portable Power Supply Sales in Volume by Country (2017-2022) & (K Units)
- Table 229. Latin America Portable Power Supply Sales Market Share in Volume by Country (2017-2022)
- Table 230. Latin America Portable Power Supply Sales in Value by Country (2017-2022) & (US$ Million)
- Table 231. Latin America Portable Power Supply Sales Market Share in Value by Country (2017-2022)
- Table 232. Latin America Portable Power Supply Sales in Volume by Country (2023-2028) & (K Units)
- Table 233. Latin America Portable Power Supply Sales Market Share in Volume by Country (2023-2028)
- Table 234. Latin America Portable Power Supply Sales in Value by Country (2023-2028) & (US$ Million)
- Table 235. Latin America Portable Power Supply Sales Market Share in Value by Country (2023-2028)
- Table 236. Middle East and Africa Portable Power Supply Sales in Volume by Country (2017-2022) & (K Units)
- Table 237. Middle East and Africa Portable Power Supply Sales Market Share in Volume by Country (2017-2022)
- Table 238. Middle East and Africa Portable Power Supply Sales in Value by Country (2017-2022) & (US$ Million)
- Table 239. Middle East and Africa Portable Power Supply Sales Market Share in Value by Country (2017-2022)
- Table 240. Middle East and Africa Portable Power Supply Sales in Volume by Country (2023-2028) & (K Units)
- Table 241. Middle East and Africa Portable Power Supply Sales Market Share by Country (2023-2028)
- Table 242. Middle East and Africa Portable Power Supply Sales in Value by Country (2023-2028) & (US$ Million)
- Table 243. Middle East and Africa Portable Power Supply Sales Market Share in Value by Country (2023-2028)
- Table 244. EcoFlow Corporation Information
- Table 245. EcoFlow Introduction and Business Overview
- Table 246. EcoFlow Portable Power Supply Sales (K Units), Revenue (US$ Million), Price (US$/Unit) and Gross Margin (2019-2022)
- Table 247. EcoFlow Portable Power Supply Product
- Table 248. Shenzhen Hello Tech Energy Corporation Information
- Table 249. Shenzhen Hello Tech Energy Introduction and Business Overview
- Table 250. Shenzhen Hello Tech Energy Portable Power Supply Sales (K Units), Revenue (US$ Million), Price (US$/Unit) and Gross Margin (2019-2022)
- Table 251. Shenzhen Hello Tech Energy Portable Power Supply Product
- Table 252. GOAL ZERO Corporation Information
- Table 253. GOAL ZERO Introduction and Business Overview
- Table 254. GOAL ZERO Portable Power Supply Sales (K Units), Revenue (US$ Million), Price (US$/Unit) and Gross Margin (2019-2022)
- Table 255. GOAL ZERO Portable Power Supply Product
- Table 256. PowerOak Corporation Information
- Table 257. PowerOak Introduction and Business Overview
- Table 258. PowerOak Portable Power Supply Sales (K Units), Revenue (US$ Million), Price (US$/Unit) and Gross Margin (2019-2022)
- Table 259. PowerOak Portable Power Supply Product
- Table 260. Westinghouse Corporation Information
- Table 261. Westinghouse Introduction and Business Overview
- Table 262. Westinghouse Portable Power Supply Sales (K Units), Revenue (US$ Million), Price (US$/Unit) and Gross Margin (2019-2022)
- Table 263. Westinghouse Portable Power Supply Product
- Table 264. ANKER Corporation Information
- Table 265. ANKER Introduction and Business Overview
- Table 266. ANKER Portable Power Supply Sales (K Units), Revenue (US$ Million), Price (US$/Unit) and Gross Margin (2019-2022)
- Table 267. ANKER Portable Power Supply Product
- Table 268. Dbk Electronics Corporation Information
- Table 269. Dbk Electronics Introduction and Business Overview
- Table 270. Dbk Electronics Portable Power Supply Sales (K Units), Revenue (US$ Million), Price (US$/Unit) and Gross Margin (2019-2022)
- Table 271. Dbk Electronics Portable Power Supply Product
- Table 272. Allpowers Corporation Information
- Table 273. Allpowers Introduction and Business Overview
- Table 274. Allpowers Portable Power Supply Sales (K Units), Revenue (US$ Million), Price (US$/Unit) and Gross Margin (2019-2022)
- Table 275. Allpowers Portable Power Supply Product
- Table 276. JVC Corporation Information
- Table 277. JVC Introduction and Business Overview
- Table 278. JVC Portable Power Supply Sales (K Units), Revenue (US$ Million), Price (US$/Unit) and Gross Margin (2019-2022)
- Table 279. JVC Portable Power Supply Product
- Table 280. Pisen Corporation Information
- Table 281. Pisen Introduction and Business Overview
- Table 282. Pisen Portable Power Supply Sales (K Units), Revenue (US$ Million), Price (US$/Unit) and Gross Margin (2019-2022)
- Table 283. Pisen Portable Power Supply Product
- Table 284. SBASE Corporation Information
- Table 285. SBASE Introduction and Business Overview
- Table 286. SBASE Portable Power Supply Sales (K Units), Revenue (US$ Million), Price (US$/Unit) and Gross Margin (2019-2022)
- Table 287. SBASE Portable Power Supply Product
- Table 288. YOOBAO Corporation Information
- Table 289. YOOBAO Introduction and Business Overview
- Table 290. YOOBAO Portable Power Supply Sales (K Units), Revenue (US$ Million), Price (US$/Unit) and Gross Margin (2019-2022)
- Table 291. YOOBAO Portable Power Supply Product
- Table 292. Letsolar Corporation Information
- Table 293. Letsolar Introduction and Business Overview
- Table 294. Letsolar Portable Power Supply Sales (K Units), Revenue (US$ Million), Price (US$/Unit) and Gross Margin (2019-2022)
- Table 295. Letsolar Portable Power Supply Product
- Table 296. Newsmy Corporation Information
- Table 297. Newsmy Introduction and Business Overview
- Table 298. Newsmy Portable Power Supply Sales (K Units), Revenue (US$ Million), Price (US$/Unit) and Gross Margin (2019-2022)
- Table 299. Newsmy Portable Power Supply Product
- Table 300. ORICO Technologies Corporation Information
- Table 301. ORICO Technologies Introduction and Business Overview
- Table 302. ORICO Technologies Portable Power Supply Sales (K Units), Revenue (US$ Million), Price (US$/Unit) and Gross Margin (2019-2022)
- Table 303. ORICO Technologies Portable Power Supply Product
- Table 304. Flashfish Corporation Information
- Table 305. Flashfish Introduction and Business Overview
- Table 306. Flashfish Portable Power Supply Sales (K Units), Revenue (US$ Million), Price (US$/Unit) and Gross Margin (2019-2022)
- Table 307. Flashfish Portable Power Supply Product
- Table 308. Pecron Corporation Information
- Table 309. Pecron Introduction and Business Overview
- Table 310. Pecron Portable Power Supply Sales (K Units), Revenue (US$ Million), Price (US$/Unit) and Gross Margin (2019-2022)
- Table 311. Pecron Portable Power Supply Product
- Table 312. Key Raw Materials Lists
- Table 313. Raw Materials Key Suppliers Lists
- Table 314. Portable Power Supply Market Trends
- Table 315. Portable Power Supply Market Drivers
- Table 316. Portable Power Supply Market Challenges
- Table 317. Portable Power Supply Market Restraints
- Table 318. Global Portable Power Supply Sales in Volume by Sales Channel (2017-2022) & (K Units)
- Table 319. Global Portable Power Supply Sales in Volume by Sales Channel (2023-2028) & (K Units)
- Table 320. Global Portable Power Supply Sales in Value by Sales Channel (2017-2022) & (US$ Million)
- Table 321. Global Portable Power Supply Sales in Value by Sales Channel (2023-2028)
- Table 322. North America Portable Power Supply Sales in Volume by Sales Channel (2017-2022) & (K Units)
- Table 323. North America Portable Power Supply Sales in Volume by Sales Channel (2023-2028) & (K Units)
- Table 324. Europe Portable Power Supply Sales in Volume by Sales Channel (2017-2022) & (K Units)
- Table 325. Europe Portable Power Supply Sales in Volume by Sales Channel (2023-2028) & (K Units)
- Table 326. Asia-Pacific Portable Power Supply Sales in Volume by Sales Channel (2017-2022) & (K Units)
- Table 327. Asia-Pacific Portable Power Supply Sales in Volume by Sales Channel (2023-2028) & (K Units)
- Table 328. Latin America Portable Power Supply Sales in Volume by Sales Channel (2017-2022) & (K Units)
- Table 329. Latin America Portable Power Supply Sales in Volume by Sales Channel (2023-2028) & (K Units)
- Table 330. Middle East and Africa Portable Power Supply Sales in Volume by Sales Channel (2017-2022) & (K Units)
- Table 331. Middle East and Africa Portable Power Supply Sales in Volume by Sales Channel (2023-2028) & (K Units)
- Table 332. Portable Power Supply Offline Distributors List
- Table 333. Portable Power Supply Online Sales Platform
- Table 334. Portable Power Supply Downstream Customers
- Table 335. Research Programs/Design for This Report
- Table 336. Key Data Information from Secondary Sources
- Table 337. Key Data Information from Primary Sources
List of Figures
- Figure 1. Portable Power Supply Product Picture
- Figure 2. Global Portable Power Supply Market Size, 2017 VS 2022 VS 2028 (US$ Million)
- Figure 3. Global Portable Power Supply Market Size Status and Outlook (2017-2028) & (US$ Million)
- Figure 4. Global Portable Power Supply Sales Status and Outlook (2017-2028) & (K Units)
- Figure 5. Global Output Power<1kW Sales YoY Growth (2017-2028) & (K Units)
- Figure 6. Global 1KW≤utput Power≤2KW Sales YoY Growth (2017-2028) & (K Units)
- Figure 7. Global 2KWFigure 8. Global Output Power<3kW Sales YoY Growth (2017-2028) & (K Units)
- Figure 9. Global Portable Power Supply Market Share by Type in 2022 & 2028
- Figure 10. The 3 and 5 Largest Manufacturers in the World: Market Share by Portable Power Supply Revenue in 2022
- Figure 11. Portable Power Supply Market Share by Company Type (Tier 1, Tier 2, and Tier 3): 2021 VS 2022
- Figure 12. Global Home Appliances Sales YoY Growth (2017-2028) & (K Units)
- Figure 13. Global Electric Tools Sales YoY Growth (2017-2028) & (K Units)
- Figure 14. Global Automobile Sales YoY Growth (2017-2028) & (K Units)
- Figure 15. Global Others Sales YoY Growth (2017-2028) & (K Units)
- Figure 16. Global Portable Power Supply Market Share by Application in 2022 & 2028
- Figure 17. Global Portable Power Supply Manufacturing Cost Structure in 2022
- Figure 18. Portable Power Supply Industrial Chain Analysis
- Figure 19. Channels of Distribution
- Figure 20. Bottom-up and Top-down Approaches for This Report
- Figure 21. Data Triangulation
- Figure 22. Key Executives Interviewed
Due to the COVID-19 pandemic and Russia-Ukraine War Influence, the global market for Portable Power Supply estimated at US$ 1.91 billion in the year 2022, is projected to reach a revised size of US$ 11.72 billion by 2028, growing at a CAGR of 32.59% during the forecast period 2023-2028.
North American market for Portable Power Supply is estimated to increase from $ 1.03 billion in 2022 to reach $ 5.76 billion by 2028, at a CAGR of 30.47% during the forecast period of 2023 through 2028.
Asia-Pacific market for Portable Power Supply is estimated to increase from $ 676.28 million in 2022 to reach $ 4.20 billion by 2028, at a CAGR of 32.89% during the forecast period of 2023 through 2028.
Europe market for Portable Power Supply is estimated to increase from $ 148.25 million in 2022 to reach $ 1.44 billion by 2028, at a CAGR of 42.76% during the forecast period of 2023 through 2028.
Report Scope
This report aims to provide a comprehensive presentation of the global market for Portable Power Supply, with both quantitative and qualitative analysis, to help readers develop business/growth strategies, assess the market competitive situation, analyze their position in the current marketplace, and make informed business decisions regarding Portable Power Supply.
The Portable Power Supply market size, estimations, and forecasts are provided in terms of sales volume (K Units) and revenue ($ millions), considering 2022 as the base year, with history and forecast data for the period from 2017 to 2028. This report segments the global Portable Power Supply market comprehensively. Regional market sizes, concerning products by Type, by Application, and by players, are also provided. The influence of COVID-19 and the Russia-Ukraine War were considered while estimating market sizes.
For a more in-depth understanding of the market, the report provides profiles of the competitive landscape, key competitors, and their respective market ranks. The report also discusses technological trends and new product developments.
This report will help the readers to understand the competition within the industries and strategies for the competitive environment to enhance the potential profit. The report also focuses on the competitive landscape of the global Portable Power Supply market, and introduces in detail the market share, industry ranking, competitor ecosystem, market performance, new product development, operation situation, expansion, and acquisition. etc. of the main players, which helps the readers to identify the main competitors and deeply understand the competition pattern of the market.
Market Segmentation
This report covers the Portable Power Supply segments by manufacturers, by Type, by Application, by region and country, and provides market size (value, volume and average price) and CAGR for the history and forecast period (2017-2022, 2023-2028), considering 2021 as the base year. It elucidates potential revenue opportunities across different segments and explains attractive investment proposition matrices for this market.
By Company
- EcoFlow
- Shenzhen Hello Tech Energy
- GOAL ZERO
- PowerOak
- Westinghouse
- ANKER
- Dbk Electronics
- Allpowers Industrial
- JVC
- Pisen
- SBASE
- YOOBAO
- Letsolar
- Newsmy
- ORICO Technologies
- Flashfish
- Pecron
Segment by Type
- Output Power less than 1kW
- more than 1KW and less than 2KW
- more than 2KW and less than 3KW
- Output Power more than 3kW
Segment by Application
- Home Appliances
- Electric Tools
- Automobile
- Others
By Region
- North America
- United States
- Canada
- Mexico
- Asia-Pacific
- Japan
- China
- Korea
- Southeast Asia
- India
- Australia
- Others
- Europe
- Germany
- France
- U.K.
- Italy
- Others
- Latin America
- Brazil
- Argentina
- Others
- Middle East & Africa
Core Chapters
- Chapter One: Introduces the study scope of this report, executive summary of market segments by Type, market size segments for North America, Europe, Asia Pacific, Latin America, Middle East & Africa.
- Chapter Two: Detailed analysis of Portable Power Supply manufacturers competitive landscape, price, sales, revenue, market share and ranking, latest development plan, merger, and acquisition information, etc.
- Chapter Three: Sales, revenue of Portable Power Supply in regional level. It provides a quantitative analysis of the market size and development potential of each region and introduces the future development prospects, and market space in the world.
- Chapter Four: Introduces market segments by Application, market size segment for North America, Europe, Asia Pacific, Latin America, Middle East & Africa.
- Chapter Five, Six, Seven, Eight and Nine: North America, Europe, Asia Pacific, Latin America, Middle East & Africa, sales and revenue by country.
- Chapter Ten: Provides profiles of key players, introducing the basic situation of the main companies in the market in detail, including product sales, revenue, price, gross margin, product introduction, etc.
- Chapter Eleven: Analysis of industrial chain, key raw materials, manufacturing cost, and market dynamics. Introduces the market dynamics, latest developments of the market, the driving factors and restrictive factors of the market, the challenges and risks faced by manufacturers in the industry, and the analysis of relevant policies in the industry.
- Chapter Twelve: Research Findings and Conclusion
Table of Contents
1 Portable Power Supply Market Overview
- 1.1 Portable Power Supply Product Overview
- 1.2 Portable Power Supply Market Segment by Type
- 1.2.1 Output Power less than 1kW
- 1.2.2 More than 1KW and less than 2KW
- 1.2.3 More than 2KWand less than 3KW
- 1.2.4 Output Power more than 3kW
- 1.3 Global Portable Power Supply Market Size by Type
- 1.3.1 Global Portable Power Supply Market Size Overview by Type (2017-2028)
- 1.3.2 Global Portable Power Supply Historic Market Size Review by Type (2017-2022)
- 1.3.3 Global Portable Power Supply Forecasted Market Size by Type (2023-2028)
- 1.4 Key Regions Market Size Segment by Type
- 1.4.1 North America Portable Power Supply Sales Breakdown by Type (2017-2028)
- 1.4.2 Europe Portable Power Supply Sales Breakdown by Type (2017-2028)
- 1.4.3 Asia-Pacific Portable Power Supply Sales Breakdown by Type (2017-2028)
- 1.4.4 Latin America Portable Power Supply Sales Breakdown by Type (2017-2028)
- 1.4.5 Middle East and Africa Portable Power Supply Sales Breakdown by Type (2017-2028)
2 Portable Power Supply Market Competition by Company
- 2.1 Global Top Players by Portable Power Supply Sales (2019-2022)
- 2.2 Global Top Players by Portable Power Supply Revenue (2019-2022)
- 2.3 Global Top Players by Portable Power Supply Price (2019-2022)
- 2.4 Global Top Manufacturers Portable Power Supply Manufacturing Base Distribution, Headquarters
- 2.5 Portable Power Supply Market Competitive Situation and Trends
- 2.5.1 Portable Power Supply Market Concentration Rate (2019-2022)
- 2.5.2 Global 3 and 5 Largest Manufacturers by Portable Power Supply Revenue in 2022
- 2.6 Global Top Manufacturers by Company Type (Tier 1, Tier 2, and Tier 3) & (based on the Revenue in Portable Power Supply as of 2022)
- 2.7 Date of Key Manufacturers Enter into Portable Power Supply Market
- 2.8 Key Manufacturers Portable Power Supply Product Offered
- 2.9 Mergers & Acquisitions, Expansion
3 Portable Power Supply Status and Outlook by Region
- 3.1 Global Portable Power Supply Market Size and CAGR by Region: 2017 VS 2022 VS 2028
- 3.2 Global Portable Power Supply Historic Market Size by Region
- 3.2.1 Global Portable Power Supply Sales in Volume by Region (2017-2022)
- 3.2.2 Global Portable Power Supply Sales in Value by Region (2017-2022)
- 3.2.3 Global Portable Power Supply Sales (Volume & Value), Price and Gross Margin (2017-2022)
- 3.3 Global Portable Power Supply Forecasted Market Size by Region
- 3.3.1 Global Portable Power Supply Sales in Volume by Region (2023-2028)
- 3.3.2 Global Portable Power Supply Sales in Value by Region (2023-2028)
- 3.3.3 Global Portable Power Supply Sales (Volume & Value), Price and Gross Margin (2023-2028)
4 Portable Power Supply by Application
- 4.1 Portable Power Supply Market Segment by Application
- 4.1.1 Home Appliances
- 4.1.2 Electric Tools
- 4.1.3 Automobile
- 4.1.4 Others
- 4.2 Global Portable Power Supply Market Size by Application
- 4.2.1 Global Portable Power Supply Market Size Overview by Application (2017-2028)
- 4.2.2 Global Portable Power Supply Historic Market Size Review by Application (2017-2022)
- 4.2.3 Global Portable Power Supply Forecasted Market Size by Application (2023-2028)
- 4.3 Key Regions Market Size Segment by Application
- 4.3.1 North America Portable Power Supply Sales Breakdown by Application (2017-2028)
- 4.3.2 Europe Portable Power Supply Sales Breakdown by Application (2017-2028)
- 4.3.3 Asia-Pacific Portable Power Supply Sales Breakdown by Application (2017-2028)
- 4.3.4 Latin America Portable Power Supply Sales Breakdown by Application (2017-2028)
- 4.3.5 Middle East and Africa Portable Power Supply Sales Breakdown by Application (2017-2028)
5 North America Portable Power Supply by Country
- 5.1 North America Portable Power Supply Historic Market Size by Country
- 5.1.1 North America Portable Power Supply Sales in Volume by Country (2017-2022)
- 5.1.2 North America Portable Power Supply Sales in Value by Country (2017-2022)
- 5.2 North America Portable Power Supply Forecasted Market Size by Country
- 5.2.1 North America Portable Power Supply Sales in Volume by Country (2023-2028)
- 5.2.2 North America Portable Power Supply Sales in Value by Country (2023-2028)
6 Europe Portable Power Supply by Country
- 6.1 Europe Portable Power Supply Historic Market Size by Country
- 6.1.1 Europe Portable Power Supply Sales in Volume by Country (2017-2022)
- 6.1.2 Europe Portable Power Supply Sales in Value by Country (2017-2022)
- 6.2 Europe Portable Power Supply Forecasted Market Size by Country
- 6.2.1 Europe Portable Power Supply Sales in Volume by Country (2023-2028)
- 6.2.2 Europe Portable Power Supply Sales in Value by Country (2023-2028)
7 Asia-Pacific Portable Power Supply by Region
- 7.1 Asia-Pacific Portable Power Supply Historic Market Size by Region
- 7.1.1 Asia-Pacific Portable Power Supply Sales in Volume by Region (2017-2022)
- 7.1.2 Asia-Pacific Portable Power Supply Sales in Value by Region (2017-2022)
- 7.2 Asia-Pacific Portable Power Supply Forecasted Market Size by Region
- 7.2.1 Asia-Pacific Portable Power Supply Sales in Volume by Region (2023-2028)
- 7.2.2 Asia-Pacific Portable Power Supply Sales in Value by Region (2023-2028)
8 Latin America Portable Power Supply by Country
- 8.1 Latin America Portable Power Supply Historic Market Size by Country
- 8.1.1 Latin America Portable Power Supply Sales in Volume by Country (2017-2022)
- 8.1.2 Latin America Portable Power Supply Sales in Value by Country (2017-2022)
- 8.2 Latin America Portable Power Supply Forecasted Market Size by Country
- 8.2.1 Latin America Portable Power Supply Sales in Volume by Country (2023-2028)
- 8.2.2 Latin America Portable Power Supply Sales in Value by Country (2023-2028)
9 Middle East and Africa Portable Power Supply by Country
- 9.1 Middle East and Africa Portable Power Supply Historic Market Size by Country
- 9.1.1 Middle East and Africa Portable Power Supply Sales in Volume by Country (2017-2022)
- 9.1.2 Middle East and Africa Portable Power Supply Sales in Value by Country (2017-2022)
- 9.2 Middle East and Africa Portable Power Supply Forecasted Market Size by Country
- 9.2.1 Middle East and Africa Portable Power Supply Sales in Volume by Country (2023-2028)
- 9.2.2 Middle East and Africa Portable Power Supply Sales in Value by Country (2023-2028)
10 Company Profiles and Key Figures in Portable Power Supply Business
- 10.1 EcoFlow
- 10.1.1 EcoFlow Corporation Information
- 10.1.2 EcoFlow Introduction and Business Overview
- 10.1.3 EcoFlow Portable Power Supply Sales, Revenue and Gross Margin (2019-2022)
- 10.1.4 EcoFlow Portable Power Supply Products Offered
- 10.2 Shenzhen Hello Tech Energy
- 10.2.1 Shenzhen Hello Tech Energy Corporation Information
- 10.2.2 Shenzhen Hello Tech Energy Introduction and Business Overview
- 10.2.3 Shenzhen Hello Tech Energy Portable Power Supply Sales, Revenue and Gross Margin (2019-2022)
- 10.2.4 Shenzhen Hello Tech Energy Portable Power Supply Products Offered
- 10.3 GOAL ZERO
- 10.3.1 GOAL ZERO Corporation Information
- 10.3.2 GOAL ZERO Introduction and Business Overview
- 10.3.3 GOAL ZERO Portable Power Supply Sales, Revenue and Gross Margin (2019-2022)
- 10.3.4 GOAL ZERO Portable Power Supply Products Offered
- 10.4 PowerOak
- 10.4.1 PowerOak Corporation Information
- 10.4.2 PowerOak Introduction and Business Overview
- 10.4.3 PowerOak Portable Power Supply Sales, Revenue and Gross Margin (2019-2022)
- 10.4.4 PowerOak Portable Power Supply Products Offered
- 10.5 Westinghouse
- 10.5.1 Westinghouse Corporation Information
- 10.5.2 Westinghouse Introduction and Business Overview
- 10.5.3 Westinghouse Portable Power Supply Sales, Revenue and Gross Margin (2019-2022)
- 10.5.4 Westinghouse Portable Power Supply Products Offered
- 10.6 ANKER
- 10.6.1 ANKER Corporation Information
- 10.6.2 ANKER Introduction and Business Overview
- 10.6.3 ANKER Portable Power Supply Sales, Revenue and Gross Margin (2019-2022)
- 10.6.4 ANKER Portable Power Supply Products Offered
- 10.7 Dbk Electronics
- 10.7.1 Dbk Electronics Corporation Information
- 10.7.2 Dbk Electronics Introduction and Business Overview
- 10.7.3 Dbk Electronics Portable Power Supply Sales, Revenue and Gross Margin (2019-2022)
- 10.7.4 Dbk Electronics Portable Power Supply Products Offered
- 10.8 Allpowers
- 10.8.1 Allpowers Corporation Information
- 10.8.2 Allpowers Introduction and Business Overview
- 10.8.3 Allpowers Portable Power Supply Sales, Revenue and Gross Margin (2019-2022)
- 10.8.4 Allpowers Portable Power Supply Products Offered
- 10.9 JVC
- 10.9.1 JVC Corporation Information
- 10.9.2 JVC Introduction and Business Overview
- 10.9.3 JVC Portable Power Supply Sales, Revenue and Gross Margin (2019-2022)
- 10.9.4 JVC Portable Power Supply Products Offered
- 10.10 Pisen
- 10.10.1 Pisen Corporation Information
- 10.10.2 Pisen Introduction and Business Overview
- 10.10.3 Pisen Portable Power Supply Sales, Revenue and Gross Margin (2019-2022)
- 10.10.4 Pisen Portable Power Supply Products Offered
- 10.11 SBASE
- 10.11.1 SBASE Corporation Information
- 10.11.2 SBASE Introduction and Business Overview
- 10.11.3 SBASE Portable Power Supply Sales, Revenue and Gross Margin (2019-2022)
- 10.11.4 SBASE Portable Power Supply Products Offered
- 10.12 YOOBAO
- 10.12.1 YOOBAO Corporation Information
- 10.12.2 YOOBAO Introduction and Business Overview
- 10.12.3 YOOBAO Portable Power Supply Sales, Revenue and Gross Margin (2019-2022)
- 10.12.4 YOOBAO Portable Power Supply Products Offered
- 10.13 Letsolar
- 10.13.1 Letsolar Corporation Information
- 10.13.2 Letsolar Introduction and Business Overview
- 10.13.3 Letsolar Portable Power Supply Sales, Revenue and Gross Margin (2019-2022)
- 10.13.4 Letsolar Portable Power Supply Products Offered
- 10.14 Newsmy
- 10.14.1 Newsmy Corporation Information
- 10.14.2 Newsmy Introduction and Business Overview
- 10.14.3 Newsmy Portable Power Supply Sales, Revenue and Gross Margin (2019-2022)
- 10.14.4 Newsmy Portable Power Supply Products Offered
- 10.15 ORICO Technologies
- 10.15.1 ORICO Technologies Corporation Information
- 10.15.2 ORICO Technologies Introduction and Business Overview
- 10.15.3 ORICO Technologies Portable Power Supply Sales, Revenue and Gross Margin (2019-2022)
- 10.15.4 ORICO Technologies Portable Power Supply Products Offered
- 10.16 Flashfish
- 10.16.1 Flashfish Corporation Information
- 10.16.2 Flashfish Introduction and Business Overview
- 10.16.3 Flashfish Portable Power Supply Sales, Revenue and Gross Margin (2019-2022)
- 10.16.4 Flashfish Portable Power Supply Products Offered
- 10.17 Pecron
- 10.17.1 Pecron Corporation Information
- 10.17.2 Pecron Introduction and Business Overview
- 10.17.3 Pecron Portable Power Supply Sales, Revenue and Gross Margin (2019-2022)
- 10.17.4 Pecron Portable Power Supply Products Offered
11 Upstream, Opportunities, Challenges, Risks and Influences Factors Analysis
- 11.1 Portable Power Supply Key Raw Materials
- 11.1.1 Key Raw Materials
- 11.1.2 Raw Materials Key Suppliers
- 11.2 Manufacturing Cost Structure
- 11.2.1 Raw Materials
- 11.2.2 Labor Cost
- 11.2.3 Manufacturing Expenses
- 11.3 Portable Power Supply Industrial Chain Analysis
- 11.4 Portable Power Supply Market Dynamics
- 11.4.1 Portable Power Supply Industry Trends
- 11.4.2 Portable Power Supply Market Drivers
- 11.4.3 Portable Power Supply Market Challenges
- 11.4.4 Portable Power Supply Market Restraints
12 Marketing Strategy Analysis, Distributors
- 12.1 Sales Channel
- 12.1.1 Global Portable Power Supply Market Size by Sales Channel
- 12.1.2 North America Portable Power Supply Sales in Volume by Sales Channel
- 12.1.3 Europe Portable Power Supply Sales in Volume by Sales Channel
- 12.1.4 Asia-Pacific Portable Power Supply Sales in Volume by Sales Channel
- 12.1.5 Latin America Portable Power Supply Sales in Volume by Sales Channel
- 12.1.6 Middle East and Africa Portable Power Supply Sales in Volume by Sales Channel
- 12.2 Portable Power Supply Distributors
- 12.3 Portable Power Supply Online Sales Platform
- 12.4 Portable Power Supply Downstream Application
- 12.4.1 Outdoor Camping
- 12.4.2 Medical Power Supply
- 12.4.3 Natural Disaster
- 12.5 Portable Power Supply Downstream Customers
13 Research Findings and Conclusion
14 Appendix
- 14.1 Research Methodology
- 14.1.1 Methodology/Research Approach
- 14.1.2 Data Source
- 14.2 Author Details
- 14.3 Disclaimer