|
|
市場調査レポート
商品コード
1381265
VOC回収・除去の世界市場: 規模・現況・予測 (2023-2029年)Global VOC Recovery and Abatement Market Size, Status and Forecast 2023-2029 |
||||||
|
|
|||||||
|
● お客様のご希望に応じて、既存データの加工や未掲載情報(例:国別セグメント)の追加などの対応が可能です。 詳細はお問い合わせください。 |
|||||||


| VOC回収・除去の世界市場: 規模・現況・予測 (2023-2029年) |
|
出版日: 2023年11月16日
発行: QYResearch
ページ情報: 英文 194 Pages
納期: 2~3営業日
|
- 全表示
- 概要
- 図表
- 目次
世界のVOC回収・除去の市場規模は、2023年の138億9,874万米ドルから、予測期間中は24.99%のCAGRで推移し、2029年には530億390万米ドルの規模に成長すると予測されています。
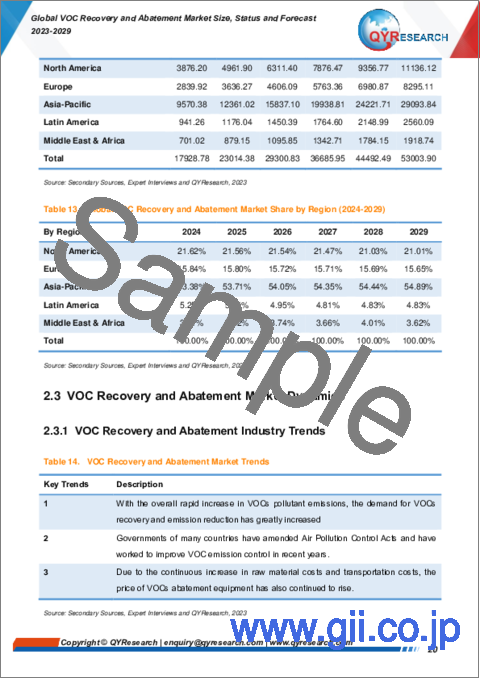
地域別では、米国・カナダ市場が2023年の30億352万米ドルから、24.41%のCAGRで推移し、2029年には111億3,612万米ドルの規模に成長すると予測されています。また、アジア太平洋市場は、2023年の73億9,691万米ドルから、予測期間中は25.64%のCAGRで推移し、2029年には290億9,384万米ドルの規模に成長すると予測されています。さらに、欧州市場は、2023年の21億9,739万米ドルから、予測期間中は24.78%のCAGRで推移し、2029年には82億9,511万米ドルの規模に成長すると予測されています。
当レポートでは、世界のVOC回収・除去の市場を調査し、市場および製品の概要、競合情勢、市場規模の推移・予測、各種区分・地域/主要国別の詳細分析、価格動向、市場成長への各種影響因子の分析、主要企業の分析などをまとめています。
目次
第1章 レポート概要
- 製品概要
- タイプ別市場
- 成長率:2018 vs 2023 vs 2029
- 再生熱酸化
- 蓄熱熱酸化
- 触媒酸化
- 活性炭吸着
- クライオコンデンセーション
- その他
- 用途別の市場
- 市場規模:2018 vs 2023 vs 2029
- 石油・石油化学
- パッケージング・印刷
- 医薬品
- 食品
- プラスチック・ゴム
- 鉄鋼
- コーティング・インク
- 前提・制限
- 調査目的
- 調査年数
第2章 世界の成長動向
- 市場の展望(2018~2029年)
- 成長動向:地域別
- 世界市場の規模:2018年 vs 2022年 vs 2029年
- 市場規模の推移
- 市場規模の予測
- 市場力学
- 産業動向
- 市場促進要因
- 市場課題
- 市場抑制要因
第3章 競合情勢:主要企業別
- 収益の推移・収益シェア:企業別
- 市場シェア:企業タイプ別
- 主要企業の収益ランキング:2021 vs 2022 vs 2023
- 市場集中度
- 世界の主要企業:本社およびサービス提供地域
- 世界の主要企業:製品・用途
- 世界の主要企業:参入日
- M&A・拡張計画
第4章 VOC回収・除去市場の内訳データ:タイプ別
- 市場規模の推移・予測
第5章 VOC回収・除去市場の内訳データ:用途別
- 市場規模の推移・予測
第6章 北米
第7章 欧州
第8章 アジア太平洋
第9章 ラテンアメリカ
第10章 中東・アフリカ
第11章 主要企業のプロファイル
- Air Products
- Linde plc
- Wartsila
- Munters
- TOYOBO
- Taikisha
- Nippon Gases
- Calgon Carbon Corporation
- Condorchem Envitech
- Conifer Systems
- Anguil
- ComEnCo Systems
- Polaris
- Bay Environmental Technology
- KVT Process Technology
- CECO Environmental
- SINOPEC Qingdao Safety Engineering
- Naide
- ECOTEC
- Sinochem Environment Air Pollution Control
- WELLE Environmental Group
第12章 アナリストによる見解・総論
第13章 付録
List of Tables
- Table 1. Global VOC Recovery and Abatement Market Size Growth Rate by Type (US$ Million): 2018 VS 2022 VS 2029
- Table 2. Key Players of Regenerative Thermal Oxidation
- Table 3. Key Players of Recuperative Thermal Oxidation
- Table 4. Key Players of Catalytic Oxidation
- Table 5. Key Players of Adsorption by Activated Carbon
- Table 6. Key Players of Cryocondensation
- Table 7. Key Players of Biological Filter
- Table 8. Global VOC Recovery and Abatement Market Size Growth by Application (US$ Million): 2018 VS 2022 VS 2029
- Table 9. Global VOC Recovery and Abatement Market Size Growth Rate (CAGR) by Region (US$ Million): 2018 VS 2022 VS 2029
- Table 10. Global VOC Recovery and Abatement Market Size by Region (2018-2023) & (US$ Million)
- Table 11. Global VOC Recovery and Abatement Market Share by Region (2018-2023)
- Table 12. Global VOC Recovery and Abatement Forecasted Market Size by Region (2024-2029) & (US$ Million)
- Table 13. Global VOC Recovery and Abatement Market Share by Region (2024-2029)
- Table 14. VOC Recovery and Abatement Market Trends
- Table 15. VOC Recovery and Abatement Market Drivers
- Table 16. VOC Recovery and Abatement Market Challenges
- Table 17. VOC Recovery and Abatement Market Restraints
- Table 18. Global VOC Recovery and Abatement Revenue by Players (2018-2023) & (US$ Million)
- Table 19. Global VOC Recovery and Abatement Market Share by Players (2018-2023)
- Table 20. Global Top VOC Recovery and Abatement Players by Company Type (Tier 1, Tier 2, and Tier 3) & (based on the Revenue in VOC Recovery and Abatement as of 2021)
- Table 21. Global VOC Recovery and Abatement Industry Ranking 2021 VS 2022
- Table 22. Global 5 Largest Players Market Share by VOC Recovery and Abatement Revenue (CR5 and HHI) & (2018-2023)
- Table 23. Global Key Players of VOC Recovery and Abatement, Headquarters and Area Served
- Table 24. Global Key Players of VOC Recovery and Abatement, Solution and Service
- Table 25. Global Key Players of VOC Recovery and Abatement, Date of Enter into This Industry
- Table 26. Mergers & Acquisitions, Expansion Plans
- Table 27. Global VOC Recovery and Abatement Market Size by Type (2018-2023) & (US$ Million)
- Table 28. Global VOC Recovery and Abatement Revenue Market Share by Type (2018-2023)
- Table 29. Global VOC Recovery and Abatement Forecasted Market Size by Type (2024-2029) & (US$ Million)
- Table 30. Global VOC Recovery and Abatement Revenue Market Share by Type (2024-2029)
- Table 31. Global VOC Recovery and Abatement Market Size by Application (2018-2023) & (US$ Million)
- Table 32. Global VOC Recovery and Abatement Revenue Market Share by Application (2018-2023)
- Table 33. Global VOC Recovery and Abatement Forecasted Market Size by Application (2024-2029) & (US$ Million)
- Table 34. Global VOC Recovery and Abatement Revenue Market Share by Application (2024-2029)
- Table 35. North America VOC Recovery and Abatement Market Size by Type (2018-2023) & (US$ Million)
- Table 36. North America VOC Recovery and Abatement Market Size by Type (2024-2029) & (US$ Million)
- Table 37. North America VOC Recovery and Abatement Market Size by Application (2018-2023) & (US$ Million)
- Table 38. North America VOC Recovery and Abatement Market Size by Application (2024-2029) & (US$ Million)
- Table 39. North America VOC Recovery and Abatement Growth Rate (CAGR) by Country (US$ Million): 2018 VS 2022 VS 2029
- Table 40. North America VOC Recovery and Abatement Market Size by Country (2018-2023) & (US$ Million)
- Table 41. North America VOC Recovery and Abatement Market Size by Country (2024-2029) & (US$ Million)
- Table 42. Europe VOC Recovery and Abatement Market Size by Type (2018-2023) & (US$ Million)
- Table 43. Europe VOC Recovery and Abatement Market Size by Type (2024-2029) & (US$ Million)
- Table 44. Europe VOC Recovery and Abatement Market Size by Application (2018-2023) & (US$ Million)
- Table 45. Europe VOC Recovery and Abatement Market Size by Application (2024-2029) & (US$ Million)
- Table 46. Europe VOC Recovery and Abatement Growth Rate (CAGR) by Country (US$ Million): 2018 VS 2022 VS 2029
- Table 47. Europe VOC Recovery and Abatement Market Size by Country (2018-2023) & (US$ Million)
- Table 48. Europe VOC Recovery and Abatement Market Size by Country (2024-2029) & (US$ Million)
- Table 49. Asia-Pacific VOC Recovery and Abatement Market Size by Type (2018-2023) & (US$ Million)
- Table 50. Asia-Pacific VOC Recovery and Abatement Market Size by Type (2024-2029) & (US$ Million)
- Table 51. Asia-Pacific VOC Recovery and Abatement Market Size by Application (2018-2023) & (US$ Million)
- Table 52. Asia-Pacific VOC Recovery and Abatement Market Size by Application (2024-2029) & (US$ Million)
- Table 53. Asia-Pacific VOC Recovery and Abatement Market Size by Region (2018-2023) & (US$ Million)
- Table 54. Asia-Pacific VOC Recovery and Abatement Market Size by Region (2024-2029) & (US$ Million)
- Table 55. Latin America VOC Recovery and Abatement Market Size by Type (2018-2023) & (US$ Million)
- Table 56. Latin America VOC Recovery and Abatement Market Size by Type (2024-2029) & (US$ Million)
- Table 57. Latin America VOC Recovery and Abatement Market Size by Application (2018-2023) & (US$ Million)
- Table 58. Latin America VOC Recovery and Abatement Market Size by Application (2024-2029) & (US$ Million)
- Table 59. Latin America VOC Recovery and Abatement Growth Rate (CAGR) by Region (US$ Million): 2018 VS 2022 VS 2029
- Table 60. Latin America VOC Recovery and Abatement Market Size by Region (2018-2023) & (US$ Million)
- Table 61. Latin America VOC Recovery and Abatement Market Size by Region (2024-2029) & (US$ Million)
- Table 62. Middle East & Africa VOC Recovery and Abatement Market Size by Type (2018-2023) & (US$ Million)
- Table 63. Middle East & Africa VOC Recovery and Abatement Market Size by Type (2024-2029) & (US$ Million)
- Table 64. Middle East & Africa VOC Recovery and Abatement Market Size by Application (2018-2023) & (US$ Million)
- Table 65. Middle East & Africa VOC Recovery and Abatement Market Size by Application (2024-2029) & (US$ Million)
- Table 66. Middle East & Africa VOC Recovery and Abatement Growth Rate (CAGR) by Country (US$ Million): 2018 VS 2022 VS 2029
- Table 67. Middle East & Africa VOC Recovery and Abatement Market Size by Country (2018-2023) & (US$ Million)
- Table 68. Middle East & Africa VOC Recovery and Abatement Market Size by Country (2024-2029) & (US$ Million)
- Table 69. Air Products Company Details
- Table 70. Air Products Business Overview
- Table 71. Air Products VOC Recovery and Abatement Product
- Table 72. Air Products Revenue in VOC Recovery and Abatement Business (2018-2023) & (US$ Million)
- Table 73. Linde plc Company Details
- Table 74. Linde plc Business Overview
- Table 75. Linde plc VOC Recovery and Abatement Product
- Table 76. Linde plc Revenue in VOC Recovery and Abatement Business (2018-2023) & (US$ Million)
- Table 77. Wartsila Company Details
- Table 78. Wartsila Business Overview
- Table 79. Wartsila VOC Recovery and Abatement Product
- Table 80. Wartsila Revenue in VOC Recovery and Abatement Business (2018-2023) & (US$ Million)
- Table 81. Wartsila Recent Development
- Table 82. Munters Company Details
- Table 83. Munters Business Overview
- Table 84. Munters VOC Recovery and Abatement Product
- Table 85. Munters Revenue in VOC Recovery and Abatement Business (2018-2023) & (US$ Million)
- Table 86. TOYOBO Company Details
- Table 87. TOYOBO Business Overview
- Table 88. TOYOBO VOC Recovery and Abatement Product
- Table 89. TOYOBO Revenue in VOC Recovery and Abatement Business (2018-2023) & (US$ Million)
- Table 90. Taikisha Company Details
- Table 91. Taikisha Business Overview
- Table 92. Taikisha VOC Recovery and Abatement Product
- Table 93. Taikisha Revenue in VOC Recovery and Abatement Business (2018-2023) & (US$ Million)
- Table 94. Nippon Gases Company Details
- Table 95. Nippon Gases Business Overview
- Table 96. Nippon Gases VOC Recovery and Abatement Product
- Table 97. Nippon Gases Revenue in VOC Recovery and Abatement Business (2018-2023) & (US$ Million)
- Table 98. Calgon Carbon Corporation Company Details
- Table 99. Calgon Carbon Corporation Business Overview
- Table 100. Calgon Carbon Corporation VOC Recovery and Abatement Product
- Table 101. Calgon Carbon Corporation Revenue in VOC Recovery and Abatement Business (2018-2023) & (US$ Million)
- Table 102. Calgon Carbon Corporation Recent Development
- Table 103. Condorchem Envitech Company Details
- Table 104. Condorchem Envitech Business Overview
- Table 105. Condorchem Envitech VOC Recovery and Abatement Product
- Table 106. Condorchem Envitech Revenue in VOC Recovery and Abatement Business (2018-2023) & (US$ Million)
- Table 107. Conifer Systems Company Details
- Table 108. Conifer Systems Business Overview
- Table 109. Conifer Systems VOC Recovery and Abatement Product
- Table 110. Conifer Systems Revenue in VOC Recovery and Abatement Business (2018-2023) & (US$ Million)
- Table 111. Anguil Company Details
- Table 112. Anguil Business Overview
- Table 113. Anguil VOC Recovery and Abatement Product
- Table 114. Anguil Revenue in VOC Recovery and Abatement Business (2018-2023) & (US$ Million)
- Table 115. Anguil Recent Development
- Table 116. ComEnCo Systems Company Details
- Table 117. ComEnCo Systems Business Overview
- Table 118. ComEnCo Systems VOC Recovery and Abatement Product
- Table 119. ComEnCo Systems Revenue in VOC Recovery and Abatement Business (2018-2023) & (US$ Million)
- Table 120. Polaris Company Details
- Table 121. Polaris Business Overview
- Table 122. Polaris VOC Recovery and Abatement Product
- Table 123. Polaris Revenue in VOC Recovery and Abatement Business (2018-2023) & (US$ Million)
- Table 124. Bay Environmental Technology Company Details
- Table 125. Bay Environmental Technology Business Overview
- Table 126. Bay Environmental Technology VOC Recovery and Abatement Product
- Table 127. Bay Environmental Technology Revenue in VOC Recovery and Abatement Business (2018-2023) & (US$ Million)
- Table 128. KVT Process Technology Company Details
- Table 129. KVT Process Technology Business Overview
- Table 130. KVT Process Technology VOC Recovery and Abatement Product
- Table 131. KVT Process Technology Revenue in VOC Recovery and Abatement Business (2018-2023) & (US$ Million)
- Table 132. CECO Environmental Company Details
- Table 133. CECO Environmental Business Overview
- Table 134. CECO Environmental VOC Recovery and Abatement Product
- Table 135. CECO Environmental Revenue in VOC Recovery and Abatement Business (2018-2023) & (US$ Million)
- Table 136. CECO Environmental Recent Development
- Table 137. SINOPEC Qingdao Safety Engineering Company Details
- Table 138. SINOPEC Qingdao Safety Engineering Business Overview
- Table 139. SINOPEC Qingdao Safety Engineering VOC Recovery and Abatement Product
- Table 140. SINOPEC Qingdao Safety Engineering Revenue in VOC Recovery and Abatement Business (2018-2023) & (US$ Million)
- Table 141. Naide Company Details
- Table 142. Naide Business Overview
- Table 143. Naide VOC Recovery and Abatement Product
- Table 144. Naide Revenue in VOC Recovery and Abatement Business (2018-2023) & (US$ Million)
- Table 145. ECOTEC Company Details
- Table 146. ECOTEC Business Overview
- Table 147. ECOTEC VOC Recovery and Abatement Product
- Table 148. ECOTEC Revenue in VOC Recovery and Abatement Business (2018-2023) & (US$ Million)
- Table 149. Sinochem Environment Air Pollution Control Company Details
- Table 150. Sinochem Environment Air Pollution Control Business Overview
- Table 151. Sinochem Environment Air Pollution Control VOC Recovery and Abatement Product
- Table 152. Sinochem Environment Air Pollution Control Revenue in VOC Recovery and Abatement Business (2018-2023) & (US$ Million)
- Table 153. Sinochem Environment Air Pollution Control Recent Development
- Table 154. WELLE Environmental Group Company Details
- Table 155. WELLE Environmental Group Business Overview
- Table 156. WELLE Environmental Group VOC Recovery and Abatement Product
- Table 157. WELLE Environmental Group Revenue in VOC Recovery and Abatement Business (2018-2023) & (US$ Million)
- Table 158. WELLE Environmental Group Recent Development
- Table 159. Research Programs/Design for This Report
- Table 160. Key Data Information from Secondary Sources
- Table 161. Key Data Information from Primary Sources
- Table 162. QYR Business Unit and Senior & Team Lead Analysts
List of Figures
- Figure 1. Global VOC Recovery and Abatement Market Share by Type: 2022 VS 2029
- Figure 2. Regenerative Thermal Oxidation Features
- Figure 3. Recuperative Thermal Oxidation Features
- Figure 4. Catalytic Oxidation Features
- Figure 5. Adsorption by Activated Carbon Features
- Figure 6. Cryocondensation Features
- Figure 7. Biological Filter Features
- Figure 8. Global VOC Recovery and Abatement Market Share by Application: 2022 VS 2029
- Figure 9. Petroleum and Petrochemical Case Studies
- Figure 10. Packaging and Printing Case Studies
- Figure 11. Pharmaceuticals Case Studies
- Figure 12. Food Case Studies
- Figure 13. Plastic and Rubber Case Studies
- Figure 14. Iron and Steel Case Studies
- Figure 15. Coatings and Inks Case Studies
- Figure 16. VOC Recovery and Abatement Report Years Considered
- Figure 17. Global VOC Recovery and Abatement Market Size (US$ Million), Year-over-Year: 2018-2029
- Figure 18. Global VOC Recovery and Abatement Market Size, (US$ Million), 2018 VS 2022 VS 2029
- Figure 19. Global VOC Recovery and Abatement Market Share by Region: 2022 VS 2029
- Figure 20. Global VOC Recovery and Abatement Market Share by Players in 2022
- Figure 21. Global Top VOC Recovery and Abatement Players by Company Type (Tier 1, Tier 2, and Tier 3) & (based on the Revenue in VOC Recovery and Abatement as of 2022)
- Figure 22. The 5 Players Market Share by VOC Recovery and Abatement Revenue in 2022
- Figure 23. North America VOC Recovery and Abatement Market Size YoY Growth (2018-2029) & (US$ Million)
- Figure 24. North America VOC Recovery and Abatement Market Share by Type (2018-2029)
- Figure 25. North America VOC Recovery and Abatement Market Share by Application (2018-2029)
- Figure 26. North America VOC Recovery and Abatement Market Share by Country (2018-2029)
- Figure 27. United States VOC Recovery and Abatement Market Size YoY Growth (2018-2029) & (US$ Million)
- Figure 28. Canada VOC Recovery and Abatement Market Size YoY Growth (2018-2029) & (US$ Million)
- Figure 29. Europe VOC Recovery and Abatement Market Size YoY Growth (2018-2029) & (US$ Million)
- Figure 30. Europe VOC Recovery and Abatement Market Share by Type (2018-2029)
- Figure 31. Europe VOC Recovery and Abatement Market Share by Application (2018-2029)
- Figure 32. Europe VOC Recovery and Abatement Market Share by Country (2018-2029)
- Figure 33. Germany VOC Recovery and Abatement Market Size YoY Growth (2018-2029) & (US$ Million)
- Figure 34. France VOC Recovery and Abatement Market Size YoY Growth (2018-2029) & (US$ Million)
- Figure 35. U.K. VOC Recovery and Abatement Market Size YoY Growth (2018-2029) & (US$ Million)
- Figure 36. Italy VOC Recovery and Abatement Market Size YoY Growth (2018-2029) & (US$ Million)
- Figure 37. Spain VOC Recovery and Abatement Market Size YoY Growth (2018-2029) & (US$ Million)
- Figure 38. Nordic Countries VOC Recovery and Abatement Market Size YoY Growth (2018-2029) & (US$ Million)
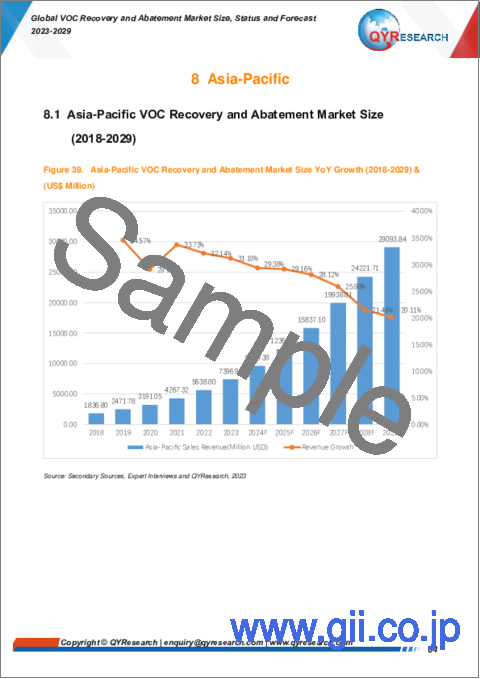
- Figure 39. Asia-Pacific VOC Recovery and Abatement Market Size YoY Growth (2018-2029) & (US$ Million)
- Figure 40. Asia-Pacific VOC Recovery and Abatement Market Share by Type (2018-2029)
- Figure 41. Asia-Pacific VOC Recovery and Abatement Market Share by Application (2018-2029)
- Figure 42. Asia-Pacific VOC Recovery and Abatement Market Share by Region (2017-2028)
- Figure 43. China VOC Recovery and Abatement Market Size YoY Growth (2017-2028) & (US$ Million)
- Figure 44. Japan VOC Recovery and Abatement Market Size YoY Growth (2017-2028) & (US$ Million)
- Figure 45. South Korea VOC Recovery and Abatement Market Size YoY Growth (2017-2028) & (US$ Million)
- Figure 46. Southeast Asia VOC Recovery and Abatement Market Size YoY Growth (2017-2028) & (US$ Million)
- Figure 47. India VOC Recovery and Abatement Market Size YoY Growth (2017-2028) & (US$ Million)
- Figure 48. Taiwan VOC Recovery and Abatement Market Size YoY Growth (2017-2028) & (US$ Million)
- Figure 49. Latin America VOC Recovery and Abatement Market Size YoY Growth (2018-2029) & (US$ Million)
- Figure 50. Latin America VOC Recovery and Abatement Market Share by Type (2018-2029)
- Figure 51. Latin America VOC Recovery and Abatement Market Share by Application (2018-2029)
- Figure 52. Latin America VOC Recovery and Abatement Market Share by Region (2018-2029)
- Figure 53. Mexico VOC Recovery and Abatement Market Size YoY Growth (2018-2029) & (US$ Million)
- Figure 54. Brazil VOC Recovery and Abatement Market Size YoY Growth (2018-2029) & (US$ Million)
- Figure 55. Argentina VOC Recovery and Abatement Market Size YoY Growth (2018-2029) & (US$ Million)
- Figure 56. Middle East & Africa VOC Recovery and Abatement Market Size YoY Growth (2018-2029) & (US$ Million)
- Figure 57. Middle East & Africa VOC Recovery and Abatement Market Share by Type (2018-2029)
- Figure 58. Middle East & Africa VOC Recovery and Abatement Market Share by Application (2018-2029)
- Figure 59. Middle East & Africa VOC Recovery and Abatement Market Share by Country (2018-2029)
- Figure 60. Turkey VOC Recovery and Abatement Market Size YoY Growth (2018-2029) & (US$ Million)
- Figure 61. Saudi Arabia VOC Recovery and Abatement Market Size YoY Growth (2018-2029) & (US$ Million)
- Figure 62. UAE VOC Recovery and Abatement Market Size YoY Growth (2018-2029) & (US$ Million)
- Figure 63. Air Products Revenue Growth Rate in VOC Recovery and Abatement Business (2018-2023)
- Figure 64. Linde plc Revenue Growth Rate in VOC Recovery and Abatement Business (2018-2023)
- Figure 65. Wartsila Revenue Growth Rate in VOC Recovery and Abatement Business (2018-2023)
- Figure 66. Munters Revenue Growth Rate in VOC Recovery and Abatement Business (2018-2023)
- Figure 67. TOYOBO Revenue Growth Rate in VOC Recovery and Abatement Business (2018-2023)
- Figure 68. Taikisha Revenue Growth Rate in VOC Recovery and Abatement Business (2018-2023)
- Figure 69. Nippon Gases Revenue Growth Rate in VOC Recovery and Abatement Business (2018-2023)
- Figure 70. Calgon Carbon Corporation Revenue Growth Rate in VOC Recovery and Abatement Business (2018-2023)
- Figure 71. Condorchem Envitech Revenue Growth Rate in VOC Recovery and Abatement Business (2018-2023)
- Figure 72. Conifer Systems Revenue Growth Rate in VOC Recovery and Abatement Business (2018-2023)
- Figure 73. Anguil Revenue Growth Rate in VOC Recovery and Abatement Business (2018-2023)
- Figure 74. ComEnCo Systems Revenue Growth Rate in VOC Recovery and Abatement Business (2018-2023)
- Figure 75. Polaris Revenue Growth Rate in VOC Recovery and Abatement Business (2018-2023)
- Figure 76. Bay Environmental Technology Revenue Growth Rate in VOC Recovery and Abatement Business (2018-2023)
- Figure 77. KVT Process Technology Revenue Growth Rate in VOC Recovery and Abatement Business (2018-2023)
- Figure 78. CECO Environmental Revenue Growth Rate in VOC Recovery and Abatement Business (2018-2023)
- Figure 79. SINOPEC Qingdao Safety Engineering Revenue Growth Rate in VOC Recovery and Abatement Business (2018-2023)
- Figure 80. Naide Revenue Growth Rate in VOC Recovery and Abatement Business (2018-2023)
- Figure 81. ECOTEC Revenue Growth Rate in VOC Recovery and Abatement Business (2018-2023)
- Figure 82. Sinochem Environment Air Pollution Control Revenue Growth Rate in VOC Recovery and Abatement Business (2018-2023)
- Figure 83. WELLE Environmental Group Revenue Growth Rate in VOC Recovery and Abatement Business (2018-2023)
- Figure 84. Bottom-up and Top-down Approaches for This Report
- Figure 85. Data Triangulation
- Figure 86. Key Executives Interviewed
The global VOC Recovery and Abatement market is projected to grow from US$ 13898.74 million in 2023 to US$ 53003.90 million by 2029, at a Compound Annual Growth Rate (CAGR) of 24.99% during the forecast period.
The US & Canada market for VOC Recovery and Abatement is estimated to increase from $ 3003.52 million in 2023 to reach $ 11136.12 million by 2029, at a CAGR of 24.41% during the forecast period of 2024 through 2029.
The Asia-Pacific market for VOC Recovery and Abatement is estimated to increase from $ 7396.91 million in 2023 to reach $ 29093.84 million by 2029, at a CAGR of 25.64% during the forecast period of 2024 through 2029.
The Europe market for VOC Recovery and Abatement is estimated to increase from $ 2197.39 million in 2023 to reach $ 8295.11 million by 2029, at a CAGR of 24.78% during the forecast period of 2024 through 2029.
The global key companies of VOC Recovery and Abatement include: Air Products, Linde plc, Wartsila, Munters, TOYOBO, Taikisha, Nippon Gases, Calgon Carbon Corporation, and Condorchem Envitech, etc. In 2022, the global top five players had a share approximately 33.74% in terms of revenue.
Report Includes:
This report presents an overview of global market for VOC Recovery and Abatement market size. Analyses of the global market trends, with historic market revenue data for 2018 - 2022, estimates for 2023, and projections of CAGR through 2029.
This report researches the key producers of VOC Recovery and Abatement, also provides the revenue of main regions and countries. Highlights of the upcoming market potential for VOC Recovery and Abatement, and key regions/countries of focus to forecast this market into various segments and sub-segments. Country specific data and market value analysis for the U.S., Canada, Mexico, Brazil, China, Japan, South Korea, Southeast Asia, India, Germany, the U.K., Italy, Middle East, Africa, and Other Countries.
This report focuses on the VOC Recovery and Abatementrevenue, market share and industry ranking of main companies, data from 2018 to 2023. Identification of the major stakeholders in the global VOC Recovery and Abatement market, and analysis of their competitive landscape and market positioning based on recent developments and segmental revenues. This report will help stakeholders to understand the competitive landscape and gain more insights and position their businesses and market strategies in a better way.
This report analyzes the segments data by Type and by Application, revenue, and growth rate, from 2018 to 2029. Evaluation and forecast the market size for VOC Recovery and Abatement revenue, projected growth trends, production technology, application and end-user industry.
Descriptive company profiles of the major global players, including Air Products, Linde plc, Wartsila, Munters, TOYOBO, Taikisha, Nippon Gases, Calgon Carbon Corporation, and Condorchem Envitech, etc.
By Company
- Air Products
- Linde plc
- Wartsila
- Munters
- TOYOBO
- Taikisha
- Nippon Gases
- Calgon Carbon Corporation
- Condorchem Envitech
- Conifer Systems
- Anguil
- ComEnCo Systems
- Polaris
- Bay Environmental Technology
- KVT Process Technology
- CECO Environmental
- SINOPEC Qingdao Safety Engineering
- Naide
- ECOTEC
- Sinochem Environment Air Pollution Control
- WELLE Environmental Group
Segment by Type
- Regenerative Thermal Oxidation
- Recuperative Thermal Oxidation
- Catalytic Oxidation
- Adsorption by Activated Carbon
- Cryocondensation
- Others
Segment by Application
- Petroleum and Petrochemical
- Packaging and Printing
- Pharmaceuticals
- Food
- Plastic and Rubber
- Iron and Steel
- Coatings and Inks
- Others
By Region
- North America
- United States
- Canada
- Asia-Pacific
- China
- Japan
- South Korea
- Southeast Asia
- India
- Taiwan
- Rest of Asia
- Europe
- Germany
- France
- U.K.
- Italy
- Spain
- Nordic Countries
- Rest of Europe
- Latin America
- Mexico
- Brazil
- Argentina
- Rest of Latin America
- Middle East & Africa
- Turkey
- Saudi Arabia
- UAE
- Rest of MEA
Chapter Outline
Chapter 1: Introduces the report scope of the report, executive summary of different market segments (product type, application, etc), including the market size of each market segment, future development potential, and so on. It offers a high-level view of the current state of the market and its likely evolution in the short to mid-term, and long term.
Chapter 2: Revenue of VOC Recovery and Abatement in global and regional level. It provides a quantitative analysis of the market size and development potential of each region and its main countries and introduces the market development, future development prospects, market space, and capacity of each country in the world. This section also introduces the market dynamics, latest developments of the market, the driving factors and restrictive factors of the market, the challenges and risks faced by companies in the industry, and the analysis of relevant policies in the industry.
Chapter 3: Detailed analysis of VOC Recovery and Abatement companies's competitive landscape, revenue, market share and industry ranking, latest development plan, merger, and acquisition information, etc.
Chapter 4: Provides the analysis of various market segments by Type, covering the revenue, and development potential of each market segment, to help readers find the blue ocean market in different market segments.
Chapter 5: Provides the analysis of various market segments by Application, covering the revenue, and development potential of each market segment, to help readers find the blue ocean market in different downstream markets.
Chapter 6: North America (US & Canada) by Type, by Application and by country, revenue for each segment.
Chapter 7: Europe by Type, by Application and by country, revenue for each segment.
Chapter 8: China by Type, and by Application, revenue for each segment.
Chapter 9: Asia (excluding China) by Type, by Application and by region, revenue for each segment.
Chapter 10: Middle East & Africa by Type, by Application and by country, revenue for each segment.
Chapter 11: Provides profiles of key companies, introducing the basic situation of the main companies in the market in detail, including product descriptions and specifications, VOC Recovery and Abatementrevenue, gross margin, and recent development, etc.
Chapter 12: Analyst's Viewpoints/Conclusions.
Table of Contents
1 Report Overview
- 1.1 Study Scope
- 1.2 Market Analysis by Type
- 1.2.1 Global VOC Recovery and Abatement Market Size Growth Rate by Type: 2018 VS 2022 VS 2029
- 1.2.2 Regenerative Thermal Oxidation
- 1.2.3 Recuperative Thermal Oxidation
- 1.2.4 Catalytic Oxidation
- 1.2.5 Adsorption by Activated Carbon
- 1.2.6 Cryocondensation
- 1.2.7 Others
- 1.3 Market by Application
- 1.3.1 Global VOC Recovery and Abatement Market Share by Application: 2018 VS 2022 VS 2029
- 1.3.2 Petroleum and Petrochemical
- 1.3.3 Packaging and Printing
- 1.3.4 Pharmaceuticals
- 1.3.5 Food
- 1.3.6 Plastic and Rubber
- 1.3.7 Iron and Steel
- 1.3.8 Coatings and Inks
- 1.4 Assumptions and Limitations
- 1.5 Study Objectives
- 1.6 Years Considered
2 Global Growth Trends
- 2.1 Global VOC Recovery and Abatement Market Perspective (2018-2029)
- 2.2 Global VOC Recovery and Abatement Growth Trends by Region
- 2.2.1 Global VOC Recovery and Abatement Market Size by Region: 2018 VS 2022 VS 2029
- 2.2.2 VOC Recovery and Abatement Historic Market Size by Region (2018-2023)
- 2.2.3 VOC Recovery and Abatement Forecasted Market Size by Region (2024-2029)
- 2.3 VOC Recovery and Abatement Market Dynamics
- 2.3.1 VOC Recovery and Abatement Industry Trends
- 2.3.2 VOC Recovery and Abatement Market Drivers
- 2.3.3 VOC Recovery and Abatement Market Challenges
- 2.3.4 VOC Recovery and Abatement Market Restraints
3 Competition Landscape by Key Players
- 3.1 Global Revenue VOC Recovery and Abatement by Players
- 3.1.1 Global VOC Recovery and Abatement Revenue by Players (2018-2023)
- 3.1.2 Global VOC Recovery and Abatement Revenue Market Share by Players (2018-2023)
- 3.2 Global VOC Recovery and Abatement Market Share by Company Type (Tier 1, Tier 2, and Tier 3)
- 3.3 Global Key Players of VOC Recovery and Abatement, Ranking by Revenue, 2021 VS 2022 VS 2023
- 3.4 Global VOC Recovery and Abatement Market Concentration Ratio
- 3.4.1 Global VOC Recovery and Abatement Market Concentration Ratio (CR5 and HHI)
- 3.4.2 Global Top 5 Companies by VOC Recovery and Abatement Revenue in 2022
- 3.5 Global Key Players of VOC Recovery and Abatement Head office and Area Served
- 3.6 Global Key Players of VOC Recovery and Abatement, Product and Application
- 3.7 Global Key Players of VOC Recovery and Abatement, Date of Enter into This Industry
- 3.8 Mergers & Acquisitions, Expansion Plans
4 VOC Recovery and Abatement Breakdown Data by Type
- 4.1 Global VOC Recovery and Abatement Historic Market Size by Type (2018-2023)
- 4.2 Global VOC Recovery and Abatement Forecasted Market Size by Type (2024-2029)
5 VOC Recovery and Abatement Breakdown Data by Application
- 5.1 Global VOC Recovery and Abatement Historic Market Size by Application (2018-2023)
- 5.2 Global VOC Recovery and Abatement Forecasted Market Size by Application (2024-2029)
6 North America
- 6.1 North America VOC Recovery and Abatement Market Size (2018-2029)
- 6.2 North America VOC Recovery and Abatement Market Size by Type
- 6.2.1 North America VOC Recovery and Abatement Market Size by Type (2018-2023)
- 6.2.2 North America VOC Recovery and Abatement Market Size by Type (2024-2029)
- 6.2.3 North America VOC Recovery and Abatement Market Share by Type (2018-2029)
- 6.3 North America VOC Recovery and Abatement Market Size by Application
- 6.3.1 North America VOC Recovery and Abatement Market Size by Application (2018-2023)
- 6.3.2 North America VOC Recovery and Abatement Market Size by Application (2024-2029)
- 6.3.3 North America VOC Recovery and Abatement Market Share by Application (2018-2029)
- 6.4 North America VOC Recovery and Abatement Market Size by Country
- 6.4.1 North America VOC Recovery and Abatement Market Size by Country: 2018 VS 2022 VS 2029
- 6.4.2 North America VOC Recovery and Abatement Market Size by Country (2018-2023)
- 6.4.3 North America VOC Recovery and Abatement Market Share by Country (2024-2029)
- 6.4.4 United States
- 6.4.5 Canada
7 Europe
- 7.1 Europe VOC Recovery and Abatement Market Size (2018-2029)
- 7.2 Europe VOC Recovery and Abatement Market Size by Type
- 7.2.1 Europe VOC Recovery and Abatement Market Size by Type (2018-2023)
- 7.2.2 Europe VOC Recovery and Abatement Market Size by Type (2024-2029)
- 7.2.3 Europe VOC Recovery and Abatement Market Share by Type (2018-2029)
- 7.3 Europe VOC Recovery and Abatement Market Size by Application
- 7.3.1 Europe VOC Recovery and Abatement Market Size by Application (2018-2023)
- 7.3.2 Europe VOC Recovery and Abatement Market Size by Application (2024-2029)
- 7.3.3 Europe VOC Recovery and Abatement Market Share by Application (2018-2029)
- 7.4 Europe VOC Recovery and Abatement Market Size by Country
- 7.4.1 Europe VOC Recovery and Abatement Market Size by Country: 2018 VS 2022 VS 2029
- 7.4.2 Europe VOC Recovery and Abatement Market Size by Country (2018-2023)
- 7.4.3 Europe VOC Recovery and Abatement Market Size by Country (2024-2029)
- 7.4.4 Germany
- 7.4.5 France
- 7.4.6 U.K.
- 7.4.7 Italy
- 7.4.8 Spain
- 7.4.9 Nordic Countries
8 Asia-Pacific
- 8.1 Asia-Pacific VOC Recovery and Abatement Market Size (2018-2029)
- 8.2 Asia-Pacific VOC Recovery and Abatement Market Size by Type
- 8.2.1 Asia-Pacific VOC Recovery and Abatement Market Size by Type (2018-2023)
- 8.2.2 Asia-Pacific VOC Recovery and Abatement Market Size by Type (2024-2029)
- 8.2.3 Asia-Pacific VOC Recovery and Abatement Market Share by Type (2018-2029)
- 8.3 Asia-Pacific VOC Recovery and Abatement Market Size by Application
- 8.3.1 Asia-Pacific VOC Recovery and Abatement Market Size by Application (2018-2023)
- 8.3.2 Asia-Pacific VOC Recovery and Abatement Market Size by Application (2024-2029)
- 8.3.3 Asia-Pacific VOC Recovery and Abatement Market Share by Application (2018-2029)
- 8.4 Asia-Pacific VOC Recovery and Abatement Market Size by Region
- 8.4.1 Asia-Pacific VOC Recovery and Abatement Market Size by Region (2018-2023)
- 8.4.2 Asia-Pacific VOC Recovery and Abatement Market Size by Region (2023-2028)
- 8.4.3 China
- 8.4.4 Japan
- 8.4.5 South Korea
- 8.4.6 Southeast Asia
- 8.4.7 India
- 8.4.8 Taiwan
9 Latin America
- 9.1 Latin America VOC Recovery and Abatement Market Size (2018-2029)
- 9.2 Latin America VOC Recovery and Abatement Market Size by Type
- 9.2.1 Latin America VOC Recovery and Abatement Market Size by Type (2018-2023)
- 9.2.2 Latin America VOC Recovery and Abatement Market Size by Type (2024-2029)
- 9.2.3 Latin America VOC Recovery and Abatement Market Share by Type (2018-2029)
- 9.3 Latin America VOC Recovery and Abatement Market Size by Application
- 9.3.1 Latin America VOC Recovery and Abatement Market Size by Application (2018-2023)
- 9.3.2 Latin America VOC Recovery and Abatement Market Size by Application (2024-2029)
- 9.3.3 Latin America VOC Recovery and Abatement Market Share by Application (2018-2029)
- 9.4 Latin America VOC Recovery and Abatement Market Size by Region
- 9.4.1 Latin America VOC Recovery and Abatement Market Size by Region: 2018 VS 2022 VS 2029
- 9.4.2 Latin America VOC Recovery and Abatement Market Size by Region (2018-2023)
- 9.4.3 Latin America VOC Recovery and Abatement Market Size by Region (2024-2029)
- 9.4.4 Mexico
- 9.4.5 Brazil
- 9.4.6 Argentina
10 Middle East & Africa
- 10.1 Middle East & Africa VOC Recovery and Abatement Market Size (2018-2029)
- 10.2 Middle East & Africa VOC Recovery and Abatement Market Size by Type
- 10.2.1 Middle East & Africa VOC Recovery and Abatement Market Size by Type (2018-2023)
- 10.2.2 Middle East & Africa VOC Recovery and Abatement Market Size by Type (2024-2029)
- 10.2.3 Middle East & Africa VOC Recovery and Abatement Market Share by Type (2018-2029)
- 10.3 Middle East & Africa VOC Recovery and Abatement Market Size by Application
- 10.3.1 Middle East & Africa VOC Recovery and Abatement Market Size by Application (2018-2023)
- 10.3.2 Middle East & Africa VOC Recovery and Abatement Market Size by Application (2024-2029)
- 10.3.3 Middle East & Africa VOC Recovery and Abatement Market Share by Application (2018-2029)
- 10.4 Middle East & Africa VOC Recovery and Abatement Market Size by Country
- 10.4.1 Middle East & Africa VOC Recovery and Abatement Market Size by Country: 2018 VS 2022 VS 2029
- 10.4.2 Middle East & Africa VOC Recovery and Abatement Market Size by Country (2018-2023)
- 10.4.3 Middle East & Africa VOC Recovery and Abatement Market Size by Country (2024-2029)
- 10.4.4 Turkey
- 10.4.5 Saudi Arabia
- 10.4.6 UAE
11 Key Players Profiles
- 11.1 Air Products
- 11.1.1 Air Products Company Details
- 11.1.2 Air Products Business Overview
- 11.1.3 Air Products VOC Recovery and Abatement Introduction
- 11.1.4 Air Products Revenue in VOC Recovery and Abatement Business (2018-2023)
- 11.2 Linde plc
- 11.2.1 Linde plc Company Details
- 11.2.2 Linde plc Business Overview
- 11.2.3 Linde plc VOC Recovery and Abatement Introduction
- 11.2.4 Linde plc Revenue in VOC Recovery and Abatement Business (2018-2023)
- 11.3 Wartsila
- 11.3.1 Wartsila Company Details
- 11.3.2 Wartsila Business Overview
- 11.3.3 Wartsila VOC Recovery and Abatement Introduction
- 11.3.4 Wartsila Revenue in VOC Recovery and Abatement Business (2018-2023)
- 11.3.5 Wartsila Recent Development
- 11.4 Munters
- 11.4.1 Munters Company Details
- 11.4.2 Munters Business Overview
- 11.4.3 Munters VOC Recovery and Abatement Introduction
- 11.4.4 Munters Revenue in VOC Recovery and Abatement Business (2018-2023)
- 11.5 TOYOBO
- 11.5.1 TOYOBO Company Details
- 11.5.2 TOYOBO Business Overview
- 11.5.3 TOYOBO VOC Recovery and Abatement Introduction
- 11.5.4 TOYOBO Revenue in VOC Recovery and Abatement Business (2018-2023)
- 11.6 Taikisha
- 11.6.1 Taikisha Company Details
- 11.6.2 Taikisha Business Overview
- 11.6.3 Taikisha VOC Recovery and Abatement Introduction
- 11.6.4 Taikisha Revenue in VOC Recovery and Abatement Business (2018-2023)
- 11.7 Nippon Gases
- 11.7.1 Nippon Gases Company Details
- 11.7.2 Nippon Gases Business Overview
- 11.7.3 Nippon Gases VOC Recovery and Abatement Introduction
- 11.7.4 Nippon Gases Revenue in VOC Recovery and Abatement Business (2018-2023)
- 11.8 Calgon Carbon Corporation
- 11.8.1 Calgon Carbon Corporation Company Details
- 11.8.2 Calgon Carbon Corporation Business Overview
- 11.8.3 Calgon Carbon Corporation VOC Recovery and Abatement Introduction
- 11.8.4 Calgon Carbon Corporation Revenue in VOC Recovery and Abatement Business (2018-2023)
- 11.8.5 Calgon Carbon Corporation Recent Development
- 11.9 Condorchem Envitech
- 11.9.1 Condorchem Envitech Company Details
- 11.9.2 Condorchem Envitech Business Overview
- 11.9.3 Condorchem Envitech VOC Recovery and Abatement Introduction
- 11.9.4 Condorchem Envitech Revenue in VOC Recovery and Abatement Business (2018-2023)
- 11.10 Conifer Systems
- 11.10.1 Conifer Systems Company Details
- 11.10.2 Conifer Systems Business Overview
- 11.10.3 Conifer Systems VOC Recovery and Abatement Introduction
- 11.10.4 Conifer Systems Revenue in VOC Recovery and Abatement Business (2018-2023)
- 11.11 Anguil
- 11.11.1 Anguil Company Details
- 11.11.2 Anguil Business Overview
- 11.11.3 Anguil VOC Recovery and Abatement Introduction
- 11.11.4 Anguil Revenue in VOC Recovery and Abatement Business (2018-2023)
- 11.11.5 Anguil Recent Development
- 11.12 ComEnCo Systems
- 11.12.1 ComEnCo Systems Company Details
- 11.12.2 ComEnCo Systems Business Overview
- 11.12.3 ComEnCo Systems VOC Recovery and Abatement Introduction
- 11.12.4 ComEnCo Systems Revenue in VOC Recovery and Abatement Business (2018-2023)
- 11.13 Polaris
- 11.13.1 Polaris Company Details
- 11.13.2 Polaris Business Overview
- 11.13.3 Polaris VOC Recovery and Abatement Introduction
- 11.13.4 Polaris Revenue in VOC Recovery and Abatement Business (2018-2023)
- 11.14 Bay Environmental Technology
- 11.14.1 Bay Environmental Technology Company Details
- 11.14.2 Bay Environmental Technology Business Overview
- 11.14.3 Bay Environmental Technology VOC Recovery and Abatement Introduction
- 11.14.4 Bay Environmental Technology Revenue in VOC Recovery and Abatement Business (2018-2023)
- 11.15 KVT Process Technology
- 11.15.1 KVT Process Technology Company Details
- 11.15.2 KVT Process Technology Business Overview
- 11.15.3 KVT Process Technology VOC Recovery and Abatement Introduction
- 11.15.4 KVT Process Technology Revenue in VOC Recovery and Abatement Business (2018-2023)
- 11.16 CECO Environmental
- 11.16.1 CECO Environmental Company Details
- 11.16.2 CECO Environmental Business Overview
- 11.16.3 CECO Environmental VOC Recovery and Abatement Introduction
- 11.16.4 CECO Environmental Revenue in VOC Recovery and Abatement Business (2018-2023)
- 11.16.5 CECO Environmental Recent Development
- 11.17 SINOPEC Qingdao Safety Engineering
- 11.17.1 SINOPEC Qingdao Safety Engineering Company Details
- 11.17.2 SINOPEC Qingdao Safety Engineering Business Overview
- 11.17.3 SINOPEC Qingdao Safety Engineering VOC Recovery and Abatement Introduction
- 11.17.4 SINOPEC Qingdao Safety Engineering Revenue in VOC Recovery and Abatement Business (2018-2023)
- 11.18 Naide
- 11.18.1 Naide Company Details
- 11.18.2 Naide Business Overview
- 11.18.3 Naide VOC Recovery and Abatement Introduction
- 11.18.4 Naide Revenue in VOC Recovery and Abatement Business (2018-2023)
- 11.19 ECOTEC
- 11.19.1 ECOTEC Company Details
- 11.19.2 ECOTEC Business Overview
- 11.19.3 ECOTEC VOC Recovery and Abatement Introduction
- 11.19.4 ECOTEC Revenue in VOC Recovery and Abatement Business (2018-2023)
- 11.20 Sinochem Environment Air Pollution Control
- 11.20.1 Sinochem Environment Air Pollution Control Company Details
- 11.20.2 Sinochem Environment Air Pollution Control Business Overview
- 11.20.3 Sinochem Environment Air Pollution Control VOC Recovery and Abatement Introduction
- 11.20.4 Sinochem Environment Air Pollution Control Revenue in VOC Recovery and Abatement Business (2018-2023)
- 11.20.5 Sinochem Environment Air Pollution Control Recent Development
- 11.21 WELLE Environmental Group
- 11.21.1 WELLE Environmental Group Company Details
- 11.21.2 WELLE Environmental Group Business Overview
- 11.21.3 WELLE Environmental Group VOC Recovery and Abatement Introduction
- 11.21.4 WELLE Environmental Group Revenue in VOC Recovery and Abatement Business (2018-2023)
- 11.21.5 WELLE Environmental Group Recent Development
12 Analyst's Viewpoints/Conclusions
13 Appendix
- 13.1 Research Methodology
- 13.1.1 Methodology/Research Approach
- 13.1.2 Data Source
- 13.2 Author Details
- 13.3 Disclaimer