|
|
市場調査レポート
商品コード
1184218
アルブチンの世界市場:考察と予測 (2028年まで)Global Arbutin Market Insights, Forecast to 2028 |
||||||
|
|
|||||||
|
● お客様のご希望に応じて、既存データの加工や未掲載情報(例:国別セグメント)の追加などの対応が可能です。 詳細はお問い合わせください。 |
|||||||


| アルブチンの世界市場:考察と予測 (2028年まで) |
|
出版日: 2023年01月13日
発行: QYResearch
ページ情報: 英文 151 Pages
納期: 2~3営業日
|
- 全表示
- 概要
- 図表
- 目次
世界のアルブチンの市場規模は、COVID-19の大流行により、2022年に1億1,791万米ドルに達し、2028年には1億8,012万米ドルに再調整され、予測期間中 (2022年~2028年) に7.32%のCAGRで成長すると予測されています。
当レポートでは、世界のアルブチンの市場について分析し、種類別・用途別・地域別 (国別) の市場動向の見通し (2017年~2028年)、主要企業のプロファイルなどについて調査しております。
目次
第1章 調査範囲
- アルブチン:製品概略
- 種類別の市場
- 市場規模:種類別 (2017年・2021年・2028年)
- ベータアルブチン
- アルファアルブチン
- デオキシアルブチン
- 用途別の市場
- 市場規模:用途別 (2017年・2021年・2028年)
- 化粧品
- 医薬品
- 分析対象
- 分析期間
第2章 世界のアルブチンの生産
- 世界のアルブチンの生産能力 (2017年~2028年)
- 世界のアルブチンの生産:地域別 (2017年・2021年・2028年)
- 世界のアルブチンの生産:地域別
- 過去の生産:地域別 (2017年~2022年)
- 生産の予測:地域別 (2023年~2028年)
- 欧州
- 中国
- 日本
第3章 世界のアルブチンの販売量・販売額:推定・予測
- 世界のアルブチンの販売:推定・予測 (2017年~2028年)
- 世界のアルブチンの収益:推定・予測 (2017年~2028年)
- 世界のアルブチンの収益:地域別 (2017年・2021年・2028年)
- 世界のアルブチンの販売:地域別
- 世界のアルブチンの収益:地域別
- 北米
- 欧州
- アジア太平洋
- 南米
- 中東・アフリカ
第4章 メーカー別の競合
- 世界のアルブチンの生産能力:メーカー別
- 世界のアルブチンの販売:メーカー別
- 世界のアルブチンの収益:メーカー別
- 世界のアルブチンの販売価格:メーカー別 (2017年~2022年)
- 競合情勢の分析
第5章 種類別の市場規模
- 世界のアルブチンの販売:種類別
- 世界のアルブチンの収益:種類別
- 世界のアルブチンの価格:種類別
第6章 用途別の市場規模
- 世界のアルブチンの販売:用途別
- 世界のアルブチンの収益:用途別
- 世界のアルブチンの価格:用途別
第7章 北米
- アルブチンの市場規模:種類別
- アルブチンの市場規模:用途別
- アルブチンの販売:国別
- 米国
- カナダ
第8章 欧州
- アルブチンの市場規模:種類別
- アルブチンの市場規模:用途別
- アルブチンの市場規模:国別
- ドイツ
- フランス
- 英国
- イタリア
- ロシア
第9章 アジア太平洋
- アルブチンの市場規模:種類別
- アルブチンの市場規模:用途別
- アルブチンの市場規模:地域別
- 中国
- 日本
- 韓国
- インド
- 東南アジア
第10章 南米
- アルブチンの市場規模:種類別
- アルブチンの市場規模:用途別
- アルブチンの市場規模:国別
- ブラジル
- アルゼンチン
第11章 中東・アフリカ
- アルブチンの市場規模:種類別
- アルブチンの市場規模:用途別
- アルブチンの市場規模:国別
- 中東
- アフリカ
第12章 企業プロファイル
- DSM
- GfN &Selco
- Mitsubishi Chemical
- ARTEC Biotechology
- Huaheng Biotech
- Chengzhi Life Science
- Beijing Brilliance Biotech
- PLAMED
- Croda International
- Hangzhou Lingeba Technology
- Anhui Tianyin Biotech
- Hyundai Bioland
- Topscience
第13章 産業チェーンと販売チャネルの分析
- アルブチンの産業チェーンの分析
- アルブチンの主要原材料
- アルブチンの製造モードとプロセス
- アルブチンの販売とマーケティング
- アルブチンの顧客
第14章 アルブチンの市場力学
- アルブチン業界の動向
- アルブチン市場の促進要因
- アルブチン市場の課題
第15章 世界のアルブチン市場:主な調査結果
第16章 付録
LIST OF TABLES
- Table 1. Global Arbutin Market Size Growth Rate by Type, 2017 VS 2021 VS 2028 (US$ Million)
- Table 2. Global Arbutin Market Size Growth Rate by Application, 2017 VS 2021 VS 2028 (US$ Million)
- Table 3. Global Arbutin Production by Region: 2017 VS 2021 VS 2028 (MT)
- Table 4. Global Arbutin Production by Region (2017-2022) & (MT)
- Table 5. Global Arbutin Production Market Share by Region (2017-2022)
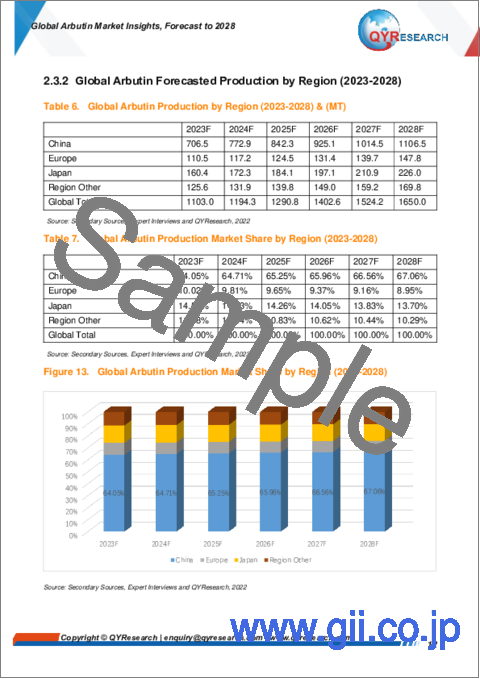
- Table 6. Global Arbutin Production by Region (2023-2028) & (MT)
- Table 7. Global Arbutin Production Market Share by Region (2023-2028)
- Table 8. Global Arbutin Revenue by Region: 2017 VS 2021 VS 2028 (US$ Million)
- Table 9. Global Arbutin Sales by Region (2017-2022) & (MT)
- Table 10. Global Arbutin Sales Market Share by Region (2017-2022)
- Table 11. Global Arbutin Sales by Region (2023-2028) & (MT)
- Table 12. Global Arbutin Sales Market Share by Region (2023-2028)
- Table 13. Global Arbutin Revenue by Region (2017-2022) & (US$ Million)
- Table 14. Global Arbutin Revenue Market Share by Region (2017-2022)
- Table 15. Global Arbutin Revenue by Region (2023-2028) & (US$ Million)
- Table 16. Global Arbutin Revenue Market Share by Region (2023-2028)
- Table 17. Global Arbutin Production Capacity by Manufacturers (2017-2022) & (MT)
- Table 18. Global Arbutin Capacity Market Share by Manufacturers (2017-2022)
- Table 19. Global Arbutin Sales by Manufacturers (2017-2022) & (MT)
- Table 20. Global Arbutin Sales Share by Manufacturers (2017-2022)
- Table 21. Global Arbutin Revenue by Manufacturers (2017-2022) & (US$ Million)
- Table 22. Global Arbutin Revenue Market Share by Manufacturers (2017-2022)
- Table 23. Arbutin Price by Manufacturers (2017-2022) & (USD/Kg)
- Table 24. Global Arbutin Manufacturers Market Concentration Ratio (CR5 and HHI)
- Table 25. Global Arbutin by Company Type (Tier 1, Tier 2, and Tier 3) & (based on the Revenue in Arbutin as of 2020)
- Table 26. Arbutin Manufacturing Base Distribution and Headquarters
- Table 27. Manufacturers Arbutin Product Offered
- Table 28. Global Arbutin Sales by Type (2017-2022) & (MT)
- Table 29. Global Arbutin Sales by Type (2023-2028) & (MT)
- Table 30. Global Arbutin Sales Share by Type (2017-2022)
- Table 31. Global Arbutin Sales Share by Type (2023-2028)
- Table 32. Global Arbutin Revenue by Type (2017-2022) & (US$ Million)
- Table 33. Global Arbutin Revenue by Type (2023-2028) & (US$ Million)
- Table 34. Global Arbutin Revenue Share by Type (2017-2022)
- Table 35. Global Arbutin Revenue Share by Type (2023-2028)
- Table 36. Arbutin Price by Type (2017-2022) & (USD/Kg)
- Table 37. Global Arbutin Price Forecast by Type (2023-2028) & (USD/Kg)
- Table 38. Global Arbutin Sales by Application (2017-2022) & (MT)
- Table 39. Global Arbutin Sales by Application (2023-2028) & (MT)
- Table 40. Global Arbutin Sales Share by Application (2017-2022)
- Table 41. Global Arbutin Sales Share by Application (2023-2028)
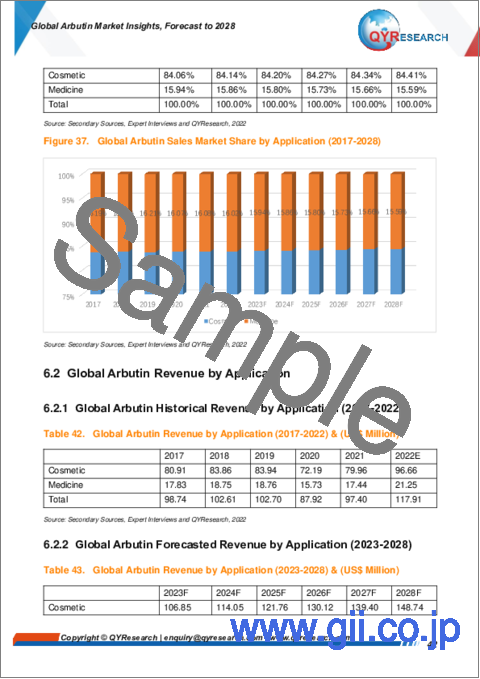
- Table 42. Global Arbutin Revenue by Application (2017-2022) & (US$ Million)
- Table 43. Global Arbutin Revenue by Application (2023-2028) & (US$ Million)
- Table 44. Global Arbutin Revenue Share by Application (2017-2022)
- Table 45. Global Arbutin Revenue Share by Application (2023-2028)
- Table 46. Arbutin Price by Application (2017-2022) & (USD/Kg)
- Table 47. Global Arbutin Price Forecast by Application (2023-2028) & (USD/Kg)
- Table 48. North America Arbutin Sales by Type (2017-2022) & (MT)
- Table 49. North America Arbutin Sales by Type (2023-2028) & (MT)
- Table 50. North America Arbutin Revenue by Type (2017-2022) & (US$ Million)
- Table 51. North America Arbutin Revenue by Type (2023-2028) & (US$ Million)
- Table 52. North America Arbutin Sales by Application (2017-2022) & (MT)
- Table 53. North America Arbutin Sales by Application (2023-2028) & (MT)
- Table 54. North America Arbutin Revenue by Application (2017-2022) & (US$ Million)
- Table 55. North America Arbutin Revenue by Application (2023-2028) & (US$ Million)
- Table 56. North America Arbutin Sales by Country (2017-2022) & (MT)
- Table 57. North America Arbutin Sales by Country (2023-2028) & (MT)
- Table 58. North America Arbutin Revenue by Country (2017-2022) & (US$ Million)
- Table 59. North America Arbutin Revenue by Country (2023-2028) & (US$ Million)
- Table 60. Europe Arbutin Sales by Type (2017-2022) & (MT)
- Table 61. Europe Arbutin Sales by Type (2023-2028) & (MT)
- Table 62. Europe Arbutin Revenue by Type (2017-2022) & (US$ Million)
- Table 63. Europe Arbutin Revenue by Type (2023-2028) & (US$ Million)
- Table 64. Europe Arbutin Sales by Application (2017-2022) & (MT)
- Table 65. Europe Arbutin Sales by Application (2023-2028) & (MT)
- Table 66. Europe Arbutin Revenue by Application (2017-2022) & (US$ Million)
- Table 67. Europe Arbutin Revenue by Application (2023-2028) & (US$ Million)
- Table 68. Europe Arbutin Sales by Country (2017-2022) & (MT)
- Table 69. Europe Arbutin Sales by Country (2023-2028) & (MT)
- Table 70. Europe Arbutin Revenue by Country (2017-2022) & (US$ Million)
- Table 71. Europe Arbutin Revenue by Country (2023-2028) & (US$ Million)
- Table 72. Asia Pacific Arbutin Sales by Type (2017-2022) & (MT)
- Table 73. Asia Pacific Arbutin Sales by Type (2023-2028) & (MT)
- Table 74. Asia Pacific Arbutin Revenue by Type (2017-2022) & (US$ Million)
- Table 75. Asia Pacific Arbutin Revenue by Type (2023-2028) & (US$ Million)
- Table 76. Asia Pacific Arbutin Sales by Application (2017-2022) & (MT)
- Table 77. Asia Pacific Arbutin Sales by Application (2023-2028) & (MT)
- Table 78. Asia Pacific Arbutin Revenue by Application (2017-2022) & (US$ Million)
- Table 79. Asia Pacific Arbutin Revenue by Application (2023-2028) & (US$ Million)
- Table 80. Asia Pacific Arbutin Sales by Region (2017-2022) & (MT)
- Table 81. Asia Pacific Arbutin Sales by Region (2023-2028) & (MT)
- Table 82. Asia Pacific Arbutin Revenue by Region (2017-2022) & (US$ Million)
- Table 83. Asia Pacific Arbutin Revenue by Region (2023-2028) & (US$ Million)
- Table 84. South America Arbutin Sales by Type (2017-2022) & (MT)
- Table 85. South America Arbutin Sales by Type (2023-2028) & (MT)
- Table 86. South America Arbutin Revenue by Type (2017-2022) & (US$ Million)
- Table 87. South America Arbutin Revenue by Type (2023-2028) & (US$ Million)
- Table 88. South America Arbutin Sales by Application (2017-2022) & (MT)
- Table 89. South America Arbutin Sales by Application (2023-2028) & (MT)
- Table 90. South America Arbutin Revenue by Application (2017-2022) & (US$ Million)
- Table 91. South America Arbutin Revenue by Application (2023-2028) & (US$ Million)
- Table 92. South America Arbutin Sales by Country (2017-2022) & (MT)
- Table 93. South America Arbutin Sales by Country (2023-2028) & (MT)
- Table 94. South America Arbutin Revenue by Country (2017-2022) & (US$ Million)
- Table 95. South America Arbutin Revenue by Country (2023-2028) & (US$ Million)
- Table 96. Middle East and Africa Arbutin Sales by Type (2017-2022) & (MT)
- Table 97. Middle East and Africa Arbutin Sales by Type (2023-2028) & (MT)
- Table 98. Middle East and Africa Arbutin Revenue by Type (2017-2022) & (US$ Million)
- Table 99. Middle East and Africa Arbutin Revenue by Type (2023-2028) & (US$ Million)
- Table 100. Middle East and Africa Arbutin Sales by Application (2017-2022) & (MT)
- Table 101. Middle East and Africa Arbutin Sales by Application (2023-2028) & (MT)
- Table 102. Middle East and Africa Arbutin Revenue by Application (2017-2022) & (US$ Million)
- Table 103. Middle East and Africa Arbutin Revenue by Application (2023-2028) & (US$ Million)
- Table 104. Middle East and Africa Arbutin Sales by Country (2017-2022) & (MT)
- Table 105. Middle East and Africa Arbutin Sales by Country (2023-2028) & (MT)
- Table 106. Middle East and Africa Arbutin Revenue by Country (2017-2022) & (US$ Million)
- Table 107. Middle East and Africa Arbutin Revenue by Country (2023-2028) & (US$ Million)
- Table 108. DSM Corporation Information
- Table 109. DSM Description and Major Businesses
- Table 110. DSM Arbutin Sales (MT), Revenue (US$ Million), Price (USD/Kg) and Gross Margin (2017-2022)
- Table 111. DSM Arbutin Product Model Numbers, Pictures, Descriptions and Specifications
- Table 112. DSM Recent Developments
- Table 113. GfN & Selco Corporation Information
- Table 114. GfN & Selco Description and Major Businesses
- Table 115. GfN & Selco Arbutin Sales (MT), Revenue (US$ Million), Price (USD/Kg) and Gross Margin (2017-2022)
- Table 116. GfN & Selco Arbutin Product Model Numbers, Pictures, Descriptions and Specifications
- Table 117. Mitsubishi Chemical Corporation Information
- Table 118. Mitsubishi Chemical Description and Major Businesses
- Table 119. Mitsubishi Chemical Arbutin Sales (MT), Revenue (US$ Million), Price (USD/Kg) and Gross Margin (2017-2022)
- Table 120. Mitsubishi Chemical Arbutin Product Model Numbers, Pictures, Descriptions and Specifications
- Table 121. Mitsubishi Chemical Recent Developments
- Table 122. ARTEC Biotechology Corporation Information
- Table 123. ARTEC Biotechology Description and Major Businesses
- Table 124. ARTEC Biotechology Arbutin Sales (MT), Revenue (US$ Million), Price (USD/Kg) and Gross Margin (2017-2022)
- Table 125. ARTEC Biotechology Arbutin Product Model Numbers, Pictures, Descriptions and Specifications
- Table 126. Huaheng Biotech Corporation Information
- Table 127. Huaheng Biotech Description and Major Businesses
- Table 128. Huaheng Biotech Arbutin Sales (MT), Revenue (US$ Million), Price (USD/Kg) and Gross Margin (2017-2022)
- Table 129. Huaheng Biotech Arbutin Product Model Numbers, Pictures, Descriptions and Specifications
- Table 130. Huaheng Biotech Recent Developments
- Table 131. Chengzhi Life Science Corporation Information
- Table 132. Chengzhi Life Science Description and Major Businesses
- Table 133. Chengzhi Life Science Arbutin Sales (MT), Revenue (US$ Million), Price (USD/Kg) and Gross Margin (2017-2022)
- Table 134. Chengzhi Life Science Arbutin Product Model Numbers, Pictures, Descriptions and Specifications
- Table 135. Beijing Brilliance Biotech Corporation Information
- Table 136. Beijing Brilliance Biotech Description and Major Businesses
- Table 137. Beijing Brilliance Biotech Arbutin Sales (MT), Revenue (US$ Million), Price (USD/Kg) and Gross Margin (2017-2022)
- Table 138. Beijing Brilliance Biotech Arbutin Product Model Numbers, Pictures, Descriptions and Specifications
- Table 139. PLAMED Corporation Information
- Table 140. PLAMED Description and Major Businesses
- Table 141. PLAMED Arbutin Sales (MT), Revenue (US$ Million), Price (USD/Kg) and Gross Margin (2017-2022)
- Table 142. PLAMED Arbutin Product Model Numbers, Pictures, Descriptions and Specifications
- Table 143. Croda International Corporation Information
- Table 144. Croda International Description and Major Businesses
- Table 145. Croda International Arbutin Sales (MT), Revenue (US$ Million), Price (USD/Kg) and Gross Margin (2017-2022)
- Table 146. Croda International Arbutin Product Model Numbers, Pictures, Descriptions and Specifications
- Table 147. Hangzhou Lingeba Technology Corporation Information
- Table 148. Hangzhou Lingeba Technology Description and Major Businesses
- Table 149. Hangzhou Lingeba Technology Arbutin Sales (MT), Revenue (US$ Million), Price (USD/Kg) and Gross Margin (2017-2022)
- Table 150. Hangzhou Lingeba Technology Arbutin Product Model Numbers, Pictures, Descriptions and Specifications
- Table 151. Anhui Tianyin Biotech Corporation Information
- Table 152. Anhui Tianyin Biotech Description and Major Businesses
- Table 153. Anhui Tianyin Biotech Arbutin Sales (MT), Revenue (US$ Million), Price (USD/Kg) and Gross Margin (2017-2022)
- Table 154. Anhui Tianyin Biotech Arbutin Product Model Numbers, Pictures, Descriptions and Specifications
- Table 155. Hyundai Bioland Corporation Information
- Table 156. Hyundai Bioland Description and Major Businesses
- Table 157. Hyundai Bioland Arbutin Sales (MT), Revenue (US$ Million), Price (USD/Kg) and Gross Margin (2017-2022)
- Table 158. Hyundai Bioland Arbutin Product Model Numbers, Pictures, Descriptions and Specifications
- Table 159. Topscience Corporation Information
- Table 160. Topscience Description and Major Businesses
- Table 161. Topscience Arbutin Sales (MT), Revenue (US$ Million), Price (USD/Kg) and Gross Margin (2017-2022)
- Table 162. Topscience Arbutin Product Model Numbers, Pictures, Descriptions and Specifications
- Table 163. Key Raw Materials Lists
- Table 164. Raw Materials Key Suppliers Lists
- Table 165. Arbutin Distributors List
- Table 166. Arbutin Customers List
- Table 167. Arbutin Market Trends
- Table 168. Arbutin Market Drivers
- Table 169. Arbutin Market Challenges
- Table 170. Research Programs/Design for This Report
- Table 171. Key Data Information from Secondary Sources
- Table 172. Key Data Information from Primary Sources
List of Figures
- Figure 1. Arbutin Product Picture
- Figure 2. Global Arbutin Market Share by Type: 2021 & 2028
- Figure 3. 伪-Arbutin Product Picture
- Figure 4. 尾-Arbutin Product Picture
- Figure 5. Deoxyarbutin Product Picture
- Figure 6. Global Arbutin Market Share by Application in 2021 & 2028
- Figure 7. Application in Cosmetic
- Figure 8. Application in Medicine
- Figure 9. Arbutin Report Years Considered
- Figure 10. Global Arbutin Capacity, Production and Utilization (2017-2028) & (MT)
- Figure 11. Global Arbutin Production Market Share by Region in Percentage: 2021 Versus 2028
- Figure 12. Global Arbutin Production Market Share by Region (2017-2022)
- Figure 13. Global Arbutin Production Market Share by Region (2023-2028)
- Figure 14. Arbutin Production Growth Rate in Europe (2017-2028) & (MT)
- Figure 15. Arbutin Production Growth Rate in China (2017-2028) & (MT)
- Figure 16. Arbutin Production Growth Rate in Japan (2017-2028) & (MT)
- Figure 17. Global Arbutin Sales 2017-2028 (MT)
- Figure 18. Global Arbutin Revenue, (US$ Million), 2017 VS 2022 VS 2028
- Figure 19. Global Arbutin Revenue 2017-2028 (US$ Million)
- Figure 20. Global Arbutin Revenue Market Share by Region in Percentage: 2021 Versus 2028
- Figure 21. Global Arbutin Sales Market Share by Region (2017-2022)
- Figure 22. Global Arbutin Sales Market Share by Region (2023-2028)
- Figure 23. North America Arbutin Sales YoY (2017-2028) & (MT)
- Figure 24. North America Arbutin Revenue YoY (2017-2028) & (US$ Million)
- Figure 25. Europe Arbutin Sales YoY (2017-2028) & (MT)
- Figure 26. Europe Arbutin Revenue YoY (2017-2028) & (US$ Million)
- Figure 27. Asia-Pacific Arbutin Sales YoY (2017-2028) & (MT)
- Figure 28. Asia-Pacific Arbutin Revenue YoY (2017-2028) & (US$ Million)
- Figure 29. South America Arbutin Sales YoY (2017-2028) & (MT)
- Figure 30. South America Arbutin Revenue YoY (2017-2028) & (US$ Million)
- Figure 31. Middle East & Africa Arbutin Sales YoY (2017-2028) & (MT)
- Figure 32. Middle East & Africa Arbutin Revenue YoY (2017-2028) & (US$ Million)
- Figure 33. The Arbutin Market Share of Top 10 and Top 5 Largest Manufacturers Around the World in 2021
- Figure 34. The Top 5 and 10 Largest Manufacturers of Arbutin in the World: Market Share by Arbutin Revenue in 2021
- Figure 35. Global Arbutin Sales Market Share by Type (2017-2028)
- Figure 36. Global Arbutin Revenue Market Share by Type (2017-2028)
- Figure 37. Global Arbutin Sales Market Share by Application (2017-2028)
- Figure 38. Global Arbutin Revenue Market Share by Application (2017-2028)
- Figure 39. North America Arbutin Sales Market Share by Type (2017-2028)
- Figure 40. North America Arbutin Revenue Market Share by Type (2017-2028)
- Figure 41. North America Arbutin Sales Market Share by Application (2017-2028)
- Figure 42. North America Arbutin Revenue Market Share by Application (2017-2028)
- Figure 43. North America Arbutin Sales Share by Country (2017-2028)
- Figure 44. North America Arbutin Revenue Share by Country (2017-2028)
- Figure 45. United States Arbutin Revenue (2017-2028) & (US$ Million)
- Figure 46. Canada Arbutin Revenue (2017-2028) & (US$ Million)
- Figure 47. Europe Arbutin Sales Market Share by Type (2017-2028)
- Figure 48. Europe Arbutin Revenue Market Share by Type (2017-2028)
- Figure 49. Europe Arbutin Sales Market Share by Application (2017-2028)
- Figure 50. Europe Arbutin Revenue Market Share by Application (2017-2028)
- Figure 51. Europe Arbutin Sales Share by Country (2017-2028)
- Figure 52. Europe Arbutin Revenue Share by Country (2017-2028)
- Figure 53. Germany Arbutin Revenue (2017-2028) & (US$ Million)
- Figure 54. France Arbutin Revenue (2017-2028) & (US$ Million)
- Figure 55. U.K. Arbutin Revenue (2017-2028) & (US$ Million)
- Figure 56. Italy Arbutin Revenue (2017-2028) & (US$ Million)
- Figure 57. Russia Arbutin Revenue (2017-2028) & (US$ Million)
- Figure 58. Asia Pacific Arbutin Sales Market Share by Type (2017-2028)
- Figure 59. Asia Pacific Arbutin Revenue Market Share by Type (2017-2028)
- Figure 60. Asia Pacific Arbutin Sales Market Share by Application (2017-2028)
- Figure 61. Asia Pacific Arbutin Revenue Market Share by Application (2017-2028)
- Figure 62. Asia Pacific Arbutin Sales Share by Region (2017-2028)
- Figure 63. Asia Pacific Arbutin Revenue Share by Region (2017-2028)
- Figure 64. China Arbutin Revenue (2017-2028) & (US$ Million)
- Figure 65. Japan Arbutin Revenue (2017-2028) & (US$ Million)
- Figure 66. South Korea Arbutin Revenue (2017-2028) & (US$ Million)
- Figure 67. India Arbutin Revenue (2017-2028) & (US$ Million)
- Figure 68. Southeast Asia Arbutin Revenue (2017-2028) & (US$ Million)
- Figure 69. South America Arbutin Sales Market Share by Type (2017-2028)
- Figure 70. South America Arbutin Revenue Market Share by Type (2017-2028)
- Figure 71. South America Arbutin Sales Market Share by Application (2017-2028)
- Figure 72. South America Arbutin Revenue Market Share by Application (2017-2028)
- Figure 73. South America Arbutin Sales Share by Country (2017-2028)
- Figure 74. South America Arbutin Revenue Share by Country (2017-2028)
- Figure 75. Brazil Arbutin Revenue (2017-2028) & (US$ Million)
- Figure 76. Argentina Arbutin Revenue (2017-2028) & (US$ Million)
- Figure 77. Middle East and Africa Arbutin Sales Market Share by Type (2017-2028)
- Figure 78. Middle East and Africa Arbutin Revenue Market Share by Type (2017-2028)
- Figure 79. Middle East and Africa Arbutin Sales Market Share by Application (2017-2028)
- Figure 80. Middle East and Africa Arbutin Revenue Market Share by Application (2017-2028)
- Figure 81. Middle East and Africa Arbutin Sales Share by Country (2017-2028)
- Figure 82. Middle East and Africa Arbutin Revenue Share by Country (2017-2028)
- Figure 83. Middle East Arbutin Revenue (2017-2028) & (US$ Million)
- Figure 84. Africa Arbutin Revenue (2017-2028) & (US$ Million)
- Figure 85. Arbutin Value Chain
- Figure 86. Beta-Arbutin Production Process
- Figure 87. Alpha-Arbutin Production Process
- Figure 88. Distributors Profiles
- Figure 89. Bottom-up and Top-down Approaches for This Report
- Figure 90. Data Triangulation
- Figure 91. Key Executives Interviewed
Market Analysis and Insights:
Due to the COVID-19 pandemic, the global Arbutin market size is estimated to be worth US$ 117.91 million in 2022 and is forecast to a readjusted size of US$ 180.12 million by 2028 with a CAGR of 7.32% during the forecast period 2022-2028.
In terms of production side, this report researches the Arbutin capacity, production, growth rate, market share by manufacturers and by region (region level and country level), from 2017 to 2022, and forecast to 2028.
In terms of sales side, this report focuses on the sales of Arbutin by region (region level and country level), by company, by Type and by Application. from 2017 to 2022 and forecast to 2028.
Scope and Segment:
Arbutin market is segmented by Type, and by Application. Players, stakeholders, and other participants in the global Arbutin market will be able to gain the upper hand as they use the report as a powerful resource. The segmental analysis focuses on production capacity, revenue and forecast by Type, and by Application for the period 2017-2028.
By Company
- DSM
- GfN & Selco
- Mitsubishi Chemical
- ARTEC Biotechology
- Anhui Huaheng Biotech
- Chengzhi Life Science
- Beijing Brilliance Biotech
- PLAMED
- Croda International
- Hangzhou Lingeba Technology
- Anhui Tianyin Biotech
- Hyundai Bioland
- Topscience
Segment by Type
- B-Arbutin
- α-Arbutin
Segment by Application
- Cosmetic
- Medicine
Production by Region
- Europe
- China
- Japan
Sales by Region
- North America
- United States
- Canada
- Mexico
- Asia-Pacific
- China
- Japan
- Korea
- India
- Southeast Asia
- Europe
- Germany
- France
- U.K.
- Italy
- Russia
- South America
- Brazil
- Argentina
- Middle East & Africa
- Middle East
- Africa
Table of Contents
1 Study Coverage
- 1.1 Arbutin Product Introduction
- 1.2 Market by Type
- 1.2.1 Global Arbutin Market Size by Type, 2017 VS 2021 VS 2028
- 1.2.2 B-Arbutin
- 1.2.3 α-Arbutin
- 1.2.4 Deoxyarbutin
- 1.3 Market by Application
- 1.3.1 Global Arbutin Market Size by Application, 2017 VS 2021 VS 2028
- 1.3.2 Cosmetic
- 1.3.3 Medicine
- 1.4 Study Objectives
- 1.5 Years Considered
2 Global Arbutin Production
- 2.1 Global Arbutin Production Capacity (2017-2028)
- 2.2 Global Arbutin Production by Region: 2017 VS 2021 VS 2028
- 2.3 Global Arbutin Production by Region
- 2.3.1 Global Arbutin Historic Production by Region (2017-2022)
- 2.3.2 Global Arbutin Forecasted Production by Region (2023-2028)
- 2.4 Europe
- 2.5 China
- 2.6 Japan
3 Global Arbutin Sales in Volume & Value Estimates and Forecasts
- 3.1 Global Arbutin Sales Estimates and Forecasts 2017-2028
- 3.2 Global Arbutin Revenue Estimates and Forecasts 2017-2028
- 3.3 Global Arbutin Revenue by Region: 2017 VS 2021 VS 2028
- 3.4 Global Top Arbutin Regions by Sales
- 3.4.1 Global Top Arbutin Regions by Sales (2017-2022)
- 3.4.2 Global Top Arbutin Regions by Sales (2023-2028)
- 3.5 Global Top Arbutin Regions by Revenue
- 3.5.1 Global Top Arbutin Regions by Revenue (2017-2022)
- 3.5.2 Global Top Arbutin Regions by Revenue (2023-2028)
- 3.6 North America
- 3.7 Europe
- 3.8 Asia-Pacific
- 3.9 South America
- 3.10 Middle East & Africa
4 Competition by Manufacturers
- 4.1 Global Arbutin Production Capacity by Manufacturers
- 4.2 Global Arbutin Sales by Manufacturers
- 4.2.1 Global Arbutin Sales by Manufacturers (2017-2022)
- 4.2.2 Global Arbutin Sales Market Share by Manufacturers (2017-2022)
- 4.2.3 Global Top 10 and Top 5 Largest Manufacturers of Arbutin in 2021
- 4.3 Global Arbutin Revenue by Manufacturers
- 4.3.1 Global Arbutin Revenue by Manufacturers (2017-2022)
- 4.3.2 Global Arbutin Revenue Market Share by Manufacturers (2017-2022)
- 4.3.3 Global Top 10 and Top 5 Companies by Arbutin Revenue in 2021
- 4.4 Global Arbutin Sales Price by Manufacturers (2017-2022)
- 4.5 Analysis of Competitive Landscape
- 4.5.1 Manufacturers Market Concentration Ratio (CR5 and HHI)
- 4.5.2 Global Arbutin Market Share by Company Type (Tier 1, Tier 2, and Tier 3)
- 4.5.3 Global Arbutin Manufacturers Geographical Distribution
5 Market Size by Type
- 5.1 Global Arbutin Sales by Type
- 5.1.1 Global Arbutin Historical Sales by Type (2017-2022)
- 5.1.2 Global Arbutin Forecasted Sales by Type (2023-2028)
- 5.1.3 Global Arbutin Sales Market Share by Type (2017-2028)
- 5.2 Global Arbutin Revenue by Type
- 5.2.1 Global Arbutin Historical Revenue by Type (2017-2022)
- 5.2.2 Global Arbutin Forecasted Revenue by Type (2023-2028)
- 5.2.3 Global Arbutin Revenue Market Share by Type (2017-2028)
- 5.3 Global Arbutin Price by Type
- 5.3.1 Global Arbutin Price by Type (2017-2022)
- 5.3.2 Global Arbutin Price Forecast by Type (2023-2028)
6 Market Size by Application
- 6.1 Global Arbutin Sales by Application
- 6.1.1 Global Arbutin Historical Sales by Application (2017-2022)
- 6.1.2 Global Arbutin Forecasted Sales by Application (2023-2028)
- 6.1.3 Global Arbutin Sales Market Share by Application (2017-2028)
- 6.2 Global Arbutin Revenue by Application
- 6.2.1 Global Arbutin Historical Revenue by Application (2017-2022)
- 6.2.2 Global Arbutin Forecasted Revenue by Application (2023-2028)
- 6.2.3 Global Arbutin Revenue Market Share by Application (2017-2028)
- 6.3 Global Arbutin Price by Application
- 6.3.1 Global Arbutin Price by Application (2017-2022)
- 6.3.2 Global Arbutin Price Forecast by Application (2023-2028)
7 North America
- 7.1 North America Arbutin Market Size by Type
- 7.1.1 North America Arbutin Sales by Type (2017-2028)
- 7.1.2 North America Arbutin Revenue by Type (2017-2028)
- 7.2 North America Arbutin Market Size by Application
- 7.2.1 North America Arbutin Sales by Application (2017-2028)
- 7.2.2 North America Arbutin Revenue by Application (2017-2028)
- 7.3 North America Arbutin Sales by Country
- 7.3.1 North America Arbutin Sales by Country (2017-2028)
- 7.3.2 North America Arbutin Revenue by Country (2017-2028)
- 7.3.3 United States
- 7.3.4 Canada
8 Europe
- 8.1 Europe Arbutin Market Size by Type
- 8.1.1 Europe Arbutin Sales by Type (2017-2028)
- 8.1.2 Europe Arbutin Revenue by Type (2017-2028)
- 8.2 Europe Arbutin Market Size by Application
- 8.2.1 Europe Arbutin Sales by Application (2017-2028)
- 8.2.2 Europe Arbutin Revenue by Application (2017-2028)
- 8.3 Europe Arbutin Market Size by Country
- 8.3.1 Europe Arbutin Sales by Country (2017-2028)
- 8.3.2 Europe Arbutin Revenue by Country (2017-2028)
- 8.3.3 Germany
- 8.3.4 France
- 8.3.5 U.K.
- 8.3.6 Italy
- 8.3.7 Russia
9 Asia Pacific
- 9.1 Asia Pacific Arbutin Market Size by Type
- 9.1.1 Asia Pacific Arbutin Sales by Type (2017-2028)
- 9.1.2 Asia Pacific Arbutin Revenue by Type (2017-2028)
- 9.2 Asia Pacific Arbutin Market Size by Application
- 9.2.1 Asia Pacific Arbutin Sales by Application (2017-2028)
- 9.2.2 Asia Pacific Arbutin Revenue by Application (2017-2028)
- 9.3 Asia Pacific Arbutin Market Size by Region
- 9.3.1 Asia Pacific Arbutin Sales by Region (2017-2028)
- 9.3.2 Asia Pacific Arbutin Revenue by Region (2017-2028)
- 9.3.3 China
- 9.3.4 Japan
- 9.3.5 South Korea
- 9.3.6 India
- 9.3.7 Southeast Asia
10 South America
- 10.1 South America Arbutin Market Size by Type
- 10.1.1 South America Arbutin Sales by Type (2017-2028)
- 10.1.2 South America Arbutin Revenue by Type (2017-2028)
- 10.2 South America Arbutin Market Size by Application
- 10.2.1 South America Arbutin Sales by Application (2017-2028)
- 10.2.2 South America Arbutin Revenue by Application (2017-2028)
- 10.3 South America Arbutin Market Size by Country
- 10.3.1 South America Arbutin Sales by Country (2017-2028)
- 10.3.2 South America Arbutin Revenue by Country (2017-2028)
- 10.3.3 Brazil
- 10.3.4 Argentina
11 Middle East and Africa
- 11.1 Middle East and Africa Arbutin Market Size by Type
- 11.1.1 Middle East and Africa Arbutin Sales by Type (2017-2028)
- 11.1.2 Middle East and Africa Arbutin Revenue by Type (2017-2028)
- 11.2 Middle East and Africa Arbutin Market Size by Application
- 11.2.1 Middle East and Africa Arbutin Sales by Application (2017-2028)
- 11.2.2 Middle East and Africa Arbutin Revenue by Application (2017-2028)
- 11.3 Middle East and Africa Arbutin Market Size by Country
- 11.3.1 Middle East and Africa Arbutin Sales by Country (2017-2028)
- 11.3.2 Middle East and Africa Arbutin Revenue by Country (2017-2028)
- 11.3.3 Middle East
- 11.3.4 Africa
12 Corporate Profile
- 12.1 DSM
- 12.1.1 DSM Corporation Information
- 12.1.2 DSM Overview
- 12.1.3 DSM Arbutin Sales, Price, Revenue and Gross Margin (2017-2022)
- 12.1.4 DSM Arbutin Product Model Numbers, Pictures, Descriptions and Specifications
- 12.1.5 DSM Recent Developments
- 12.2 GfN & Selco
- 12.2.1 GfN & Selco Corporation Information
- 12.2.2 GfN & Selco Overview
- 12.2.3 GfN & Selco Arbutin Sales, Price, Revenue and Gross Margin (2017-2022)
- 12.2.4 GfN & Selco Arbutin Product Model Numbers, Pictures, Descriptions and Specifications
- 12.3 Mitsubishi Chemical
- 12.3.1 Mitsubishi Chemical Corporation Information
- 12.3.2 Mitsubishi Chemical Overview
- 12.3.3 Mitsubishi Chemical Arbutin Sales, Price, Revenue and Gross Margin (2017-2022)
- 12.3.4 Mitsubishi Chemical Arbutin Product Model Numbers, Pictures, Descriptions and Specifications
- 12.3.5 Mitsubishi Chemical Recent Developments
- 12.4 ARTEC Biotechology
- 12.4.1 ARTEC Biotechology Corporation Information
- 12.4.2 ARTEC Biotechology Overview
- 12.4.3 ARTEC Biotechology Arbutin Sales, Price, Revenue and Gross Margin (2017-2022)
- 12.4.4 ARTEC Biotechology Arbutin Product Model Numbers, Pictures, Descriptions and Specifications
- 12.5 Huaheng Biotech
- 12.5.1 Huaheng Biotech Corporation Information
- 12.5.2 Huaheng Biotech Overview
- 12.5.3 Huaheng Biotech Arbutin Sales, Price, Revenue and Gross Margin (2017-2022)
- 12.5.4 Huaheng Biotech Arbutin Product Model Numbers, Pictures, Descriptions and Specifications
- 12.5.5 Huaheng Biotech Recent Developments
- 12.6 Chengzhi Life Science
- 12.6.1 Chengzhi Life Science Corporation Information
- 12.6.2 Chengzhi Life Science Overview
- 12.6.3 Chengzhi Life Science Arbutin Sales, Price, Revenue and Gross Margin (2017-2022)
- 12.6.4 Chengzhi Life Science Arbutin Product Model Numbers, Pictures, Descriptions and Specifications
- 12.7 Beijing Brilliance Biotech
- 12.7.1 Beijing Brilliance Biotech Corporation Information
- 12.7.2 Beijing Brilliance Biotech Overview
- 12.7.3 Beijing Brilliance Biotech Arbutin Sales, Price, Revenue and Gross Margin (2017-2022)
- 12.7.4 Beijing Brilliance Biotech Arbutin Product Model Numbers, Pictures, Descriptions and Specifications
- 12.8 PLAMED
- 12.8.1 PLAMED Corporation Information
- 12.8.2 PLAMED Overview
- 12.8.3 PLAMED Arbutin Sales, Price, Revenue and Gross Margin (2017-2022)
- 12.8.4 PLAMED Arbutin Product Model Numbers, Pictures, Descriptions and Specifications
- 12.9 Croda International
- 12.9.1 Croda International Corporation Information
- 12.9.2 Croda International Overview
- 12.9.3 Croda International Arbutin Sales, Price, Revenue and Gross Margin (2017-2022)
- 12.9.4 Croda International Arbutin Product Model Numbers, Pictures, Descriptions and Specifications
- 12.10 Hangzhou Lingeba Technology
- 12.10.1 Hangzhou Lingeba Technology Corporation Information
- 12.10.2 Hangzhou Lingeba Technology Overview
- 12.10.3 Hangzhou Lingeba Technology Arbutin Sales, Price, Revenue and Gross Margin (2017-2022)
- 12.10.4 Hangzhou Lingeba Technology Arbutin Product Model Numbers, Pictures, Descriptions and Specifications
- 12.11 Anhui Tianyin Biotech
- 12.11.1 Anhui Tianyin Biotech Corporation Information
- 12.11.2 Anhui Tianyin Biotech Overview
- 12.11.3 Anhui Tianyin Biotech Arbutin Sales, Price, Revenue and Gross Margin (2017-2022)
- 12.11.4 Anhui Tianyin Biotech Arbutin Product Model Numbers, Pictures, Descriptions and Specifications
- 12.12 Hyundai Bioland
- 12.12.1 Hyundai Bioland Corporation Information
- 12.12.2 Hyundai Bioland Overview
- 12.12.3 Hyundai Bioland Arbutin Sales, Price, Revenue and Gross Margin (2017-2022)
- 12.12.4 Hyundai Bioland Arbutin Product Model Numbers, Pictures, Descriptions and Specifications
- 12.13 Topscience
- 12.13.1 Topscience Corporation Information
- 12.13.2 Topscience Overview
- 12.13.3 Topscience Arbutin Sales, Price, Revenue and Gross Margin (2017-2022)
- 12.13.4 Topscience Arbutin Product Model Numbers, Pictures, Descriptions and Specifications
13 Industry Chain and Sales Channels Analysis
- 13.1 Arbutin Industry Chain Analysis
- 13.2 Arbutin Key Raw Materials
- 13.2.1 Key Raw Materials
- 13.2.2 Raw Materials Key Suppliers
- 13.3 Arbutin Production Mode & Process
- 13.4 Arbutin Sales and Marketing
- 13.5 Arbutin Customers
14 Arbutin Market Dynamics
- 14.1.1 Arbutin Industry Trends
- 14.1.2 Arbutin Market Drivers
- 14.1.3 Arbutin Market Challenges
15 Key Findings in the Global Arbutin Study
16 Appendix
- 16.1 Research Methodology
- 16.1.1 Methodology/Research Approach
- 16.1.2 Data Source
- 16.2 Author Details
- 16.3 Disclaimer 130