|
|
市場調査レポート
商品コード
1180579
リチウムイオン電池用電解液の世界市場:2022年Global Lithium-ion Battery Electrolyte Solvent Market Research Report 2022 - Customized Version |
||||||
|
|
|||||||
|
● お客様のご希望に応じて、既存データの加工や未掲載情報(例:国別セグメント)の追加などの対応が可能です。 詳細はお問い合わせください。 |
|||||||


| リチウムイオン電池用電解液の世界市場:2022年 |
|
出版日: 2023年01月06日
発行: QYResearch
ページ情報: 英文 150 Pages
納期: 2~3営業日
|
- 全表示
- 概要
- 図表
- 目次
世界のリチウムイオン電池用電解液の市場規模は、2022年の推定593.73 kMTから、2028年までに1,249.33 kMTに達し、2023年から2028年の間にCAGRで11.97%の成長が予測されています。
なお、市場規模の推定には、COVID-19とロシア・ウクライナ戦争の影響も考慮しています。
北米のリチウムイオン電池用電解液の市場規模は、2022年の1億1,334万米ドルから、2028年までに2億1,561万米ドルに達し、2023年から2028年の予測期間中にCAGRで10.70%の成長が予測されています。
中国のリチウムイオン電池用電解液の市場規模は、2022年の6億8,252万米ドルから、2028年までに14億7,574万米ドルに達し、2023年から2028年までの予測期間中にCAGRで12.15%の成長が予測されています。
世界のリチウムイオン電池用電解液の主要メーカーは、BASF、Mitsubishi、Ube Industries、FUJIFILM、Wako Pure Chemical Corporation、TOAGOSEI、Huntsman、Fushun Dongke Fine Chemical、Haike Group、Shandong Shida Shenghuaなどです。2022年、世界の上位ベンダー5社が収益の約75.25%を占めています。
世界のリチウムイオン電池用電解液市場の電気モビリティ/自動車セグメントは、2022年の193.29 kMTから、2028年までに486.69 kMTまで増加し、2023年から2028年の予測期間中にCAGRで14.89%の成長が予測されています。
目次
第1章 リチウムイオン電池用電解液の市場概要
- リチウムイオン電池用電解液の製品概要と範囲
- リチウムイオン電池用電解液のセグメント:タイプ別
- 世界のリチウムイオン電池用電解液の市場規模の成長率分析:タイプ別(2022年、2028年)
- 炭酸エチレン(EC)
- 炭酸ジエチル(DEC)
- 炭酸ジメチル(DMC)
- 炭酸エチルメチル(EMC)
- 炭酸プロピレン(PC)
- その他
- リチウムイオン電池用電解液のセグメント:用途別
- 世界のリチウムイオン電池用電解液の市場規模の成長率分析:用途別(2022年、2028年)
- 電源バックアップ/UPS
- コンシューマーエレクトロニクス
- 電気モビリティ/自動車
- エネルギー貯蔵システム
- その他
- 世界の市場成長の見通し
第2章 市場競合:メーカー別
- 世界のリチウムイオン電池用電解液の生産の市場シェア:メーカー別(2017年~2022年)
- 世界のリチウムイオン電池用電解液の収益の市場シェア:メーカー別(2017年~2022年)
- リチウムイオン電池用電解液の市場シェア:企業タイプ別(ティア1、ティア2、ティア3)
- 世界のリチウムイオン電池用電解液の平均価格:メーカー別(2017年~2022年)
- リチウムイオン電池用電解液メーカーの生産拠点、提供エリア、製品タイプ
- リチウムイオン電池用電解液市場の競合状況と動向
第3章 リチウムイオン電池用電解液メーカー
- 炭酸エチレン(EC)電解質メーカー(2021年)
- 炭酸ジエチル(DEC)電解質メーカー(2021年)
- 炭酸ジメチル(DMC)電解質メーカー(2021年)
- 炭酸エチルメチル(EMC)電解質メーカー(2021年)
- 炭酸プロピレン(PC)電解質メーカー(2021年)
- リチウムイオン電池用電解液の顧客
第4章 世界の生産:地域別
- 世界の炭酸エチレン(EC)の生産:地域別
- 世界の炭酸ジエチル(DEC)の生産:地域別
- 世界の炭酸ジメチル(DMC)の生産:地域別
- 世界の炭酸エチルメチル(EMC)の生産:地域別
- 世界の炭酸プロピレン(PC)の生産:地域別
第5章 世界の販売:地域別(タイプ別)
- 世界の炭酸エチレン(EC)の販売:地域別
- 世界の炭酸ジエチル(DEC)の販売:地域別
- 世界の炭酸ジメチル(DMC)の販売:地域別
- 世界の炭酸エチルメチル(EMC)の販売:地域別
- 世界の炭酸プロピレン(PC)の販売:地域別
第6章 世界のリチウムイオン電池用電解液の需要(販売):地域別
- 世界のリチウムイオン電池用電解液の需要の推定と予測:地域別(2017年、2022年、2028年)
- 北米のリチウムイオン電池用電解液の推定と予測(2017年~2028年)
- 欧州のリチウムイオン電池用電解液の推定と予測(2017年~2028年)
- 中国のリチウムイオン電池用電解液の推定と予測(2017年~2028年)
- 日本のリチウムイオン電池用電解液の推定と予測(2017年~2028年)
- 韓国のリチウムイオン電池用電解液の推定と予測(2017年~2028年)
第7章 セグメント:タイプ別
- 世界のリチウムイオン電池用電解液の生産の市場シェア:タイプ別(2017年~2022年)
- 世界のリチウムイオン電池用電解液の収益の市場シェア:タイプ別(2017年~2022年)
- 世界のリチウムイオン電池用電解液の価格:タイプ別(2017年~2022年)
第8章 セグメント:用途別
- 世界のリチウムイオン電池用電解液の販売市場:用途別(2017年~2022年)
- 世界のリチウムイオン電池用電解液の販売の市場シェア:用途別(2017年~2022年)
第9章 主要企業プロファイル
- Shida Shenghua
- Haike Group
- UBE Corporation
- Mitsubishi
- Huntsman
- Wako
- Dongke Fine Chemical
- TOAGOSEI
- BASF
- Yingkou Hengyang
- Jintai Chemical
第10章 リチウムイオン電池用電解液の製造コスト分析
- リチウムイオン電池用電解液の主要原材料分析
- 製造コスト構造の割合
- リチウムイオン電池用電解液の製造プロセス分析
- リチウムイオン電池用電解液の業界チェーン分析
第11章 マーケティングチャネル・ディストリビューター・顧客
- マーケティングチャネル
- リチウムイオン電池用電解液のディストリビューターリスト
第12章 リチウムイオン電池用電解液の市場力学
- リチウムイオン電池用電解液の業界動向
- リチウムイオン電池用電解液の市場促進要因
- リチウムイオン電池用電解液の市場課題
- ポーターのファイブフォース分析
第13章 予測:タイプ別・用途別
- 世界の生産・収益・価格予測:タイプ別(2023年~2028年)
- 世界の販売予測:用途別(2023年~2028年)
第14章 調査結果と結論
第15章 調査手法とデータソース
LIST OF TABLES
- Table 1. Global Lithium-ion Battery Electrolyte Solvent Market Size by Type (Tons) & (US$ Million) & (2022 VS 2028)
- Table 2. Global Lithium-ion Battery Electrolyte Solvent Sales by Application (k MT) & (2022 VS 2028)
- Table 3. Global Lithium-ion Battery Electrolyte Solvent Production by Manufacturers (2017-2022) & (k MT)
- Table 4. Global Lithium-ion Battery Electrolyte Solvent Production Market Share by Manufacturers (2017-2022)
- Table 5. Global Lithium-ion Battery Electrolyte Solvent Revenue by Manufacturers (2017-2022) & (US$ Million)
- Table 6. Global Lithium-ion Battery Electrolyte Solvent Revenue Share by Manufacturers (2017-2022)
- Table 7. Company Type (Tier 1, Tier 2, and Tier 3) & (based on the Revenue in Lithium-ion Battery Electrolyte Solvent as of 2021)
- Table 8. Global Market Lithium-ion Battery Electrolyte Solvent Average Price (USD/MT) of Key Manufacturers (2017-2022)
- Table 9. Manufacturers Lithium-ion Battery Electrolyte Solvent Production Sites and Area Served
- Table 10. Manufacturers Lithium-ion Battery Electrolyte Solvent Product Type
- Table 11. Global Lithium-ion Battery Electrolyte Solvent Manufacturers Market Concentration Ratio (CR5)
- Table 12. Ethylene Carbonate (EC) Production Comparison by Region: 2017 VS 2022 VS 2028 (k MT)
- Table 13. Diethyl Carbonate (DEC) Production Comparison by Region: 2017 VS 2022 VS 2028 (k MT)
- Table 14. Dimethyl Carbonate (DMC) Production Comparison by Region: 2017 VS 2022 VS 2028 (k MT)
- Table 15. Ethyl Methyl Carbonate (EMC) Production Comparison by Region: 2017 VS 2022 VS 2028 (k MT)
- Table 16. Propylene Carbonate (PC) Production Comparison by Region: 2017 VS 2022 VS 2028 (k MT)
- Table 17. Ethylene Carbonate (EC) Sales Comparison by Region: 2017 VS 2022 VS 2028 (k MT)
- Table 18. Diethyl Carbonate (DEC) Sales Comparison by Region: 2017 VS 2022 VS 2028 (k MT)
- Table 19. Dimethyl Carbonate (DMC) Sales Comparison by Region: 2017 VS 2022 VS 2028 (k MT)
- Table 20. Ethyl Methyl Carbonate (EMC) Sales Comparison by Region: 2017 VS 2022 VS 2028 (k MT)
- Table 21. Propylene Carbonate (PC) Sales Comparison by Region: 2017 VS 2022 VS 2028 (k MT)
- Table 22. Lithium-ion Battery Electrolyte Solvent Demand Comparison by Region: 2017 VS 2022 VS 2028 (k MT)
- Table 23. Global Lithium-ion Battery Electrolyte Solvent Production (k MT) by Type (2017-2022)
- Table 24. Global Lithium-ion Battery Electrolyte Solvent Production Market Share by Type (2017-2022)
- Table 25. Global Lithium-ion Battery Electrolyte Solvent Revenue (US$ Million) by Type (2017-2022)
- Table 26. Global Lithium-ion Battery Electrolyte Solvent Revenue Share by Type (2017-2022)
- Table 27. Global Lithium-ion Battery Electrolyte Solvent Price (USD/MT) by Type (2017-2022)
- Table 28. Global Lithium-ion Battery Electrolyte Solvent Sales (k MT) by Application (2017-2022)
- Table 29. Global Lithium-ion Battery Electrolyte Solvent Sales Market Share by Application (2017-2022)
- Table 30. Shida Shenghua Lithium-ion Battery Electrolyte Solvent Corporation Information
- Table 31. Shida Shenghua Lithium-ion Battery Electrolyte Solvent Specification and Application
- Table 32. Shida Shenghua Lithium-ion Battery Electrolyte Solvent Revenue (US$ Million), Price (US$/Ton) and Gross Margin (2017-2022)
- Table 33. Haike Group Lithium-ion Battery Electrolyte Solvent Corporation Information
- Table 34. Haike Group Lithium-ion Battery Electrolyte Solvent Specification and Application
- Table 35. Haike Group Lithium-ion Battery Electrolyte Solvent Revenue (US$ Million), Price (US$/Ton) and Gross Margin (2017-2022)
- Table 36. UBE Corporation Lithium-ion Battery Electrolyte Solvent Corporation Information
- Table 37. UBE Corporation Lithium-ion Battery Electrolyte Solvent Specification and Application
- Table 38. UBE Corporation Lithium-ion Battery Electrolyte Solvent Revenue (US$ Million), Price (US$/Ton) and Gross Margin (2017-2022)
- Table 39. Mitsubishi Lithium-ion Battery Electrolyte Solvent Corporation Information
- Table 40. Mitsubishi Lithium-ion Battery Electrolyte Solvent Specification and Application
- Table 41. Mitsubishi Lithium-ion Battery Electrolyte Solvent Revenue (US$ Million), Price (US$/Ton) and Gross Margin (2017-2022)
- Table 42. Huntsman Lithium-ion Battery Electrolyte Solvent Corporation Information
- Table 43. Huntsman Lithium-ion Battery Electrolyte Solvent Specification and Application
- Table 44. Huntsman Lithium-ion Battery Electrolyte Solvent Revenue (US$ Million), Price (US$/Ton) and Gross Margin (2017-2022)
- Table 45. Wako Lithium-ion Battery Electrolyte Solvent Corporation Information
- Table 46. Wako Lithium-ion Battery Electrolyte Solvent Specification and Application
- Table 47. Wako Lithium-ion Battery Electrolyte Solvent Revenue (US$ Million), Price (US$/Ton) and Gross Margin (2017-2022)
- Table 48. Dongke Fine Chemical Lithium-ion Battery Electrolyte Solvent Corporation Information
- Table 49. Dongke Fine Chemical Lithium-ion Battery Electrolyte Solvent Specification and Application
- Table 50. Dongke Fine Chemical Lithium-ion Battery Electrolyte Solvent Revenue (US$ Million), Price (US$/Ton) and Gross Margin (2017-2022)
- Table 51. TOAGOSEI Lithium-ion Battery Electrolyte Solvent Corporation Information
- Table 52. TOAGOSEI Lithium-ion Battery Electrolyte Solvent Specification and Application
- Table 53. TOAGOSEI Lithium-ion Battery Electrolyte Solvent Revenue (US$ Million), Price (US$/Ton) and Gross Margin (2017-2022)
- Table 54. BASF Lithium-ion Battery Electrolyte Solvent Corporation Information
- Table 55. BASF Lithium-ion Battery Electrolyte Solvent Specification and Application
- Table 56. BASF Lithium-ion Battery Electrolyte Solvent Revenue (US$ Million), Price (US$/Ton) and Gross Margin (2017-2022)
- Table 57. Yingkou Hengyang Lithium-ion Battery Electrolyte Solvent Corporation Information
- Table 58. Yingkou Hengyang Lithium-ion Battery Electrolyte Solvent Specification and Application
- Table 59. Yingkou Hengyang Lithium-ion Battery Electrolyte Solvent Revenue (US$ Million), Price (US$/Ton) and Gross Margin (2017-2022)
- Table 60. Jintai Chemical Lithium-ion Battery Electrolyte Solvent Corporation Information
- Table 61. Jintai Chemical Lithium-ion Battery Electrolyte Solvent Specification and Application
- Table 62. Jintai Chemical Lithium-ion Battery Electrolyte Solvent Revenue (US$ Million), Price (US$/Ton) and Gross Margin (2017-2022)
- Table 63. Production Base and Market Concentration Rate of Raw Material
- Table 64. Key Suppliers of Raw Materials
- Table 65. Lithium-ion Battery Electrolyte Solvent Market Trends
- Table 66. Lithium-ion Battery Electrolyte Solvent Market Drivers
- Table 67. Lithium-ion Battery Electrolyte Solvent Market Challenges
- Table 68. Global Lithium-ion Battery Electrolyte Solvent Production Forecast by Type (2023-2028) & (k MT)
- Table 69. Global Lithium-ion Battery Electrolyte Solvent Revenue Forecast by Type (2023-2028) & (US$ Million)
- Table 70. Global Lithium-ion Battery Electrolyte Solvent Price Forecast by Type (2023-2028) & (USD/MT)
- Table 71. Global Lithium-ion Battery Electrolyte Solvent Sales Forecast by Application (2023-2028) & (k MT)
- Table 72. Research Programs/Design for This Report
- Table 73. Key Data Information from Secondary Sources
- Table 74. Key Data Information from Primary Sources
List of Figures
- Figure 1. Product Picture of Lithium-ion Battery Electrolyte Solvent
- Figure 2. Global Lithium-ion Battery Electrolyte Solvent Market Share by Type: 2022 VS 2028
- Figure 3. Ethylene Carbonate (EC) Product Picture
- Figure 4. Diethyl Carbonate (DEC) Product Picture
- Figure 5. Dimethyl Carbonate (DMC) Product Picture
- Figure 6. Ethyl Methyl Carbonate (EMC) Product Picture
- Figure 7. Propylene Carbonate (PC) Product Picture
- Figure 8. Global Lithium-ion Battery Electrolyte Solvent Market Share by Application: 2022 VS 2028
- Figure 9. Power Backups/UPS
- Figure 10. Consumer Electronic
- Figure 11. Electric Mobility/Vehicles
- Figure 12. Energy Storage Systems
- Figure 13. Global Lithium-ion Battery Electrolyte Solvent Revenue (US$ Million), 2017 VS 2022 VS 2028
- Figure 14. Global Lithium-ion Battery Electrolyte Solvent Revenue (US$ Million) (2017-2028)
- Figure 15. Global Lithium-ion Battery Electrolyte Solvent Production (k MT) & (2017-2028)
- Figure 16. Lithium-ion Battery Electrolyte Solvent Production Share by Manufacturers in 2021
- Figure 17. Global Lithium-ion Battery Electrolyte Solvent Revenue Share by Manufacturers in 2021
- Figure 18. The Global 5 and 10 Largest Players: Market Share by Lithium-ion Battery Electrolyte Solvent Revenue in 2021
- Figure 19. North America Ethylene Carbonate (EC) Production (k MT) Growth Rate (2017-2028)
- Figure 20. Europe Ethylene Carbonate (EC) Production (k MT) Growth Rate (2017-2028)
- Figure 21. China Ethylene Carbonate (EC) Production (k MT) Growth Rate (2017-2028)
- Figure 22. Japan Ethylene Carbonate (EC) Production (k MT) Growth Rate (2017-2028)
- Figure 23. South Korea Ethylene Carbonate (EC) Production (k MT) Growth Rate (2017-2028)
- Figure 24. North America Diethyl Carbonate (DEC) Production (k MT) Growth Rate (2017-2028)
- Figure 25. Europe Diethyl Carbonate (DEC) Production (k MT) Growth Rate (2017-2028)
- Figure 26. China Diethyl Carbonate (DEC) Production (k MT) Growth Rate (2017-2028)
- Figure 27. Japan Diethyl Carbonate (DEC) Production (k MT) Growth Rate (2017-2028)
- Figure 28. South Korea Diethyl Carbonate (DEC) Production (k MT) Growth Rate (2017-2028)
- Figure 29. North America Dimethyl Carbonate (DMC) Production (k MT) Growth Rate (2017-2028)
- Figure 30. Europe Dimethyl Carbonate (DMC) Production (k MT) Growth Rate (2017-2028)
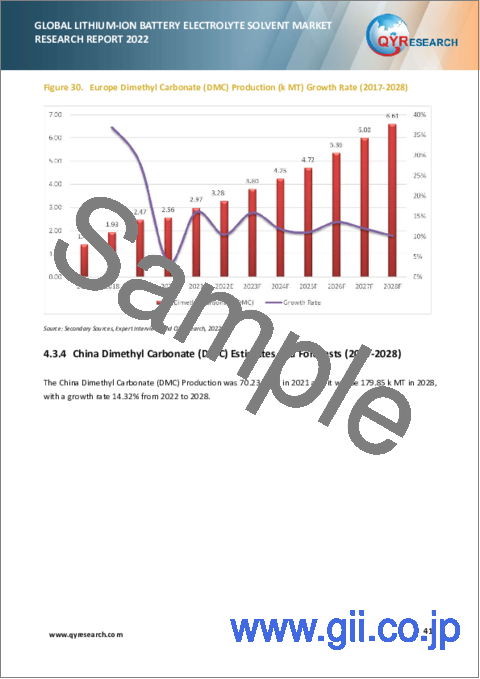
- Figure 31. China Dimethyl Carbonate (DMC) Production (k MT) Growth Rate (2017-2028)
- Figure 32. Japan Dimethyl Carbonate (DMC) Production (k MT) Growth Rate (2017-2028)
- Figure 33. South Korea Dimethyl Carbonate (DMC) Production (k MT) Growth Rate (2017-2028)
- Figure 34. North America Ethyl Methyl Carbonate (EMC) Production (k MT) Growth Rate (2017-2028)
- Figure 35. Europe Ethyl Methyl Carbonate (EMC) Revenue (k MT) Growth Rate (2017-2028)
- Figure 36. China Ethyl Methyl Carbonate (EMC) Production (k MT) Growth Rate (2017-2028)
- Figure 37. Japan Ethyl Methyl Carbonate (EMC) Production (k MT) Growth Rate (2017-2028)
- Figure 38. South Korea Ethyl Methyl Carbonate (EMC) Production (k MT) Growth Rate (2017-2028)
- Figure 39. North America Propylene Carbonate (PC) Production (k MT) Growth Rate (2017-2028)
- Figure 40. Europe Propylene Carbonate (PC) Production (k MT) Growth Rate (2017-2028)
- Figure 41. China Propylene Carbonate (PC) Production (k MT) Growth Rate (2017-2028)
- Figure 42. Japan Propylene Carbonate (PC) Production (k MT) Growth Rate (2017-2028)
- Figure 43. South Korea Propylene Carbonate (PC) Production (k MT) Growth Rate (2017-2028)
- Figure 44. North America Ethylene Carbonate (EC) Sales (k MT) Growth Rate (2017-2028)
- Figure 45. Europe Ethylene Carbonate (EC) Sales (k MT) Growth Rate (2017-2028)
- Figure 46. China Ethylene Carbonate (EC) Sales (k MT) Growth Rate (2017-2028)
- Figure 47. Japan Ethylene Carbonate (EC) Sales (k MT) Growth Rate (2017-2028)
- Figure 48. South Korea Ethylene Carbonate (EC) Sales (k MT) Growth Rate (2017-2028)
- Figure 49. North America Diethyl Carbonate (DEC) Sales (k MT) Growth Rate (2017-2028)
- Figure 50. Europe Diethyl Carbonate (DEC) Sales (k MT) Growth Rate (2017-2028)
- Figure 51. China Diethyl Carbonate (DEC) Sales (k MT) Growth Rate (2017-2028)
- Figure 52. Japan Diethyl Carbonate (DEC) Sales (k MT) Growth Rate (2017-2028)
- Figure 53. South Korea Diethyl Carbonate (DEC) Sales (k MT) Growth Rate (2017-2028)
- Figure 54. North America Dimethyl Carbonate (DMC) Sales (k MT) Growth Rate (2017-2028)
- Figure 55. Europe Dimethyl Carbonate (DMC) Sales (k MT) Growth Rate (2017-2028)
- Figure 56. China Dimethyl Carbonate (DMC) Sales (k MT) Growth Rate (2017-2028)
- Figure 57. Japan Dimethyl Carbonate (DMC) Sales (k MT) Growth Rate (2017-2028)
- Figure 58. South Korea Dimethyl Carbonate (DMC) Sales (k MT) Growth Rate (2017-2028)
- Figure 59. North America Ethyl Methyl Carbonate (EMC) Sales (k MT) Growth Rate (2017-2028)
- Figure 60. Europe Ethyl Methyl Carbonate (EMC) Revenue (k MT) Growth Rate (2017-2028)
- Figure 61. China Ethyl Methyl Carbonate (EMC) Sales (k MT) Growth Rate (2017-2028)
- Figure 62. Japan Ethyl Methyl Carbonate (EMC) Sales (k MT) Growth Rate (2017-2028)
- Figure 63. South Korea Ethyl Methyl Carbonate (EMC) Sales (k MT) Growth Rate (2017-2028)
- Figure 64. North America Propylene Carbonate (PC) Sales (k MT) Growth Rate (2017-2028)
- Figure 65. Europe Propylene Carbonate (PC) Sales (k MT) Growth Rate (2017-2028)
- Figure 66. China Propylene Carbonate (PC) Sales (k MT) Growth Rate (2017-2028)
- Figure 67. Japan Propylene Carbonate (PC) Sales (k MT) Growth Rate (2017-2028)
- Figure 68. South Korea Propylene Carbonate (PC) Sales (k MT) Growth Rate (2017-2028)
- Figure 69. North America Lithium-ion Battery Electrolyte Solvent Demand (k MT) Growth Rate (2017-2028)
- Figure 70. Europe Lithium-ion Battery Electrolyte Solvent Demand (k MT) Growth Rate (2017-2028)
- Figure 71. China Lithium-ion Battery Electrolyte Solvent Demand (k MT) Growth Rate (2017-2028)
- Figure 72. Japan Lithium-ion Battery Electrolyte Solvent Demand (k MT) Growth Rate (2017-2028)
- Figure 73. South Korea Lithium-ion Battery Electrolyte Solvent Demand (k MT) Growth Rate (2017-2028)
- Figure 74. Production Market Share of Lithium-ion Battery Electrolyte Solvent by Type (2017-2022)
- Figure 75. Production Market Share of Lithium-ion Battery Electrolyte Solvent by Type in 2021
- Figure 76. Revenue Share of Lithium-ion Battery Electrolyte Solvent by Type (2017-2022)
- Figure 77. Revenue Market Share of Lithium-ion Battery Electrolyte Solvent by Type in 2021
- Figure 78. Sales Market Share of Lithium-ion Battery Electrolyte Solvent by Application (2017-2022)
- Figure 79. Sales Market Share of Lithium-ion Battery Electrolyte Solvent by Application in 2021
- Figure 80. Manufacturing Cost Structure of Lithium-ion Battery Electrolyte Solvent
- Figure 81. Manufacturing Process Analysis of Lithium-ion Battery Electrolyte Solvent
- Figure 82. Lithium-ion Battery Electrolyte Solvent Industrial Chain Analysis
- Figure 83. Channels of Distribution
- Figure 84. Distributors Profiles
- Figure 85. Porter's Five Forces Analysis
- Figure 86. Global Lithium-ion Battery Electrolyte Solvent Production Market Share Forecast by Type (2023-2028)
- Figure 87. Global Lithium-ion Battery Electrolyte Solvent Revenue Market Share Forecast by Type (2023-2028)
- Figure 88. Global Lithium-ion Battery Electrolyte Solvent Sales Market Share Forecast by Application (2023-2028)
- Figure 89. Bottom-up and Top-down Approaches for This Report
- Figure 90. Data Triangulation
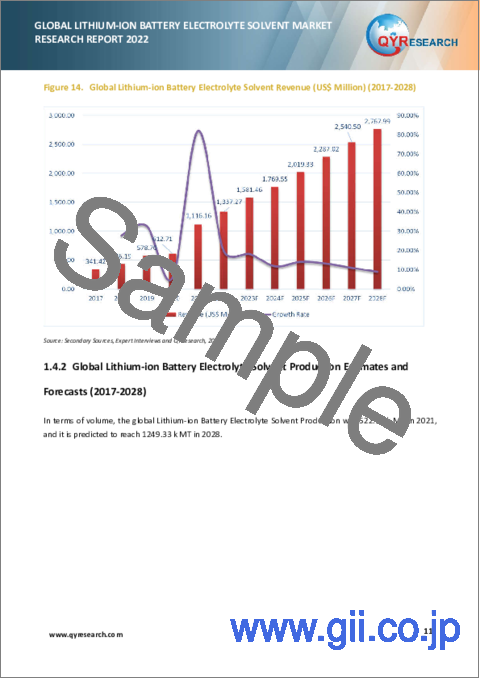
The global Lithium-ion Battery Electrolyte Solvent market is projected to reach 1,249.33 k MT by 2028 from an estimated 593.73 k MT in 2022, at a CAGR of 11.97% during 2023 and 2028. The influence of COVID-19 and the Russia-Ukraine War were considered while estimating market sizes.
North American market for Lithium-ion Battery Electrolyte Solvent is estimated to increase from $ 113.34 million in 2022 to reach $ 215.61 million by 2028, at a CAGR of 10.70% during the forecast period of 2023 through 2028.
China market for Lithium-ion Battery Electrolyte Solvent is estimated to increase from $ 682.52 million in 2022 to reach $ 1475.74 million by 2028, at a CAGR of 12.15% during the forecast period of 2023 through 2028.
The major global manufacturers of Lithium-ion Battery Electrolyte Solvent include BASF, Mitsubishi, Ube Industries, FUJIFILM Wako Pure Chemical Corporation, TOAGOSEI, Huntsman, Fushun Dongke Fine Chemical, Haike Group, and Shandong Shida Shenghua, etc. In 2022, the world's top five vendors accounted for approximately 75.25% of the revenue.
The global market for Lithium-ion Battery Electrolyte Solvent in Electric Mobility/Vehicles is estimated to increase from 193.29 k MT in 2022 to 486.69 k MT by 2028, at a CAGR of 14.89% during the forecast period of 2023 through 2028.
Report Scope
This report aims to provide a comprehensive presentation of the global market for Lithium-ion Battery Electrolyte Solvent, with both quantitative and qualitative analysis, to help readers develop business/growth strategies, assess the market competitive situation, analyze their position in the current marketplace, and make informed business decisions regarding Lithium-ion Battery Electrolyte Solvent.
The Lithium-ion Battery Electrolyte Solvent market size, estimations, and forecasts are provided in terms of output/shipments (k MT) and revenue ($ millions), considering 2021 as the base year, with history and forecast data for the period from 2017 to 2028. This report segments the global Lithium-ion Battery Electrolyte Solvent market comprehensively. Regional market sizes, concerning products by Type, by Application, and by players, are also provided.
For a more in-depth understanding of the market, the report provides profiles of the competitive landscape, key competitors, and their respective market ranks. The report also discusses technological trends and new product developments.
The report will help the Lithium-ion Battery Electrolyte Solvent manufacturers, new entrants, and industry chain related companies in this market with information on the revenues, production, and average price for the overall market and the sub-segments across the different segments, by company, by Type, by Application, and by regions.
Segment by Type
- Ethylene Carbonate (EC)
- Diethyl Carbonate (DEC)
- Dimethyl Carbonate (DMC)
- Ethyl Methyl Carbonate (EMC)
- Propylene Carbonate (PC)
- Others
Segment by Application
- Power Backups/UPS
- Consumer Electronic
- Electric Mobility/Vehicles
- Energy Storage Systems
- Others
By Company
- Shida Shenghua
- Haike Group
- UBE Corporation
- Mitsubishi
- Huntsman
- Wako
- Dongke Fine Chemical
- TOAGOSEI
- BASF
- Yingkou Hengyang
- Jintai Chemical
Production by Region
- North America
- Europe
- China
- Japan
- South Korea
Consumption by Region
- North America
- Europe
- China
- Japan
- South Korea
Core Chapters
- Chapter 1: Introduces the report scope of the report, executive summary of different market segments (by region, by Type, by Application, etc), including the market size of each market segment, future development potential, and so on. It offers a high-level view of the current state of the market and its likely evolution in the short to mid-term, and long term.
- Chapter 2: Detailed analysis of Lithium-ion Battery Electrolyte Solvent manufacturers competitive landscape, price, output and revenue market share, latest development plan, merger, and acquisition information, etc.
- Chapter 3: Production/output, value of Lithium-ion Battery Electrolyte Solvent by region/country. It provides a quantitative analysis of the market size and development potential of each region in the next six years.
- Chapter 4: Consumption of Lithium-ion Battery Electrolyte Solvent in regional level and country level. It provides a quantitative analysis of the market size and development potential of each region and its main countries and introduces the market development, future development prospects, market space, and capacity of each country in the world.
- Chapter 5: Provides the analysis of various market segments by Type, covering the market size and development potential of each market segment, to help readers find the blue ocean market in different market segments.
- Chapter 6: Provides the analysis of various market segments by Application, covering the market size and development potential of each market segment, to help readers find the blue ocean market in different downstream markets.
- Chapter 7: Provides profiles of key players, introducing the basic situation of the main companies in the market in detail, including product production/output, revenue, price, gross margin, product introduction, recent development, etc.
- Chapter 8: Analysis of industrial chain, including the upstream and downstream of the industry.
- Chapter 9: Analysis of sales channel, distributors and customers
- Chapter 10: Introduces the market dynamics, latest developments of the market, the driving factors and restrictive factors of the market, the challenges and risks faced by manufacturers in the industry, and the analysis of relevant policies in the industry.
- Chapter 11: Production and supply forecast, global and regional
- Chapter 12: Consumption and demand forecast, global and regional
- Chapter 13: Forecast by Type and by Application. It provides a quantitative analysis of the market size and development potential of each market segment in the next six years.
- Chapter 14: The main points and conclusions of the report.
TABLE OF CONTENTS
1 Lithium-ion Battery Electrolyte Solvent Market Overview
- 1.1 Product Overview and Scope of Lithium-ion Battery Electrolyte Solvent
- 1.2 Lithium-ion Battery Electrolyte Solvent Segment by Type
- 1.2.1 Global Lithium-ion Battery Electrolyte Solvent Market Size Growth Rate Analysis by Type: 2022 VS 2028
- 1.2.2 Ethylene Carbonate (EC)
- 1.2.3 Diethyl Carbonate (DEC)
- 1.2.4 Dimethyl Carbonate (DMC)
- 1.2.5 Ethyl Methyl Carbonate (EMC)
- 1.2.6 Propylene Carbonate (PC)
- 1.2.7 Others
- 1.3 Lithium-ion Battery Electrolyte Solvent Segment by Application
- 1.3.1 Global Lithium-ion Battery Electrolyte Solvent Market Size Growth Rate Analysis by Application: 2022 VS 2028
- 1.3.2 Power Backups/UPS
- 1.3.3 Consumer Electronic
- 1.3.4 Electric Mobility/Vehicles
- 1.3.5 Energy Storage Systems
- 1.3.6 Others
- 1.4 Global Market Growth Prospects
- 1.4.1 Global Lithium-ion Battery Electrolyte Solvent Revenue Estimates and Forecasts (2017-2028)
- 1.4.2 Global Lithium-ion Battery Electrolyte Solvent Production Estimates and Forecasts (2017-2028)
2 Market Competition by Manufacturers
- 2.1 Global Lithium-ion Battery Electrolyte Solvent Production Market Share by Manufacturers (2017-2022)
- 2.2 Global Lithium-ion Battery Electrolyte Solvent Revenue Market Share by Manufacturers (2017-2022)
- 2.3 Lithium-ion Battery Electrolyte Solvent Market Share by Company Type (Tier 1, Tier 2, and Tier 3)
- 2.4 Global Lithium-ion Battery Electrolyte Solvent Average Price by Manufacturers (2017-2022)
- 2.5 Manufacturers Lithium-ion Battery Electrolyte Solvent Production Sites, Area Served, Product Type
- 2.6 Lithium-ion Battery Electrolyte Solvent Market Competitive Situation and Trends
- 2.6.1 Lithium-ion Battery Electrolyte Solvent Market Concentration Rate
- 2.6.2 Global 5 and 10 Largest Lithium-ion Battery Electrolyte Solvent Players Market Share by Revenue
3 Lithium-ion Battery Electrolyte Solvent Manufacturers
- 3.1 Ethylene Carbonate (EC) Electrolyte Manufacturer (2021)
- 3.2 Diethyl Carbonate (DEC) Electrolyte Manufacturer (2021)
- 3.3 Dimethyl Carbonate (DMC) Electrolyte Manufacturer (2021)
- 3.4 Ethyl Methyl Carbonate (EMC) Electrolyte Manufacturer (2021)
- 3.5 Propylene Carbonate (PC) Electrolyte Manufacturer (2021)
- 3.6 Lithium-ion Battery Electrolyte Solvent Customers
- 3.6.1 Ethylene Carbonate (EC) Electrolyte Customers (2021)
- 3.6.2 Diethyl Carbonate (DEC) Electrolyte Customers (2021)
- 3.6.3 Dimethyl Carbonate (DMC) Electrolyte Customers (2021)
- 3.6.4 Ethyl Methyl Carbonate (EMC) Electrolyte Customers (2021)
- 3.6.5 Propylene Carbonate (PC) Electrolyte Customers (2021)
- 3.6.6 Electrolyte Solvent Customers Merge and Plans to Expansion
- 3.6.7 Electrolyte Solvent Manufacturer Merge and Plans to Expansion
4 Global Production by Region
- 4.1 Global Ethylene Carbonate (EC) Production by Region
- 4.1.1 Global Ethylene Carbonate (EC) Production Estimates and Forecasts by Region: 2017 VS 2022 VS 2028
- 4.1.2 North America Ethylene Carbonate (EC) Estimates and Forecasts (2017-2028)
- 4.1.3 Europe Ethylene Carbonate (EC) Estimates and Forecasts (2017-2028)
- 4.1.4 China Ethylene Carbonate (EC) Estimates and Forecasts (2017-2028)
- 4.1.5 Japan Ethylene Carbonate (EC) Estimates and Forecasts (2017-2028)
- 4.1.6 South Korea Ethylene Carbonate (EC) Estimates and Forecasts (2017-2028)
- 4.2 Global Diethyl Carbonate (DEC) Production by Region
- 4.2.1 Global Diethyl Carbonate (DEC) Production Estimates and Forecasts by Region: 2017 VS 2022 VS 2028
- 4.2.2 North America Diethyl Carbonate (DEC) Estimates and Forecasts (2017-2028)
- 4.2.3 Europe Diethyl Carbonate (DEC) Estimates and Forecasts (2017-2028)
- 4.2.4 China Diethyl Carbonate (DEC) Estimates and Forecasts (2017-2028)
- 4.2.5 Japan Diethyl Carbonate (DEC) Estimates and Forecasts (2017-2028)
- 4.2.6 South Korea Diethyl Carbonate (DEC) Estimates and Forecasts (2017-2028)
- 4.3 Global Dimethyl Carbonate (DMC) Production by Region
- 4.3.1 Global Dimethyl Carbonate (DMC) Production Estimates and Forecasts by Region: 2017 VS 2022 VS 2028
- 4.3.2 North America Dimethyl Carbonate (DMC) Estimates and Forecasts (2017-2028)
- 4.3.3 Europe Dimethyl Carbonate (DMC) Estimates and Forecasts (2017-2028)
- 4.3.4 China Dimethyl Carbonate (DMC) Estimates and Forecasts (2017-2028)
- 4.3.5 Japan Dimethyl Carbonate (DMC) Estimates and Forecasts (2017-2028)
- 4.3.6 South Korea Dimethyl Carbonate (DMC) Estimates and Forecasts (2017-2028)
- 4.4 Global Ethyl Methyl Carbonate (EMC) Production by Region
- 4.4.1 Global Ethyl Methyl Carbonate (EMC) Production Estimates and Forecasts by Region: 2017 VS 2022 VS 2028
- 4.4.2 North America Ethyl Methyl Carbonate (EMC) Estimates and Forecasts (2017-2028)
- 4.4.3 Europe Ethyl Methyl Carbonate (EMC) Estimates and Forecasts (2017-2028)
- 4.4.4 China Ethyl Methyl Carbonate (EMC) Estimates and Forecasts (2017-2028)
- 4.4.5 Japan Ethyl Methyl Carbonate (EMC) Estimates and Forecasts (2017-2028)
- 4.4.6 South Korea Ethyl Methyl Carbonate (EMC) Estimates and Forecasts (2017-2028)
- 4.5 Global Propylene Carbonate (PC) Production by Region
- 4.5.1 Global Propylene Carbonate (PC) Production Estimates and Forecasts by Region: 2017 VS 2022 VS 2028
- 4.5.2 North America Propylene Carbonate (PC) Estimates and Forecasts (2017-2028)
- 4.5.3 Europe Propylene Carbonate (PC) Estimates and Forecasts (2017-2028)
- 4.5.4 China Propylene Carbonate (PC) Estimates and Forecasts (2017-2028)
- 4.5.5 Japan Propylene Carbonate (PC) Estimates and Forecasts (2017-2028)
- 4.5.6 South Korea Propylene Carbonate (PC) Estimates and Forecasts (2017-2028)
5 Global Sales by Region (by Type)
- 5.1 Global Ethylene Carbonate (EC) Sales by Region
- 5.1.1 Global Ethylene Carbonate (EC) Sales Estimates and Forecasts by Region: 2017 VS 2022 VS 2028
- 5.1.2 North America Ethylene Carbonate (EC) Estimates and Forecasts (2017-2028)
- 5.1.3 Europe Ethylene Carbonate (EC) Estimates and Forecasts (2017-2028)
- 5.1.4 China Ethylene Carbonate (EC) Estimates and Forecasts (2017-2028)
- 5.1.5 Japan Ethylene Carbonate (EC) Estimates and Forecasts (2017-2028)
- 5.1.6 South Korea Ethylene Carbonate (EC) Estimates and Forecasts (2017-2028)
- 5.2 Global Diethyl Carbonate (DEC) Sales by Region
- 5.2.1 Global Diethyl Carbonate (DEC) Sales Estimates and Forecasts by Region: 2017 VS 2022 VS 2028
- 5.2.2 North America Diethyl Carbonate (DEC) Estimates and Forecasts (2017-2028)
- 5.2.3 Europe Diethyl Carbonate (DEC) Estimates and Forecasts (2017-2028)
- 5.2.4 China Diethyl Carbonate (DEC) Estimates and Forecasts (2017-2028)
- 5.2.5 Japan Diethyl Carbonate (DEC) Estimates and Forecasts (2017-2028)
- 5.2.6 South Korea Diethyl Carbonate (DEC) Estimates and Forecasts (2017-2028)
- 5.3 Global Dimethyl Carbonate (DMC) Sales by Region
- 5.3.1 Global Dimethyl Carbonate (DMC) Sales Estimates and Forecasts by Region: 2017 VS 2022 VS 2028
- 5.3.2 North America Dimethyl Carbonate (DMC) Estimates and Forecasts (2017-2028)
- 5.3.3 Europe Dimethyl Carbonate (DMC) Estimates and Forecasts (2017-2028)
- 5.3.4 China Dimethyl Carbonate (DMC) Estimates and Forecasts (2017-2028)
- 5.3.5 Japan Dimethyl Carbonate (DMC) Estimates and Forecasts (2017-2028)
- 5.3.6 South Korea Dimethyl Carbonate (DMC) Estimates and Forecasts (2017-2028)
- 5.4 Global Ethyl Methyl Carbonate (EMC) Sales by Region
- 5.4.1 Global Ethyl Methyl Carbonate (EMC) Sales Estimates and Forecasts by Region: 2017 VS 2022 VS 2028
- 5.4.2 North America Ethyl Methyl Carbonate (EMC) Estimates and Forecasts (2017-2028)
- 5.4.3 Europe Ethyl Methyl Carbonate (EMC) Estimates and Forecasts (2017-2028)
- 5.4.4 China Ethyl Methyl Carbonate (EMC) Estimates and Forecasts (2017-2028)
- 5.4.5 Japan Ethyl Methyl Carbonate (EMC) Estimates and Forecasts (2017-2028)
- 5.4.6 South Korea Ethyl Methyl Carbonate (EMC) Estimates and Forecasts (2017-2028)
- 5.5 Global Propylene Carbonate (PC) Sales by Region
- 5.5.1 Global Propylene Carbonate (PC) Sales Estimates and Forecasts by Region: 2017 VS 2022 VS 2028
- 5.5.2 North America Propylene Carbonate (PC) Estimates and Forecasts (2017-2028)
- 5.5.3 Europe Propylene Carbonate (PC) Estimates and Forecasts (2017-2028)
- 5.5.4 China Propylene Carbonate (PC) Estimates and Forecasts (2017-2028)
- 5.5.5 Japan Propylene Carbonate (PC) Estimates and Forecasts (2017-2028)
- 5.5.6 South Korea Propylene Carbonate (PC) Estimates and Forecasts (2017-2028)
6 Global Lithium-ion Battery Electrolyte Solvent Demand (Sales) by Region
- 6.1 Global Lithium-ion Battery Electrolyte Solvent Demand Estimates and Forecasts by Region: 2017 VS 2022 VS 2028
- 6.2 North America Lithium-ion Battery Electrolyte Solvent Estimates and Forecasts (2017-2028)
- 6.3 Europe Lithium-ion Battery Electrolyte Solvent Estimates and Forecasts (2017-2028)
- 6.4 China Lithium-ion Battery Electrolyte Solvent Estimates and Forecasts (2017-2028)
- 6.5 Japan Lithium-ion Battery Electrolyte Solvent Estimates and Forecasts (2017-2028)
- 6.6 South Korea Ethylene Carbonate (EC) Estimates and Forecasts (2017-2028)
7 Segment by Type
- 7.1 Global Lithium-ion Battery Electrolyte Solvent Production Market Share by Type (2017-2022)
- 7.2 Global Lithium-ion Battery Electrolyte Solvent Revenue Market Share by Type (2017-2022)
- 7.3 Global Lithium-ion Battery Electrolyte Solvent Price by Type (2017-2022)
8 Segment by Application
- 8.1 Global Lithium-ion Battery Electrolyte Solvent Sales Market by Application (2017-2022)
- 8.2 Global Lithium-ion Battery Electrolyte Solvent Sales Market Share by Application (2017-2022)
9 Key Companies Profiled
- 9.1 Shida Shenghua
- 9.1.1 Shida Shenghua Lithium-ion Battery Electrolyte Solvent Corporation Information
- 9.1.2 Shida Shenghua Lithium-ion Battery Electrolyte Solvent Product Portfolio
- 9.1.3 Shida Shenghua Lithium-ion Battery Electrolyte Solvent Revenue, Price and Gross Margin (2017-2022)
- 9.1.4 Shida Shenghua Main Business and Markets Served
- 9.2 Haike Group
- 9.2.1 Haike Group Lithium-ion Battery Electrolyte Solvent Corporation Information
- 9.2.2 Haike Group Lithium-ion Battery Electrolyte Solvent Product Portfolio
- 9.2.3 Haike Group Lithium-ion Battery Electrolyte Solvent Revenue, Price and Gross Margin (2017-2022)
- 9.2.4 Haike Group Main Business and Markets Served
- 9.3 UBE Corporation
- 9.3.1 UBE Corporation Lithium-ion Battery Electrolyte Solvent Corporation Information
- 9.3.2 UBE Corporation Lithium-ion Battery Electrolyte Solvent Product Portfolio
- 9.3.3 UBE Corporation Lithium-ion Battery Electrolyte Solvent Revenue, Price and Gross Margin (2017-2022)
- 9.3.4 UBE Corporation Main Business and Markets Served
- 9.4 Mitsubishi
- 9.4.1 Mitsubishi Lithium-ion Battery Electrolyte Solvent Corporation Information
- 9.4.2 Mitsubishi Lithium-ion Battery Electrolyte Solvent Product Portfolio
- 9.4.3 Mitsubishi Lithium-ion Battery Electrolyte Solvent Revenue, Price and Gross Margin (2017-2022)
- 9.4.4 Mitsubishi Main Business and Markets Served
- 9.5 Huntsman
- 9.5.1 Huntsman Lithium-ion Battery Electrolyte Solvent Corporation Information
- 9.5.2 Huntsman Lithium-ion Battery Electrolyte Solvent Product Portfolio
- 9.5.3 Huntsman Lithium-ion Battery Electrolyte Solvent Revenue, Price and Gross Margin (2017-2022)
- 9.5.4 Huntsman Main Business and Markets Served
- 9.6 Wako
- 9.6.1 Wako Lithium-ion Battery Electrolyte Solvent Corporation Information
- 9.6.2 Wako Lithium-ion Battery Electrolyte Solvent Product Portfolio
- 9.6.3 Wako Lithium-ion Battery Electrolyte Solvent Revenue, Price and Gross Margin (2017-2022)
- 9.6.4 Wako Main Business and Markets Served
- 9.7 Dongke Fine Chemical
- 9.7.1 Dongke Fine Chemical Lithium-ion Battery Electrolyte Solvent Corporation Information
- 9.7.2 Dongke Fine Chemical Lithium-ion Battery Electrolyte Solvent Product Portfolio
- 9.7.3 Dongke Fine Chemical Lithium-ion Battery Electrolyte Solvent Revenue, Price and Gross Margin (2017-2022)
- 9.7.4 Dongke Fine Chemical Main Business and Markets Served
- 9.8 TOAGOSEI
- 9.8.1 TOAGOSEI Lithium-ion Battery Electrolyte Solvent Corporation Information
- 9.8.2 TOAGOSEI Lithium-ion Battery Electrolyte Solvent Product Portfolio
- 9.8.3 TOAGOSEI Lithium-ion Battery Electrolyte Solvent Revenue, Price and Gross Margin (2017-2022)
- 9.8.4 TOAGOSEI Main Business and Markets Served
- 9.9 BASF
- 9.9.1 BASF Lithium-ion Battery Electrolyte Solvent Corporation Information
- 9.9.2 BASF Lithium-ion Battery Electrolyte Solvent Product Portfolio
- 9.9.3 BASF Lithium-ion Battery Electrolyte Solvent Revenue, Price and Gross Margin (2017-2022)
- 9.9.4 BASF Main Business and Markets Served
- 9.10 Yingkou Hengyang
- 9.10.1 Yingkou Hengyang Lithium-ion Battery Electrolyte Solvent Corporation Information
- 9.10.2 Yingkou Hengyang Lithium-ion Battery Electrolyte Solvent Product Portfolio
- 9.10.3 Yingkou Hengyang Lithium-ion Battery Electrolyte Solvent Revenue, Price and Gross Margin (2017-2022)
- 9.10.4 Yingkou Hengyang Main Business and Markets Served
- 9.11 Jintai Chemical
- 9.11.1 Jintai Chemical Lithium-ion Battery Electrolyte Solvent Corporation Information
- 9.11.2 Jintai Chemical Lithium-ion Battery Electrolyte Solvent Product Portfolio
- 9.11.3 Jintai Chemical Lithium-ion Battery Electrolyte Solvent Revenue, Price and Gross Margin (2017-2022)
- 9.11.4 Jintai Chemical Main Business and Markets Served
10 Lithium-ion Battery Electrolyte Solvent Manufacturing Cost Analysis
- 10.1 Lithium-ion Battery Electrolyte Solvent Key Raw Materials Analysis
- 10.1.1 Key Raw Materials
- 10.1.2 Key Suppliers of Raw Materials
- 10.2 Proportion of Manufacturing Cost Structure
- 10.3 Manufacturing Process Analysis of Lithium-ion Battery Electrolyte Solvent
- 10.4 Lithium-ion Battery Electrolyte Solvent Industrial Chain Analysis
11 Marketing Channel, Distributors and Customers
- 11.1 Marketing Channel
- 11.2 Lithium-ion Battery Electrolyte Solvent Distributors List
12 Lithium-ion Battery Electrolyte Solvent Market Dynamics
- 12.1 Lithium-ion Battery Electrolyte Solvent Industry Trends
- 12.2 Lithium-ion Battery Electrolyte Solvent Market Drivers
- 12.3 Lithium-ion Battery Electrolyte Solvent Market Challenges
- 12.4 Porter's Five Forces Analysis
13 Forecast by Type and by Application
- 13.1 Global Production, Revenue and Price Forecast by Type (2023-2028)
- 13.1.1 Global Forecasted Production of Lithium-ion Battery Electrolyte Solvent by Type (2023-2028)
- 13.1.2 Global Forecasted Revenue of Lithium-ion Battery Electrolyte Solvent by Type (2023-2028)
- 13.1.3 Global Forecasted Price of Lithium-ion Battery Electrolyte Solvent by Type (2023-2028)
- 13.2 Global Sales Forecast by Application (2023-2028)
- 13.2.1 Global Forecasted Sales of Lithium-ion Battery Electrolyte Solvent by Application (2023-2028)
- 13.2.2 Global Forecasted Sales Market Share of Lithium-ion Battery Electrolyte Solvent by Application (2023-2028)
14 Research Findings and Conclusion
15 Methodology and Data Source
- 15.1 Methodology/Research Approach
- 15.1.1 Research Programs/Design
- 15.1.2 Market Size Estimation
- 15.1.3 Market Breakdown and Data Triangulation
- 15.2 Data Source
- 15.2.1 Secondary Sources
- 15.2.2 Primary Sources
- 15.3 Author List
- 15.4 Disclaimer