|
|
市場調査レポート
商品コード
1151757
世界の生分解性高吸水性材料産業の分析:成長動向と競合分析 (2022年~2028年)Global Biodegradable Superabsorbent Materials Industry Research Report, Growth Trends and Competitive Analysis 2022-2028 |
||||||
|
|
|||||||
|
● お客様のご希望に応じて、既存データの加工や未掲載情報(例:国別セグメント)の追加などの対応が可能です。 詳細はお問い合わせください。 |
|||||||


| 世界の生分解性高吸水性材料産業の分析:成長動向と競合分析 (2022年~2028年) |
|
出版日: 2022年11月11日
発行: QYResearch
ページ情報: 英文 150 Pages
納期: 2~3営業日
|
- 全表示
- 概要
- 図表
- 目次
COVID-19の大流行により、世界の生分解性高吸水性材料の市場規模は、2021年に7,221万米ドル、2028年には1億6,182万米ドルに再調整規模に達し、予測期間中 (2022年~2028年) には11.51%のCAGRで成長すると予測されています。
この健康危機による経済変化を十分に考慮し、2021年に世界市場の42.28%を占めるバイオバランス高吸水性ポリマーは、2028年までに6,049万米ドルの規模に達し、2022年から2028年まで改訂9.63%のCAGRで成長すると予測されています。個人衛生分野は、この予測期間を通して11.77%のCAGRに変更されます。
2021年の米国の生分解性高吸水性材料の市場規模は、2021年に1,422万米ドル、中国は200万米ドルでした。また、2021年の米国の割合は19.69%、中国の割合は2.77%でした。欧州の生分解性高吸水性材料の情勢としては、ドイツが2028年までに2,419万米ドルの規模に達すると予測されています。また、アジアでは、注目すべき市場は日本と韓国で、今後6年間のCAGRはそれぞれ8.33%と7.47%です。
当レポートでは、世界の生分解性高吸水性材料市場について分析し、種類別・用途別・地域別 (国別) の市場動向の見通し (2017年~2028年)、主要企業のプロファイルなどについて調査しております。
目次
第1章 分析概要
- 分析範囲
- 種類別の市場区分
- 市場規模・成長率:種類別 (2017年・2021年・2028年)
- バイオバランス高吸水性ポリマー
- 生分解性高吸水性ポリマー
- 用途別の市場区分
- 市場シェア:用途別 (2017年・2021年・2028年)
- 個人衛生
- 農業
- 医療
- その他
- 分析対象
- 分析期間
第2章 市場の展望
- 世界の生分解性高吸水性材料の市場規模 (2017年~2028年)
- 世界の生分解性高吸水性材料の収益 (2017年~2028年)
- 世界の生分解性高吸水性材料の販売 (2017年~2028年)
- 主要地域の生分解性高吸水性材料の市場規模 (2017年・2021年・2028年)
- 世界の生分解性高吸水性材料の販売:地域別 (2017年~2022年)
- 世界の生分解性高吸水性材料の収益:地域別 (2017年~2022年)
- 世界の生分解性高吸水性材料の市場規模、予測値:地域別
- 世界の生分解性高吸水性材料の売上予測:地域別 (2023年~2028年)
- 世界の生分解性高吸水性材料の収益予測:地域別 (2023年~2028年)
- 世界の生分解性高吸水性材料市場:主要地域 (主要国) のランキング
- 生分解性高吸水性材料の市場力学
- 生分解性高吸水性材料業界の動向
- 生分解性高吸水性材料市場の促進要因
- 生分解性高吸水性材料市場の課題
- 生分解性高吸水性材料市場の抑制要因
第3章 メーカー別の競合情勢
- 世界の生分解性高吸水性材料の大手メーカーの販売 (2017年~2022年)
- 世界の生分解性高吸水性材料の大手メーカーの収益
- 世界の大手メーカー:企業の種類別 (ティア1、ティア2、ティア3) (収益ベース、2021年)
- 平均販売価格 (ASP):メーカー別
- 主要メーカーの製造拠点・提供エリア
- 主要メーカーの設立時期
- 主要メーカーの主力製品
- 近年の開発上の進歩
第4章 生分解性高吸水性材料の市場規模:種類別
- 過去の市場動向:種類別 (2017年~2022年)
- 世界の生分解性高吸水性材料の販売・市場シェア:種類別 (2017年~2022年)
- 世界の生分解性高吸水性材料の収益・市場シェア:種類別 (2017年~2022年)
- 世界の生分解性高吸水性材料の価格:種類別 (2017年~2022年)
- 市場の推計・予測:種類別 (2023年~2028年)
- 世界の生分解性高吸水性材料の販売予測:種類別 (2023年~2028年)
- 世界の生分解性高吸水性材料の収益予測:種類別 (2023年~2028年)
- 世界の生分解性高吸水性材料の価格予測:種類別 (2023年~2028年)
第5章 生分解性高吸水性材料の市場規模:用途別
- 過去の市場動向:種類別 (2017年~2022年)
- 世界の生分解性高吸水性材料の販売・市場シェア:用途別 (2017年~2022年)
- 世界の生分解性高吸水性材料の収益・市場シェア:用途別 (2017年~2022年)
- 世界の生分解性高吸水性材料の価格:用途別 (2017年~2022年)
- 市場の推計・予測:種類別 (2023年~2028年)
- 世界の生分解性高吸水性材料の販売予測:用途別 (2023年~2028年)
- 世界の生分解性高吸水性材料の収益予測:用途別 (2023年~2028年)
- 世界の生分解性高吸水性材料の価格予測:用途別 (2023年~2028年)
第6章 北米
- 北米の生分解性高吸水性材料の販売:企業別
- 生分解性高吸水性材料の市場規模:種類別
- 生分解性高吸水性材料の市場規模:用途別
- 生分解性高吸水性材料の販売:国別
- 米国
- カナダ
第7章 欧州
- 欧州の生分解性高吸水性材料の販売:企業別
- 生分解性高吸水性材料の市場規模:種類別
- 生分解性高吸水性材料の市場規模:用途別
- 生分解性高吸水性材料の市場規模:国別
- ドイツ
- 英国
- フランス
- ロシア
- イタリア
第8章 アジア太平洋
- アジア太平洋の生分解性高吸水性材料の販売:企業別
- 生分解性高吸水性材料の市場規模:種類別
- 生分解性高吸水性材料の市場規模:用途別
- 生分解性高吸水性材料の市場規模:地域別
- 中国
- 日本
- 韓国
- オーストラリア
- インド
- 東南アジア
第9章 ラテンアメリカ
- ラテンアメリカの生分解性高吸水性材料の販売:企業別
- 生分解性高吸水性材料の市場規模:種類別
- 生分解性高吸水性材料の市場規模:用途別
- 生分解性高吸水性材料の市場規模:国別
- メキシコ
- ブラジル
- アルゼンチン
第10章 中東・アフリカ
- 中東・アフリカの生分解性高吸水性材料の販売:企業別
- 生分解性高吸水性材料の市場規模:種類別
- 生分解性高吸水性材料の市場規模:用途別
- 生分解性高吸水性材料の市場規模:国別
- 湾岸協力会議 (GCC) 諸国
- トルコ
- アフリカ
第11章 企業プロファイル
- BASF
- Nippon Shokubai
- LG Chem
- MAGIC srl
- Ecovia Renewables
- Polygreen Group
- Tethis Inc
- Itaconix
第12章 バリューチェーン・販売チャネルの分析
- 生分解性高吸水性材料のバリューチェーンの分析
- 生分解性高吸水性材料の主要原材料
- 生分解性高吸水性材料の製造モードとプロセス
- 生分解性高吸水性材料の販売とマーケティング
- 生分解性高吸水性材料の顧客
第13章 分析結果と結論
第14章 付録
LIST OF TABLES
- Table 1. Global Biodegradable Superabsorbent Materials Market Size Growth Rate by Type, 2017 VS 2021 VS 2028 (US$ Million)
- Table 2. Major Manufacturers of Bio-balanced Superabsorbent Polymer
- Table 3. Major Manufacturers of Biodegradable Superabsorbent Polymer
- Table 4. Global Biodegradable Superabsorbent Materials Market Size Growth Rate by Application, 2017 VS 2021 VS 2028 (US$ Million)
- Table 5. Global Market Biodegradable Superabsorbent Materials Market Size (US$ Million) by Region: 2017 VS 2021 VS 2028
- Table 6. Global Biodegradable Superabsorbent Materials Sales by Region (2017-2022) & (Tons)
- Table 7. Global Biodegradable Superabsorbent Materials Sales Market Share by Region (2017-2022)
- Table 8. Global Biodegradable Superabsorbent Materials Revenue by Region (2017-2022) & (US$ Million)
- Table 9. Global Biodegradable Superabsorbent Materials Sales Forecast by Region (2023-2028) & (Tons)
- Table 10. Global Biodegradable Superabsorbent Materials Sales Share Forecast by Region (2023-2028) & (Tons)
- Table 11. Global Biodegradable Superabsorbent Materials Sales Market Share Forecast by Region (2023-2028)
- Table 12. Global Biodegradable Superabsorbent Materials Revenue Forecast by Region (2023-2028) & (US$ Million)
- Table 13. Global Biodegradable Superabsorbent Materials Revenue Market Share Forecast by Region (2023-2028)
- Table 14. Top Biodegradable Superabsorbent Materials Regions (Countries) Ranking by Market Size (US$ Million) In 2021
- Table 15. Biodegradable Superabsorbent Materials Market Trends
- Table 16. Biodegradable Superabsorbent Materials Market Challenges
- Table 17. Global Biodegradable Superabsorbent Materials Sales by Manufacturers (2017-2022) & (Tons)
- Table 18. Global Biodegradable Superabsorbent Materials Sales Share by Manufacturers (2017-2022)
- Table 19. Global Biodegradable Superabsorbent Materials Revenue by Manufacturers (2017-2022) & (US$ Million)
- Table 20. Ranking of Global Top Biodegradable Superabsorbent Materials Manufacturers by Revenue (US$ Million) In 2021
- Table 21. Biodegradable Superabsorbent Materials Revenue Share by Manufacturers (2017-2022)
- Table 22. Global Biodegradable Superabsorbent Materials Manufacturers Market Concentration Ratio (CR5 and HHI)
- Table 23. Global Top Manufacturers Market Share by Company Type (Tier 1, Tier 2, and Tier 3) & (based on the Revenue in Biodegradable Superabsorbent Materials as of 2021)
- Table 24. Key Manufacturers Biodegradable Superabsorbent Materials Average Selling Price (ASP) & (2017-2022) & (US$/Ton)
- Table 25. Key Manufacturers Biodegradable Superabsorbent Materials Plants/Factories Distribution
- Table 26. Date of Key Manufacturers Establishment in Biodegradable Superabsorbent Materials Market
- Table 27. Key Manufacturers Biodegradable Superabsorbent Materials Product Type
- Table 28. Recent Progress in Development of Biodegradable Superabsorbent Materials
- Table 29. Global Biodegradable Superabsorbent Materials Sales by Type (Tons) & (2017-2022)
- Table 30. Global Biodegradable Superabsorbent Materials Sales Share by Type (2017-2022)
- Table 31. Global Biodegradable Superabsorbent Materials Revenue by Type (US$ Million) & (2017-2022)
- Table 32. Global Biodegradable Superabsorbent Materials Price by Type (2017-2022) & (US$/Ton)
- Table 33. Global Biodegradable Superabsorbent Materials Sales by Type (Tons) & (2023-2028)
- Table 34. Global Biodegradable Superabsorbent Materials Sales Share by Type (2023-2028)
- Table 35. Global Biodegradable Superabsorbent Materials Revenue by Type (US$ Million) & (2023-2028)
- Table 36. Global Biodegradable Superabsorbent Materials Revenue Share by Type (2023-2028)
- Table 37. Global Biodegradable Superabsorbent Materials Price by Type (US$/Ton) & (2023-2028)
- Table 38. Global Biodegradable Superabsorbent Materials Sales by Application (Tons) & (2017-2022)
- Table 39. Global Biodegradable Superabsorbent Materials Sales Share by Application (2017-2022)
- Table 40. Global Biodegradable Superabsorbent Materials Revenue by Application (US$ Million) & (2017-2022)
- Table 41. Global Biodegradable Superabsorbent Materials Revenue Share by Application (2017-2022)
- Table 42. Global Biodegradable Superabsorbent Materials Price by Application (US$/Ton) & (2017-2022)
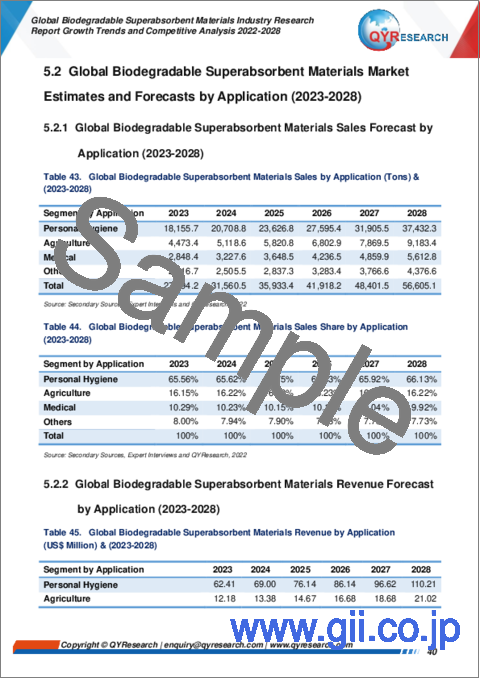
- Table 43. Global Biodegradable Superabsorbent Materials Sales by Application (Tons) & (2023-2028)
- Table 44. Global Biodegradable Superabsorbent Materials Sales Share by Application (2023-2028)
- Table 45. Global Biodegradable Superabsorbent Materials Revenue by Application (US$ Million) & (2023-2028)
- Table 46. Global Biodegradable Superabsorbent Materials Revenue Share by Application (2023-2028)
- Table 47. Global Biodegradable Superabsorbent Materials Price by Application (US$/Ton) & (2023-2028)
- Table 48. North America Biodegradable Superabsorbent Materials Sales by Company (2017-2022) & (Tons)
- Table 49. North America Biodegradable Superabsorbent Materials Sales by Type (2017-2022) & (Tons)
- Table 50. North America Biodegradable Superabsorbent Materials Sales by Type (2023-2028) & (Tons)
- Table 51. North America Biodegradable Superabsorbent Materials Revenue by Type (2017-2022) & (US$ Million)
- Table 52. North America Biodegradable Superabsorbent Materials Revenue by Type (2023-2028) & (US$ Million)
- Table 53. North America Biodegradable Superabsorbent Materials Sales by Application (2017-2022) & (Tons)
- Table 54. North America Biodegradable Superabsorbent Materials Sales by Application (2023-2028) & (Tons)
- Table 55. North America Biodegradable Superabsorbent Materials Revenue by Application (2017-2022) & (US$ Million)
- Table 56. North America Biodegradable Superabsorbent Materials Revenue by Application (2023-2028) & (US$ Million)
- Table 57. North America Biodegradable Superabsorbent Materials Sales by Country (2017-2022) & (Tons)
- Table 58. North America Biodegradable Superabsorbent Materials Sales by Country (2023-2028) & (Tons)
- Table 59. North America Biodegradable Superabsorbent Materials Revenue by Country (2017-2022) & (US$ Million)
- Table 60. North America Biodegradable Superabsorbent Materials Revenue by Country (2023-2028) & (US$ Million)
- Table 61. Europe Biodegradable Superabsorbent Materials Sales by Company (2017-2022) & (Tons)
- Table 62. Europe Biodegradable Superabsorbent Materials Sales by Type (2017-2022) & (Tons)
- Table 63. Europe Biodegradable Superabsorbent Materials Sales by Type (2023-2028) & (Tons)
- Table 64. Europe Biodegradable Superabsorbent Materials Revenue by Type (2017-2022) & (US$ Million)
- Table 65. Europe Biodegradable Superabsorbent Materials Revenue by Type (2023-2028) & (US$ Million)
- Table 66. Europe Biodegradable Superabsorbent Materials Sales by Application (2017-2022) & (Tons)
- Table 67. Europe Biodegradable Superabsorbent Materials Sales by Application (2023-2028) & (Tons)
- Table 68. Europe Biodegradable Superabsorbent Materials Revenue by Application (2017-2022) & (US$ Million)
- Table 69. Europe Biodegradable Superabsorbent Materials Revenue by Application (2023-2028) & (US$ Million)
- Table 70. Europe Biodegradable Superabsorbent Materials Sales by Country (2017-2022) & (Tons)
- Table 71. Europe Biodegradable Superabsorbent Materials Sales by Country (2023-2028) & (Tons)
- Table 72. Europe Biodegradable Superabsorbent Materials Revenue by Country (2017-2022) & (US$ Million)
- Table 73. Europe Biodegradable Superabsorbent Materials Revenue by Country (2023-2028) & (US$ Million)
- Table 74. Asia Pacific Biodegradable Superabsorbent Materials Sales by Company (2017-2022) & (Tons)
- Table 75. Asia Pacific Biodegradable Superabsorbent Materials Sales by Type (2017-2022) & (Tons)
- Table 76. Asia Pacific Biodegradable Superabsorbent Materials Sales by Type (2023-2028) & (Tons)
- Table 77. Asia Pacific Biodegradable Superabsorbent Materials Revenue by Type (2017-2022) & (US$ Million)
- Table 78. Asia Pacific Biodegradable Superabsorbent Materials Revenue by Type (2023-2028) & (US$ Million)
- Table 79. Asia Pacific Biodegradable Superabsorbent Materials Sales by Application (2017-2022) & (Tons)
- Table 80. Asia Pacific Biodegradable Superabsorbent Materials Sales by Application (2023-2028) & (Tons)
- Table 81. Asia Pacific Biodegradable Superabsorbent Materials Revenue by Application (2017-2022) & (US$ Million)
- Table 82. Asia Pacific Biodegradable Superabsorbent Materials Revenue by Application (2023-2028) & (US$ Million)
- Table 83. Asia Pacific Biodegradable Superabsorbent Materials Sales by Region (2017-2022) & (Tons)
- Table 84. Asia Pacific Biodegradable Superabsorbent Materials Sales by Region (2023-2028) & (Tons)
- Table 85. Asia Pacific Biodegradable Superabsorbent Materials Revenue by Region (2017-2022) & (US$ Million)
- Table 86. Asia Pacific Biodegradable Superabsorbent Materials Revenue by Region (2023-2028) & (US$ Million)
- Table 87. Latin America Biodegradable Superabsorbent Materials Sales by Company (2017-2022) & (Tons)
- Table 88. Latin America Biodegradable Superabsorbent Materials Sales by Type (2017-2022) & (Tons)
- Table 89. Latin America Biodegradable Superabsorbent Materials Sales by Type (2023-2028) & (Tons)
- Table 90. Latin America Biodegradable Superabsorbent Materials Revenue by Type (2017-2022) & (US$ Million)
- Table 91. Latin America Biodegradable Superabsorbent Materials Revenue by Type (2023-2028) & (US$ Million)
- Table 92. Latin America Biodegradable Superabsorbent Materials Sales by Application (2017-2022) & (Tons)
- Table 93. Latin America Biodegradable Superabsorbent Materials Sales by Application (2023-2028) & (Tons)
- Table 94. Latin America Biodegradable Superabsorbent Materials Revenue by Application (2017-2022) & (US$ Million)
- Table 95. Latin America Biodegradable Superabsorbent Materials Revenue by Application (2023-2028) & (US$ Million)
- Table 96. Latin America Biodegradable Superabsorbent Materials Sales by Country (2017-2022) & (Tons)
- Table 97. Latin America Biodegradable Superabsorbent Materials Sales by Country (2023-2028) & (Tons)
- Table 98. Latin America Biodegradable Superabsorbent Materials Revenue by Country (2017-2022) & (US$ Million)
- Table 99. Latin America Biodegradable Superabsorbent Materials Revenue by Country (2023-2028) & (US$ Million)
- Table 100. Middle East and Africa Biodegradable Superabsorbent Materials Sales by Company (2017-2022) & (Tons)
- Table 101. Middle East and Africa Biodegradable Superabsorbent Materials Sales by Type (2017-2022) & (Tons)
- Table 102. Middle East and Africa Biodegradable Superabsorbent Materials Sales by Type (2023-2028) & (Tons)
- Table 103. Middle East and Africa Biodegradable Superabsorbent Materials Revenue by Type (2017-2022) & (US$ Million)
- Table 104. Middle East and Africa Biodegradable Superabsorbent Materials Revenue by Type (2023-2028) & (US$ Million)
- Table 105. Middle East and Africa Biodegradable Superabsorbent Materials Sales by Application (2017-2022) & (Tons)
- Table 106. Middle East and Africa Biodegradable Superabsorbent Materials Sales by Application (2023-2028) & (Tons)
- Table 107. Middle East and Africa Biodegradable Superabsorbent Materials Revenue by Application (2017-2022) & (US$ Million)
- Table 108. Middle East and Africa Biodegradable Superabsorbent Materials Revenue by Application (2023-2028) & (US$ Million)
- Table 109. Middle East and Africa Biodegradable Superabsorbent Materials Sales by Region (2017-2022) & (Tons)
- Table 110. Middle East and Africa Biodegradable Superabsorbent Materials Sales by Region (2023-2028) & (Tons)
- Table 111. Middle East and Africa Biodegradable Superabsorbent Materials Revenue by Region (2017-2022) & (US$ Million)
- Table 112. Middle East and Africa Biodegradable Superabsorbent Materials Revenue by Region (2023-2028) & (US$ Million)
- Table 113. BASF Corporation Information
- Table 114. BASF Biodegradable Superabsorbent Materials Sales (Tons), Revenue (US$ Million), Average Selling Price (ASP) & (US$/Ton) and Gross Margin (2017-2022)
- Table 115. BASF Biodegradable Superabsorbent Materials Products and Services
- Table 116. Nippon Shokubai Corporation Information
- Table 117. Nippon Shokubai Biodegradable Superabsorbent Materials Sales (Tons), Revenue (US$ Million), Average Selling Price (ASP) & (US$/Ton) and Gross Margin (2017-2022)
- Table 118. Nippon Shokubai Biodegradable Superabsorbent Materials Products and Services
- Table 119. LG Chem Corporation Information
- Table 120. LG Chem Biodegradable Superabsorbent Materials Sales (Tons), Revenue (US$ Million), Average Selling Price (ASP) & (US$/Ton) and Gross Margin (2017-2022)
- Table 121. LG Chem Biodegradable Superabsorbent Materials Products and Services
- Table 122. MAGIC srl Corporation Information
- Table 123. MAGIC srl Biodegradable Superabsorbent Materials Sales (Tons), Revenue (US$ Million), Average Selling Price (ASP) & (US$/Ton) and Gross Margin (2017-2022)
- Table 124. MAGIC srl Biodegradable Superabsorbent Materials Products and Services
- Table 125. Ecovia Renewables Corporation Information
- Table 126. Ecovia Renewables Biodegradable Superabsorbent Materials Sales (Tons), Revenue (US$ Million), Average Selling Price (ASP) & (US$/Ton) and Gross Margin (2017-2022)
- Table 127. Ecovia Renewables Biodegradable Superabsorbent Materials Products and Services
- Table 128. Polygreen Group Corporation Information
- Table 129. Polygreen Group Biodegradable Superabsorbent Materials Sales (Tons), Revenue (US$ Million), Average Selling Price (ASP) & (US$/Ton) and Gross Margin (2017-2022)
- Table 130. Polygreen Group Biodegradable Superabsorbent Materials Products and Services
- Table 131. Tethis Inc Corporation Information
- Table 132. Tethis Inc Biodegradable Superabsorbent Materials Sales (Tons), Revenue (US$ Million), Average Selling Price (ASP) & (US$/Ton) and Gross Margin (2017-2022)
- Table 133. Tethis Inc Biodegradable Superabsorbent Materials Products and Services
- Table 134. Itaconix Corporation Information
- Table 135. Itaconix Biodegradable Superabsorbent Materials Products and Services
- Table 136. Raw Materials Key Suppliers Lists
- Table 137. Biodegradable Superabsorbent Materials Distributors List
- Table 138. Biodegradable Superabsorbent Materials Customers List
- Table 139. Research Programs/Design for This Report
- Table 140. Key Data Information from Secondary Sources
- Table 141. Key Data Information from Primary Sources
List of Figures
- Figure 1. Biodegradable Superabsorbent Materials Product Picture
- Figure 2. Global Biodegradable Superabsorbent Materials Market Size Growth Rate by Type, 2017 VS 2021 VS 2028 (US$ Million)
- Figure 3. Global Biodegradable Superabsorbent Materials Market Share by Type: 2021 & 2028
- Figure 4. Bio-balanced Superabsorbent Polymer Product Picture
- Figure 5. Biodegradable Superabsorbent Polymer Product Picture
- Figure 6. Global Biodegradable Superabsorbent Materials Market Size Growth Rate by Application, 2017 VS 2021 VS 2028 (US$ Million)
- Figure 7. Global Biodegradable Superabsorbent Materials Market Share by Application: 2021 & 2028
- Figure 8. Personal Hygiene Use Case
- Figure 9. Agriculture Use Case
- Figure 10. Medical Use Case
- Figure 11. Others Use Case
- Figure 12. Biodegradable Superabsorbent Materials Report Years Considered
- Figure 13. Global Biodegradable Superabsorbent Materials Revenue, (US$ Million), 2017 VS 2022 VS 2028
- Figure 14. Global Biodegradable Superabsorbent Materials Market Size 2017-2028 (US$ Million)
- Figure 15. Global Biodegradable Superabsorbent Materials Sales (2017-2028) & (Tons)
- Figure 16. Global Biodegradable Superabsorbent Materials Market Size Market Share by Region: 2021 VS 2028
- Figure 17. Global Biodegradable Superabsorbent Materials Sales Market Share by Region (2017-2022)
- Figure 18. Global Biodegradable Superabsorbent Materials Revenue Market Share by Region in 2017 VS 2022
- Figure 19. Global Biodegradable Superabsorbent Materials Sales Share by Manufacturers In 2021
- Figure 20. The 3 and 5 Largest Manufacturers in the World: Market Share by Biodegradable Superabsorbent Materials Sales In 2021
- Figure 21. Global Biodegradable Superabsorbent Materials Market Share by Company Type (Tier 1, Tier 2, and Tier 3) in 2021
- Figure 22. Global Biodegradable Superabsorbent Materials Revenue Share by Type (2017-2022)
- Figure 23. North America Biodegradable Superabsorbent Materials Sales Market Share by Company in 2021
- Figure 24. North America Biodegradable Superabsorbent Materials Sales Market Share by Type (2017-2028)
- Figure 25. North America Biodegradable Superabsorbent Materials Revenue Market Share by Type (2017-2028)
- Figure 26. North America Biodegradable Superabsorbent Materials Sales Market Share by Application (2017-2028)
- Figure 27. North America Biodegradable Superabsorbent Materials Revenue Market Share by Application (2017-2028)
- Figure 28. North America Biodegradable Superabsorbent Materials Sales Share by Country (2017-2028)
- Figure 29. North America Biodegradable Superabsorbent Materials Revenue Share by Country (2017-2028)
- Figure 30. United States Biodegradable Superabsorbent Materials Revenue (2017-2028) & (US$ Million)
- Figure 31. Canada Biodegradable Superabsorbent Materials Revenue (2017-2028) & (US$ Million)
- Figure 32. Europe Biodegradable Superabsorbent Materials Sales Market Share by Company in 2021
- Figure 33. Europe Biodegradable Superabsorbent Materials Sales Market Share by Type (2017-2028)
- Figure 34. Europe Biodegradable Superabsorbent Materials Revenue Market Share by Type (2017-2028)
- Figure 35. Europe Biodegradable Superabsorbent Materials Sales Market Share by Application (2017-2028)
- Figure 36. Europe Biodegradable Superabsorbent Materials Revenue Market Share by Application (2017-2028)
- Figure 37. Europe Biodegradable Superabsorbent Materials Sales Share by Country (2017-2028)
- Figure 38. Europe Biodegradable Superabsorbent Materials Revenue Share by Country (2017-2028)
- Figure 39. Germany Biodegradable Superabsorbent Materials Revenue (2017-2028) & (US$ Million)
- Figure 40. U.K. Biodegradable Superabsorbent Materials Revenue (2017-2028) & (US$ Million)
- Figure 41. France Biodegradable Superabsorbent Materials Revenue (2017-2028) & (US$ Million)
- Figure 42. Russia Biodegradable Superabsorbent Materials Revenue (2017-2028) & (US$ Million)
- Figure 43. Italy Biodegradable Superabsorbent Materials Revenue (2017-2028) & (US$ Million)
- Figure 44. Asia Pacific Biodegradable Superabsorbent Materials Sales Market Share by Company in 2021
- Figure 45. Asia Pacific Biodegradable Superabsorbent Materials Sales Market Share by Type (2017-2028)
- Figure 46. Asia Pacific Biodegradable Superabsorbent Materials Revenue Market Share by Type (2017-2028)
- Figure 47. Asia Pacific Biodegradable Superabsorbent Materials Sales Market Share by Application (2017-2028)
- Figure 48. Asia Pacific Biodegradable Superabsorbent Materials Revenue Market Share by Application (2017-2028)
- Figure 49. Asia Pacific Biodegradable Superabsorbent Materials Sales Share by Region (2017-2028)
- Figure 50. Asia Pacific Biodegradable Superabsorbent Materials Revenue Share by Region (2017-2028)
- Figure 51. China Biodegradable Superabsorbent Materials Revenue (2017-2028) & (US$ Million)
- Figure 52. Japan Biodegradable Superabsorbent Materials Revenue (2017-2028) & (US$ Million)
- Figure 53. South Korea Biodegradable Superabsorbent Materials Revenue (2017-2028) & (US$ Million)
- Figure 54. Australia Biodegradable Superabsorbent Materials Revenue (2017-2028) & (US$ Million)
- Figure 55. India Biodegradable Superabsorbent Materials Revenue (2017-2028) & (US$ Million)
- Figure 56. Southeast Asia Biodegradable Superabsorbent Materials Revenue (2017-2028) & (US$ Million)
- Figure 57. Latin America Biodegradable Superabsorbent Materials Sales Market Share by Company in 2021
- Figure 58. Latin America Biodegradable Superabsorbent Materials Sales Market Share by Type (2017-2028)
- Figure 59. Latin America Biodegradable Superabsorbent Materials Revenue Market Share by Type (2017-2028)
- Figure 60. Latin America Biodegradable Superabsorbent Materials Sales Market Share by Application (2017-2028)
- Figure 61. Latin America Biodegradable Superabsorbent Materials Revenue Market Share by Application (2017-2028)
- Figure 62. Latin America Biodegradable Superabsorbent Materials Sales Share by Country (2017-2028)
- Figure 63. Latin America Biodegradable Superabsorbent Materials Revenue Share by Country (2017-2028)
- Figure 64. Mexico Biodegradable Superabsorbent Materials Revenue (2017-2028) & (US$ Million)
- Figure 65. Brazil Biodegradable Superabsorbent Materials Revenue (2017-2028) & (US$ Million)
- Figure 66. Argentina Biodegradable Superabsorbent Materials Revenue (2017-2028) & (US$ Million)
- Figure 67. Middle East and Africa Biodegradable Superabsorbent Materials Sales Market Share by Company in 2021
- Figure 68. Middle East and Africa Biodegradable Superabsorbent Materials Sales Market Share by Type (2017-2028)
- Figure 69. Middle East and Africa Biodegradable Superabsorbent Materials Revenue Market Share by Type (2017-2028)
- Figure 70. Middle East and Africa Biodegradable Superabsorbent Materials Sales Market Share by Application (2017-2028)
- Figure 71. Middle East and Africa Biodegradable Superabsorbent Materials Revenue Market Share by Application (2017-2028)
- Figure 72. Middle East and Africa Biodegradable Superabsorbent Materials Sales Share by Region (2017-2028)
- Figure 73. Middle East and Africa Biodegradable Superabsorbent Materials Revenue Share by Region (2017-2028)
- Figure 74. GCC Countries Biodegradable Superabsorbent Materials Revenue (2017-2028) & (US$ Million)
- Figure 75. Turkey Biodegradable Superabsorbent Materials Revenue (2017-2028) & (US$ Million)
- Figure 76. Africa Biodegradable Superabsorbent Materials Revenue (2017-2028) & (US$ Million)
- Figure 77. Biodegradable Superabsorbent Materials Value Chain
- Figure 78. Channels of Distribution
- Figure 79. Distributors Profiles
- Figure 80. Bottom-up and Top-down Approaches for This Report
- Figure 81. Data Triangulation
- Figure 82. Key Executives Interviewed 127
Market Overview:
Due to the COVID-19 pandemic, the global Biodegradable Superabsorbent Materials market size was US$ 72.21 million in 2021 and is forecast to a readjusted size of US$ 161.82 million by 2028 with a CAGR of 11.51% during the forecast period 2022-2028. Fully considering the economic change by this health crisis, Bio-balanced Superabsorbent Polymer accounting for 42.28% of the Biodegradable Superabsorbent Materials global market in 2021, is projected to value US$ 60.49 million by 2028, growing at a revised 9.63% CAGR from 2022 to 2028. While Personal Hygiene segment is altered to an 11.77% CAGR throughout this forecast period.
The global key manufacturers of Biodegradable Superabsorbent Materials include BASF, Nippon Shokubai, LG Chem, MAGIC srl, Itaconix, Tethis Inc, Ecovia Renewables, Polygreen Group, and etc. In 2021, the global top five players hold a share approximately 81.09% in sales volume, and in term of revenue of Biodegradable Superabsorbent Materials, the top five companies hold a share nearly 87.01%.
The United States Biodegradable Superabsorbent Materials market size was US$ 14.22 million in 2021, while China size was US$ 2.00 million. The proportion of the United States was 19.69% in 2021, while China percentage was 2.77%. As for the Europe Biodegradable Superabsorbent Materials landscape, Germany is projected to reach US$ 24.19 million by 2028. and in Asia, the notable markets are Japan and South Korea, CAGR is 8.33% and 7.47% respectively for the next 6-year period.
The market research report offered here is a very useful resource that can help manufacturers, stakeholders, decision-makers, and other market participants to become familiar with every factor impacting the growth of the global Biodegradable Superabsorbent Materials market. The analysts authoring the report have closely studied key strategies adopted by top players of the global Biodegradable Superabsorbent Materials market. The report includes SWOT, and other market analyses to provide a clear and deep understanding of important aspects of the global Biodegradable Superabsorbent Materials market. Readers of the report can become informed about current and future trends of the global Biodegradable Superabsorbent Materials market and how they will impact market growth during the forecast period.
By Company
- BASF
- Nippon Shokubai
- LG Chem
- MAGIC srl
- Itaconix
- Tethis Inc
- Ecovia Renewables
- Polygreen Group
Segment by Type
- Bio-balanced Superabsorbent Polymer
- Biodegradable Superabsorbent Polymer
Segment by Application
- Personal Hygiene
- Agriculture
- Medical
- Others
By Region
- North America
- United States
- Canada
- Asia-Pacific
- China
- Japan
- South Korea
- India
- Australia
- Southeast Asia
- Europe
- Germany
- France
- U.K.
- Italy
- Russia
- Latin America
- Mexico
- Brazil
- Argentina
- Middle East & Africa
- GCC Countries
- Turkey
- Africa
TABLE OF CONTENTS
1 REPORT OVERVIEW
- 1.1 Research Scope
- 1.2 Market Segment by Type
- 1.2.1 Global Biodegradable Superabsorbent Materials Market Size Growth Rate by Type (2017 VS 2021 VS 2028)
- 1.2.2 Bio-balanced Superabsorbent Polymer
- 1.2.3 Biodegradable Superabsorbent Polymer
- 1.3 Market Segment by Application
- 1.3.1 Global Biodegradable Superabsorbent Materials Market Share by Application (2017 VS 2021 VS 2028)
- 1.3.2 Personal Hygiene
- 1.3.3 Agriculture
- 1.3.4 Medical
- 1.3.5 Others
- 1.4 Study Objectives
- 1.5 Years Considered
2 MARKET PERSPECTIVE
- 2.1 Global Biodegradable Superabsorbent Materials Market Size 2017-2028
- 2.1.1 Global Biodegradable Superabsorbent Materials Revenue 2017-2028
- 2.1.2 Global Biodegradable Superabsorbent Materials Sales 2017-2028
- 2.2 Biodegradable Superabsorbent Materials Market Size across Key Geographies Worldwide: 2017 VS 2021 VS 2028
- 2.2.1 Global Biodegradable Superabsorbent Materials Sales by Region (2017-2022)
- 2.2.2 Global Biodegradable Superabsorbent Materials Revenue by Region (2017-2022)
- 2.3 Global Biodegradable Superabsorbent Materials Market Size Forecast by Region
- 2.3.1 Global Biodegradable Superabsorbent Materials Sales Forecast by Region (2023-2028)
- 2.3.2 Global Biodegradable Superabsorbent Materials Revenue Forecast by Region (2023-2028)
- 2.4 Global Top Biodegradable Superabsorbent Materials Regions (Countries) Ranking by Market Size
- 2.5 Biodegradable Superabsorbent Materials Market Dynamics
- 2.5.1 Biodegradable Superabsorbent Materials Industry Trends
- 2.5.2 Biodegradable Superabsorbent Materials Market Drivers
- 2.5.3 Biodegradable Superabsorbent Materials Market Challenges
- 2.5.4 Biodegradable Superabsorbent Materials Market Restraints
3 COMPETITIVE LANDSCAPE BY MANUFACTURERS
- 3.1 Global Top Biodegradable Superabsorbent Materials Manufacturers by Sales (2017-2022)
- 3.1.1 Global Biodegradable Superabsorbent Materials Sales by Manufacturers (2017-2022)
- 3.1.2 Global Biodegradable Superabsorbent Materials Sales Market Share by Manufacturers 2017-2022
- 3.1.3 Global 3 and 5 Largest Manufacturers by Biodegradable Superabsorbent Materials Sales In 2021
- 3.2 Global Top Manufacturers Biodegradable Superabsorbent Materials by Revenue
- 3.2.1 Global Biodegradable Superabsorbent Materials Revenue by Manufacturers (2017-2022)
- 3.2.2 Top Biodegradable Superabsorbent Materials Manufacturers Covered: Ranking by Revenue
- 3.2.3 Global Biodegradable Superabsorbent Materials Revenue Share by Manufacturers (2017-2022)
- 3.2.4 Global Biodegradable Superabsorbent Materials Market Concentration Ratio (CR5 and HHI)
- 3.3 Global Top Manufacturers by Company Type (Tier 1, Tier 2, and Tier 3) & (based on the Revenue in Biodegradable Superabsorbent Materials as of 2021)
- 3.4 Global Biodegradable Superabsorbent Materials Average Selling Price (ASP) by Manufacturers
- 3.5 Key Manufacturers Biodegradable Superabsorbent Materials Plants/Factories Distribution and Area Served
- 3.6 Date of Key Manufacturers Establishment in Biodegradable Superabsorbent Materials Market
- 3.7 Key Manufacturers Biodegradable Superabsorbent Materials Product Offered
- 3.8 Recent Progress in Development of Biodegradable Superabsorbent Materials
4 BIODEGRADABLE SUPERABSORBENT MATERIALS MARKET SIZE BY TYPE
- 4.1 Global Biodegradable Superabsorbent Materials Historic Market Review by Type (2017-2022)
- 4.1.1 Global Biodegradable Superabsorbent Materials Sales Market Share by Type (2017-2022)
- 4.1.2 Global Biodegradable Superabsorbent Materials Revenue Market Share by Type (2017-2022)
- 4.1.3 Global Biodegradable Superabsorbent Materials Price by Type (2017-2022)
- 4.2 Global Biodegradable Superabsorbent Materials Market Estimates and Forecasts by Type (2023-2028)
- 4.2.1 Global Biodegradable Superabsorbent Materials Sales Forecast by Type (2023-2028)
- 4.2.2 Global Biodegradable Superabsorbent Materials Revenue Forecast by Type (2023-2028)
- 4.2.3 Global Biodegradable Superabsorbent Materials Price Forecast by Type (2023-2028)
5 BIODEGRADABLE SUPERABSORBENT MATERIALS MARKET SIZE BY APPLICATION
- 5.1 Global Biodegradable Superabsorbent Materials Historic Market Review by Application (2017-2022)
- 5.1.1 Global Biodegradable Superabsorbent Materials Sales Market Share by Application (2017-2022)
- 5.1.2 Global Biodegradable Superabsorbent Materials Revenue Market Share by Application (2017-2022)
- 5.1.3 Global Biodegradable Superabsorbent Materials Price by Application (2017-2022)
- 5.2 Global Biodegradable Superabsorbent Materials Market Estimates and Forecasts by Application (2023-2028)
- 5.2.1 Global Biodegradable Superabsorbent Materials Sales Forecast by Application (2023-2028)
- 5.2.2 Global Biodegradable Superabsorbent Materials Revenue Forecast by Application (2023-2028)
- 5.2.3 Global Biodegradable Superabsorbent Materials Price Forecast by Application (2023-2028)
6 NORTH AMERICA
- 6.1 North America Biodegradable Superabsorbent Materials Sales Breakdown by Company
- 6.2 North America Biodegradable Superabsorbent Materials Market Size by Type
- 6.2.1 North America Biodegradable Superabsorbent Materials Sales by Type (2017-2028)
- 6.2.2 North America Biodegradable Superabsorbent Materials Revenue by Type (2017-2028)
- 6.3 North America Biodegradable Superabsorbent Materials Market Size by Application
- 6.3.1 North America Biodegradable Superabsorbent Materials Sales by Application (2017-2028)
- 6.3.2 North America Biodegradable Superabsorbent Materials Revenue by Application (2017-2028)
- 6.4 North America Biodegradable Superabsorbent Materials Sales by Country
- 6.4.1 North America Biodegradable Superabsorbent Materials Sales by Country (2017-2028)
- 6.4.2 North America Biodegradable Superabsorbent Materials Revenue by Country (2017-2028)
- 6.4.3 United States
- 6.4.4 Canada
7 EUROPE
- 7.1 Europe Biodegradable Superabsorbent Materials Sales Breakdown by Company
- 7.2 Europe Biodegradable Superabsorbent Materials Market Size by Type
- 7.2.1 Europe Biodegradable Superabsorbent Materials Sales by Type (2017-2028)
- 7.2.2 Europe Biodegradable Superabsorbent Materials Revenue by Type (2017-2028)
- 7.3 Europe Biodegradable Superabsorbent Materials Market Size by Application
- 7.3.1 Europe Biodegradable Superabsorbent Materials Sales by Application (2017-2028)
- 7.3.2 Europe Biodegradable Superabsorbent Materials Revenue by Application (2017-2028)
- 7.4 Europe Biodegradable Superabsorbent Materials Market Size by Country
- 7.4.1 Europe Biodegradable Superabsorbent Materials Sales by Country (2017-2028)
- 7.4.2 Europe Biodegradable Superabsorbent Materials Revenue by Country (2017-2028)
- 7.4.3 Germany
- 7.4.4 U.K.
- 7.4.5 France
- 7.4.6 Russia
- 7.4.7 Italy
8 ASIA PACIFIC
- 8.1 Asia Pacific Biodegradable Superabsorbent Materials Sales Breakdown by Company
- 8.2 Asia Pacific Biodegradable Superabsorbent Materials Market Size by Type
- 8.2.1 Asia Pacific Biodegradable Superabsorbent Materials Sales by Type (2017-2028)
- 8.2.2 Asia Pacific Biodegradable Superabsorbent Materials Revenue by Type (2017-2028)
- 8.3 Asia Pacific Biodegradable Superabsorbent Materials Market Size by Application
- 8.3.1 Asia Pacific Biodegradable Superabsorbent Materials Sales by Application (2017-2028)
- 8.3.2 Asia Pacific Biodegradable Superabsorbent Materials Revenue by Application (2017-2028)
- 8.4 Asia Pacific Biodegradable Superabsorbent Materials Market Size by Region
- 8.4.1 Asia Pacific Biodegradable Superabsorbent Materials Sales by Region (2017-2028)
- 8.4.2 Asia Pacific Biodegradable Superabsorbent Materials Revenue by Region (2017-2028)
- 8.4.3 China
- 8.4.4 Japan
- 8.4.5 South Korea
- 8.4.6 Australia
- 8.4.7 India
- 8.4.8 Southeast Asia
9 LATIN AMERICA
- 9.1 Latin America Biodegradable Superabsorbent Materials Sales Breakdown by Company
- 9.2 Latin America Biodegradable Superabsorbent Materials Market Size by Type
- 9.2.1 Latin America Biodegradable Superabsorbent Materials Sales by Type (2017-2028)
- 9.2.2 Latin America Biodegradable Superabsorbent Materials Revenue by Type (2017-2028)
- 9.3 Latin America Biodegradable Superabsorbent Materials Market Size by Application
- 9.3.1 Latin America Biodegradable Superabsorbent Materials Sales by Application (2017-2028)
- 9.3.2 Latin America Biodegradable Superabsorbent Materials Revenue by Application (2017-2028)
- 9.4 Latin America Biodegradable Superabsorbent Materials Market Size by Country
- 9.4.1 Latin America Biodegradable Superabsorbent Materials Sales by Country (2017-2028)
- 9.4.2 Latin America Biodegradable Superabsorbent Materials Revenue by Country (2017-2028)
- 9.4.3 Mexico
- 9.4.4 Brazil
- 9.4.5 Argentina
10 MIDDLE EAST AND AFRICA
- 10.1 Middle East and Africa Biodegradable Superabsorbent Materials Sales Breakdown by Company
- 10.2 Middle East and Africa Biodegradable Superabsorbent Materials Market Size by Type
- 10.2.1 Middle East and Africa Biodegradable Superabsorbent Materials Sales by Type (2017-2028)
- 10.2.2 Middle East and Africa Biodegradable Superabsorbent Materials Revenue by Type (2017-2028)
- 10.3 Middle East and Africa Biodegradable Superabsorbent Materials Market Size by Application
- 10.3.1 Middle East and Africa Biodegradable Superabsorbent Materials Sales by Application (2017-2028)
- 10.3.2 Middle East and Africa Biodegradable Superabsorbent Materials Revenue by Application (2017-2028)
- 10.4 Middle East and Africa Biodegradable Superabsorbent Materials Market Size by Region
- 10.4.1 Middle East and Africa Biodegradable Superabsorbent Materials Sales by Region (2017-2028)
- 10.4.2 Middle East and Africa Biodegradable Superabsorbent Materials Revenue by Region (2017-2028)
- 10.4.3 GCC Countries
- 10.4.4 Turkey
- 10.4.5 Africa
11 COMPANY PROFILES
- 11.1 BASF
- 11.1.1 BASF Corporation Information
- 11.1.2 BASF Overview
- 11.1.3 BASF Biodegradable Superabsorbent Materials Sales, Revenue, Average Selling Price (ASP) and Gross Margin (2017-2022)
- 11.1.4 BASF Biodegradable Superabsorbent Materials Products and Services
- 11.2 Nippon Shokubai
- 11.2.1 Nippon Shokubai Corporation Information
- 11.2.2 Nippon Shokubai Overview
- 11.2.3 Nippon Shokubai Biodegradable Superabsorbent Materials Sales, Revenue, Average Selling Price (ASP) and Gross Margin (2017-2022)
- 11.2.4 Nippon Shokubai Biodegradable Superabsorbent Materials Products and Services
- 11.3 LG Chem
- 11.3.1 LG Chem Corporation Information
- 11.3.2 LG Chem Overview
- 11.3.3 LG Chem Biodegradable Superabsorbent Materials Sales, Revenue, Average Selling Price (ASP) and Gross Margin (2017-2022)
- 11.3.4 LG Chem Biodegradable Superabsorbent Materials Products and Services
- 11.4 MAGIC srl
- 11.4.1 MAGIC srl Corporation Information
- 11.4.2 MAGIC srl Overview
- 11.4.3 MAGIC srl Biodegradable Superabsorbent Materials Sales, Revenue, Average Selling Price (ASP) and Gross Margin (2017-2022)
- 11.4.4 MAGIC srl Biodegradable Superabsorbent Materials Products and Services
- 11.5 Ecovia Renewables
- 11.5.1 Ecovia Renewables Corporation Information
- 11.5.2 Ecovia Renewables Overview
- 11.5.3 Ecovia Renewables Biodegradable Superabsorbent Materials Sales, Revenue, Average Selling Price (ASP) and Gross Margin (2017-2022)
- 11.5.4 Ecovia Renewables Biodegradable Superabsorbent Materials Products and Services
- 11.6 Polygreen Group
- 11.6.1 Polygreen Group Corporation Information
- 11.6.2 Polygreen Group Overview
- 11.6.3 Polygreen Group Biodegradable Superabsorbent Materials Sales, Revenue, Average Selling Price (ASP) and Gross Margin (2017-2022)
- 11.6.4 Polygreen Group Biodegradable Superabsorbent Materials Products and Services
- 11.7 Tethis Inc
- 11.7.1 Tethis Inc Corporation Information
- 11.7.2 Tethis Inc Overview
- 11.7.3 Tethis Inc Biodegradable Superabsorbent Materials Sales, Revenue, Average Selling Price (ASP) and Gross Margin (2017-2022)
- 11.7.4 Tethis Inc Biodegradable Superabsorbent Materials Products and Services
- 11.8 Itaconix
- 11.8.1 Itaconix Corporation Information
- 11.8.2 Itaconix Overview
- 11.8.3 Itaconix Biodegradable Superabsorbent Materials Products and Services
12 VALUE CHAIN AND SALES CHANNELS ANALYSIS
- 12.1 Biodegradable Superabsorbent Materials Value Chain Analysis
- 12.2 Biodegradable Superabsorbent Materials Key Raw Materials
- 12.2.1 Key Raw Materials
- 12.2.2 Raw Materials Key Suppliers
- 12.3 Biodegradable Superabsorbent Materials Production Mode & Process
- 12.4 Biodegradable Superabsorbent Materials Sales and Marketing
- 12.4.1 Biodegradable Superabsorbent Materials Sales Channels
- 12.4.2 Biodegradable Superabsorbent Materials Distributors
- 12.5 Biodegradable Superabsorbent Materials Customers
13 RESEARCH FINDINGS AND CONCLUSION
14 APPENDIX
- 14.1 Research Methodology
- 14.1.1 Methodology/Research Approach
- 14.1.2 Data Source
- 14.2 Author Details
- 14.3 Disclaimer