|
|
市場調査レポート
商品コード
1214588
世界と欧州の電動アシスト自転車市場:分析・予測 (2022年~2028年)Global and Europe Pedelec Market Report & Forecast 2022-2028 |
||||||
|
|
|||||||
|
● お客様のご希望に応じて、既存データの加工や未掲載情報(例:国別セグメント)の追加などの対応が可能です。 詳細はお問い合わせください。 |
|||||||


| 世界と欧州の電動アシスト自転車市場:分析・予測 (2022年~2028年) |
|
出版日: 2023年02月10日
発行: QYResearch
ページ情報: 英文 141 Pages
納期: 2~3営業日
|
- 全表示
- 概要
- 図表
- 目次
世界の電動アシスト自転車 (ペデレック) の市場規模は、2022年に145億4,449万米ドル、2028年末には289億8,719万米ドルに達し、2022年から2028年の間に12.18%のCAGRで成長すると予測されます。
欧州の電動アシスト自転車の市場規模は、2022年の96億8,199万米ドルから、2028年には182億1,768万米ドルに成長し、予測期間中に11.11%のCAGRで成長すると予測されます。
当レポートでは、世界と欧州の電動アシスト自転車の市場について分析し、種類別・用途別・地域別 (国別) の市場動向の見通し (2017年~2028年)、主要企業のプロファイルなどについて調査しております。
目次
第1章 調査範囲
- 電動アシスト自転車:製品概略
- 世界の電動アシスト自転車市場の見通し (2017年・2022年・2028年)
- 販売額 (2017年~2028年)
- 販売台数 (2017年~2028年)
- 欧州の電動アシスト自転車市場の見通し (2017年・2022年・2028年)
- 販売額 (2017年~2028年)
- 販売台数 (2017年~2028年)
- 電動アシスト自転車の市場規模:欧州・世界 (2017年・2022年・2028年)
- 欧州の市場規模:対世界シェア (2017年・2022年・2028年)
- 市場成長率:欧州 vs 世界 (2017年・2022年・2028年)
- 電動アシスト自転車の市場力学
- 電動アシスト自転車業界の動向
- 電動アシスト自転車市場の促進要因
- 電動アシスト自転車市場の課題
- 電動アシスト自転車市場の抑制要因
- 分析対象
- 分析期間
第2章 電動アシスト自転車市場:種類別
- 種類別の市場セグメント
- 電動アシストアーバンバイク
- 電動アシストツーリングバイク
- 電動アシストマウンテンバイク
- 貨物用電動アシスト自転車
- その他
- 世界の電動アシスト自転車の市場規模:種類別
- 販売額:種類別 (2017年・2022年・2028年)
- 販売台数:種類別 (2017年・2022年・2028年)
- 平均販売価格 (ASP):種類別 (2017年・2022年・2028年)
- 欧州の電動アシスト自転車の市場規模:種類別
- 販売額:種類別 (2017年・2022年・2028年)
- 販売台数:種類別 (2017年・2022年・2028年)
- 平均販売価格 (ASP):種類別 (2017年・2022年・2028年)
第3章 電動アシスト自転車市場:用途別
- 用途別の市場セグメント
- オフライン
- オンライン
- 世界の電動アシスト自転車の市場規模:用途別
- 販売額:用途別 (2017年・2022年・2028年)
- 販売台数:用途別 (2017年・2022年・2028年)
- 平均販売価格 (ASP):用途別 (2017年・2022年・2028年)
- 欧州の電動アシスト自転車の市場規模:用途別
- 販売額:用途別 (2017年・2022年・2028年)
- 販売台数:用途別 (2017年・2022年・2028年)
- 平均販売価格 (ASP):用途別 (2017年・2022年・2028年)
第4章 世界の電動アシスト自転車市場:企業別の競合情勢
- 世界の電動アシスト自転車の市場規模:企業別
- 主要メーカー:収益ランキング(2021年)
- 世界の電動アシスト自転車の収益:メーカー別(2017年~2022年)
- 世界の電動アシスト自転車の販売:メーカー別(2017年~2022年)
- 世界の電動アシスト自転車の価格:メーカー別(2017年~2022年)
- 世界の電動アシスト自転車市場の集中度(CR)
- 世界の電動アシスト自転車企業の本社・設立時期
- メーカーの企業合併・買収 (M&A)、拡張計画
- 欧州の電動アシスト自転車の市場規模:企業別
- 欧州の電動アシスト自転車の収益:メーカー別(2017年~2022年)
- 欧州の電動アシスト自転車の販売:メーカー別(2017年~2022年)
第5章 世界の電動アシスト自転車の市場規模:地域別
- 世界の電動アシスト自転車市場規模:地域別 (2017年・2022年・2028年)
- 世界の電動アシスト自転車市場規模:地域別(数量、2017年~2028年)
- 世界の電動アシスト自転車市場規模:地域別(金額、2017年~2028年)
第6章 地域レベル・国レベルのセグメント
- 北米
- 米国
- カナダ
- メキシコ
- アジア太平洋
- 中国
- 日本
- 韓国
- インド
- オーストラリア
- 東南アジア
- 欧州
- ドイツ
- フランス
- 英国
- スペイン
- スイス
- 北欧
- 南米
- ブラジル
- アルゼンチン
- 中東・アフリカ
- トルコ
- エジプト
- ロシア・CIS諸国
第7章 企業プロファイル
- Giant
- Accell Group
- Pon
- Panasonic
- Merida
- Yamaha
- Rad Power Bikes
- Trek
- Bridgestone
- Riese &Muller
- Yadea
- Cycleurope
- Flyer
- TAILG
- Specialized
- Mustache
- VanMoof
- Pedego
- Stromer
- Beistegui Hermanos
第8章 産業チェーンと販売チャネルの分析
- 電動アシスト自転車の産業チェーン分析
- 電動アシスト自転車の主要原材料
- 電動アシスト自転車の販売とマーケティング
- 電動アシスト自転車の顧客
第9章 調査結果と結論
第10章 付録
List of Tables
- Table 1. Pedelec CAGR in Value, Europe VS Global, 2017 VS 2022 VS 2028
- Table 2. Pedelec Market Trends
- Table 3. Pedelec Market Drivers
- Table 4. Pedelec Market Challenges
- Table 5. Pedelec Market Restraints
- Table 6. Global Pedelec Sales by Type: 2017 VS 2022 VS 2028 (US$ Million)
- Table 7. Global Pedelec Sales in Value by Type (2017-2022) & (US$ Million)
- Table 8. Global Pedelec Sales in Value by Type (2023-2028) & (US$ Million)
- Table 9. Global Pedelec Sales by Type (2017-2022) & (K Units)
- Table 10. Global Pedelec Sales by Type (2023-2028) & (K Units)
- Table 11. Europe Pedelec Sales by Type: 2017 VS 2022 VS 2028 (US$ Million)
- Table 12. Europe Pedelec Sales in Value by Type (2017-2022) & (US$ Million)
- Table 13. Europe Pedelec Sales in Value by Type (2023-2028) & (US$ Million)
- Table 14. Europe Pedelec Sales by Type (2017-2022) & (K Units)
- Table 15. Europe Pedelec Sales by Type (2023-2028) & (K Units)
- Table 16. Global Pedelec Sales by Application: 2017 VS 2022 VS 2028 (US$ Million)
- Table 17. Global Pedelec Sales in Value by Application (2017-2022) & (US$ Million)
- Table 18. Global Pedelec Sales in Value by Application (2023-2028) & (US$ Million)
- Table 19. Global Pedelec Sales by Application (2017-2022) & (K Units)
- Table 20. Global Pedelec Sales by Application (2023-2028) & (K Units)
- Table 21. Global Pedelec Price by Application (2017-2028) & (US$/Unit)
- Table 22. Europe Pedelec Sales by Application: 2017 VS 2022 VS 2028 (US$ Million)
- Table 23. Europe Pedelec Sales in Value by Application (2017-2022) & (US$ Million)
- Table 24. Europe Pedelec Sales in Value by Application (2023-2028) & (US$ Million)
- Table 25. Europe Pedelec Sales in Volume by Application: 2017 VS 2022 VS 2028 (K Units)
- Table 26. Europe Pedelec Sales by Application (2017-2022) & (K Units)
- Table 27. Europe Pedelec Sales by Application (2023-2028) & (K Units)
- Table 28. Europe Pedelec Price by Application (2017-2028) & (US$/Unit)
- Table 29. Top Pedelec Manufacturers in Global Market, Ranking by Revenue (2021)
- Table 30. Global Pedelec Revenue by Manufacturer, (US$ Million), 2017-2022
- Table 31. Global Pedelec Revenue Share by Manufacturer, 2017-2022
- Table 32. Global Pedelec Sales by Manufacturer, (K Units), 2017-2022
- Table 33. Global Pedelec Sales Share by Manufacturer, 2017-2022
- Table 34. Global Pedelec Price by Manufacturer (2017-2022) & (US$/Unit)
- Table 35. Global Pedelec Manufacturers Market Concentration Ratio (CR5 and HHI)
- Table 36. Global Pedelec by Company Type (Tier 1, Tier 2, and Tier 3) & (based on the Revenue in Pedelec as of 2021)
- Table 37. Top Pedelec Manufacturers Headquarters and Established Date
- Table 38. Manufacturers Mergers & Acquisitions, Expansion Plans
- Table 39. Europe Pedelec Revenue by Players, (US$ Million), (2017-2022)
- Table 40. Europe Pedelec Revenue Share by Players, 2017-2022
- Table 41. Europe Pedelec Sales by Players, (K Units), 2017-2022
- Table 42. Europe Pedelec Sales Share by Players, 2017-2022
- Table 43. Global Pedelec Market Size by Region (US$ Million): 2017 VS 2022 VS 2028
- Table 44. Global Pedelec Sales in Volume by Region (2017-2022) & (K Units)
- Table 45. Global Pedelec Sales in Volume Forecast by Region (2023-2028) & (K Units)
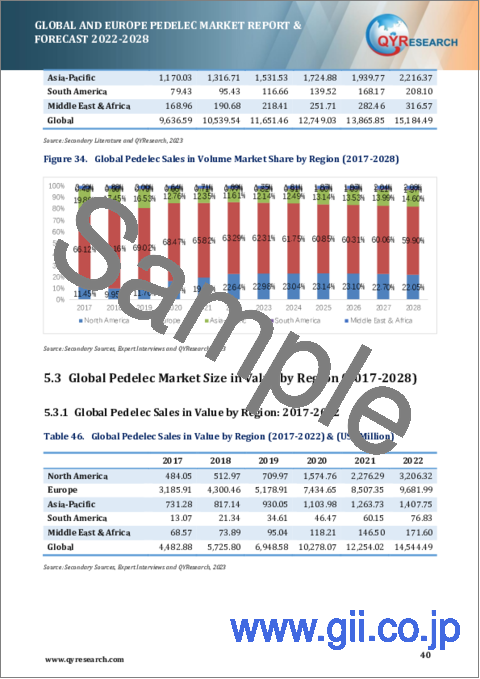
- Table 46. Global Pedelec Sales in Value by Region (2017-2022) & (US$ Million)
- Table 47. Global Pedelec Sales in Value Forecast by Region (2023-2028) & (US$ Million)
- Table 48. North America Pedelec Sales in Volume by Country (2017-2022) & (K Units)
- Table 49. North America Pedelec Sales in Volume by Country (2023-2028) & (K Units)
- Table 50. North America Pedelec Sales in Value by Country (2017-2022) & (US$ Million)
- Table 51. North America Pedelec Sales in Value by Country (2023-2028) & (US$ Million)
- Table 52. Asia-Pacific Pedelec Sales in Volume by Region (2017-2022) & (K Units)
- Table 53. Asia-Pacific Pedelec Sales in Volume by Region (2023-2028) & (K Units)
- Table 54. Asia-Pacific Pedelec Sales in Value by Region (2017-2022) & (US$ Million)
- Table 55. Asia-Pacific Pedelec Sales in Value by Region (2023-2028) & (US$ Million)
- Table 56. Europe Pedelec Sales in Volume by Country (2017-2022) & (K Units)
- Table 57. Europe Pedelec Sales in Volume by Country (2023-2028) & (K Units)
- Table 58. Europe Pedelec Sales in Value by Country (2017-2022) & (US$ Million)
- Table 59. Europe Pedelec Sales in Value by Country (2023-2028) & (US$ Million)
- Table 60. South America Pedelec Sales in Volume by Country (2017-2022) & (K Units)
- Table 61. South America Pedelec Sales in Volume by Country (2023-2028) & (K Units)
- Table 62. South America Pedelec Sales in Value by Country (2017-2022) & (US$ Million)
- Table 63. South America Pedelec Sales in Value by Country (2023-2028) & (US$ Million)
- Table 64. Middle East and Africa Pedelec Sales in Volume by Country (2017-2022) & (K Units)
- Table 65. Middle East and Africa Pedelec Sales in Volume by Country (2023-2028) & (K Units)
- Table 66. Middle East and Africa Pedelec Sales in Value by Country (2017-2022) & (US$ Million)
- Table 67. Middle East and Africa Pedelec Sales in Value by Country (2023-2028) & (US$ Million)
- Table 68. Giant Corporation Information
- Table 69. Giant Description and Business Overview
- Table 70. Giant Pedelec Sales (K Units), Revenue (US$ Million), Price (US$/Unit) and Gross Margin (2017-2022)
- Table 71. Accell Group Corporation Information
- Table 72. Accell Group Description and Business Overview
- Table 73. Accell Group Pedelec Sales (K Units), Revenue (US$ Million), Price (US$/Unit) and Gross Margin (2017-2022)
- Table 74. Pon Corporation Information
- Table 75. Pon Description and Business Overview
- Table 76. Pon Pedelec Sales (K Units), Revenue (US$ Million), Price (US$/Unit) and Gross Margin (2017-2022)
- Table 77. Panasonic Corporation Information
- Table 78. Panasonic Description and Business Overview
- Table 79. Panasonic Pedelec Sales (K Units), Revenue (US$ Million), Price (US$/Unit) and Gross Margin (2017-2022)
- Table 80. Merida Corporation Information
- Table 81. Merida Description and Business Overview
- Table 82. Merida Pedelec Sales (K Units), Revenue (US$ Million), Price (US$/Unit) and Gross Margin (2017-2022)
- Table 83. Yamaha Corporation Information
- Table 84. Yamaha Description and Business Overview
- Table 85. Yamaha Pedelec Sales (K Units), Revenue (US$ Million), Price (US$/Unit) and Gross Margin (2017-2022)
- Table 86. Rad Power Bikes Corporation Information
- Table 87. Rad Power Bikes Description and Business Overview
- Table 88. Rad Power Bikes Pedelec Sales (K Units), Revenue (US$ Million), Price (US$/Unit) and Gross Margin (2017-2022)
- Table 89. Trek Corporation Information
- Table 90. Trek Description and Business Overview
- Table 91. Trek Pedelec Sales (K Units), Revenue (US$ Million), Price (US$/Unit) and Gross Margin (2017-2022)
- Table 92. Bridgestone Corporation Information
- Table 93. Bridgestone Description and Business Overview
- Table 94. Bridgestone Pedelec Sales (K Units), Revenue (US$ Million), Price (US$/Unit) and Gross Margin (2017-2022)
- Table 95. Riese & Muller Corporation Information
- Table 96. Riese & Muller Description and Business Overview
- Table 97. Riese & Muller Pedelec Sales (K Units), Revenue (US$ Million), Price (US$/Unit) and Gross Margin (2017-2022)
- Table 98. Yadea Corporation Information
- Table 99. Yadea Description and Business Overview
- Table 100. Yadea Pedelec Sales (K Units), Revenue (US$ Million), Price (US$/Unit) and Gross Margin (2017-2022)
- Table 101. Cycleurope Corporation Information
- Table 102. Cycleurope Description and Business Overview
- Table 103. Cycleurope Pedelec Sales (K Units), Revenue (US$ Million), Price (US$/Unit) and Gross Margin (2017-2022)
- Table 104. Flyer Corporation Information
- Table 105. Flyer Description and Business Overview
- Table 106. Flyer Pedelec Sales (K Units), Revenue (US$ Million), Price (US$/Unit) and Gross Margin (2017-2022)
- Table 107. TAILG Corporation Information
- Table 108. TAILG Description and Business Overview
- Table 109. TAILG Pedelec Sales (K Units), Revenue (US$ Million), Price (US$/Unit) and Gross Margin (2017-2022)
- Table 110. Specialized Corporation Information
- Table 111. Specialized Description and Business Overview
- Table 112. Specialized Pedelec Sales (K Units), Revenue (US$ Million), Price (US$/Unit) and Gross Margin (2017-2022)
- Table 113. Mustache Corporation Information
- Table 114. Mustache Description and Business Overview
- Table 115. Mustache Pedelec Sales (K Units), Revenue (US$ Million), Price (US$/Unit) and Gross Margin (2017-2022)
- Table 116. VanMoof Corporation Information
- Table 117. VanMoof Description and Business Overview
- Table 118. VanMoof Pedelec Sales (K Units), Revenue (US$ Million), Price (US$/Unit) and Gross Margin (2017-2022)
- Table 119. Pedego Corporation Information
- Table 120. Pedego Description and Business Overview
- Table 121. Pedego Pedelec Sales (K Units), Revenue (US$ Million), Price (US$/Unit) and Gross Margin (2017-2022)
- Table 122. Stromer Corporation Information
- Table 123. Stromer Description and Business Overview
- Table 124. Stromer Pedelec Sales (K Units), Revenue (US$ Million), Price (US$/Unit) and Gross Margin (2017-2022)
- Table 125. Beistegui Hermanos Corporation Information
- Table 126. Beistegui Hermanos Description and Business Overview
- Table 127. Beistegui Hermanos Pedelec Sales (K Units), Revenue (US$ Million), Price (US$/Unit) and Gross Margin (2017-2022)
- Table 128. Key Raw Materials Lists
- Table 129. Raw Materials Key Suppliers Lists
- Table 130. Pedelec Distributors List
- Table 131. Research Programs/Design for This Report
- Table 132. Key Data Information from Secondary Sources
- Table 133. Key Data Information from Primary Sources
List of Figures
- Figure 1. Pedelec Product Picture
- Figure 2. Global Pedelec Revenue, (US$ Million), 2017 VS 2022 VS 2028
- Figure 3. Global Pedelec Market Size 2017-2028 (US$ Million)
- Figure 4. Global Pedelec Sales 2017-2028 (K Units)
- Figure 5. Europe Pedelec Revenue, (US$ Million), 2017 VS 2022 VS 2028
- Figure 6. Europe Pedelec Market Size 2017-2028 (US$ Million)
- Figure 7. Europe Pedelec Sales 2017-2028 (K Units)
- Figure 8. Europe Pedelec Market Share in Global, in Value (US$ Million) 2017-2028
- Figure 9. Europe Pedelec Market Share in Global, in Volume (K Units) 2017-2028
- Figure 10. Pedelec Report Years Considered
- Figure 11. Product Picture of Urban Pedelec
- Figure 12. Product Picture of Touring Pedelec
- Figure 13. Product Picture of Mountain Pedelec
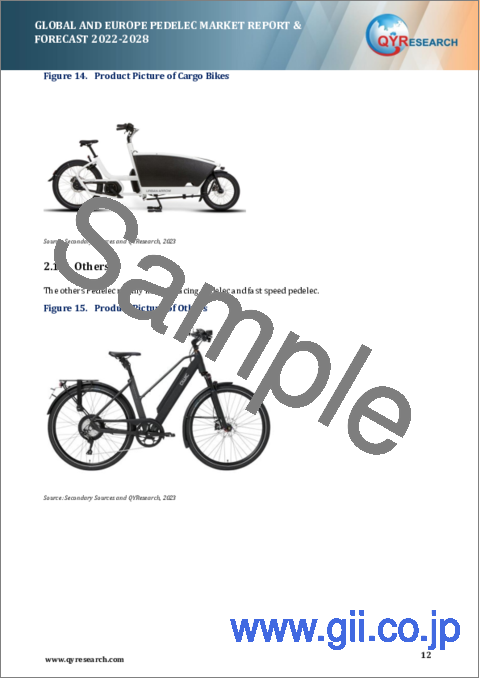
- Figure 14. Product Picture of Cargo Bikes
- Figure 15. Product Picture of Others
- Figure 16. Global Pedelec Market Share by Type in 2022 & 2028
- Figure 17. Global Pedelec Sales Market Share in Value by Type (2017-2028)
- Figure 18. Global Pedelec Sales Market Share in Volume by Type (2017-2028)
- Figure 19. Global Pedelec Price by Type (2017-2028) & (US$/Unit)
- Figure 20. Europe Pedelec Market Share by Type in 2022 & 2028
- Figure 21. Europe Pedelec Price by Type (2017-2028) & (US$/Unit)
- Figure 22. Product Picture of Offline
- Figure 23. Product Picture of On-line
- Figure 24. Global Pedelec Market Share by Application in 2022 & 2028
- Figure 25. Global Pedelec Sales Market Share in Value by Application (2017-2028)
- Figure 26. Global Pedelec Sales in Volume by Application: 2017 VS 2022 VS 2028 (K Units)
- Figure 27. Global Pedelec Sales in Volume Market Share by Application in 2022 & 2028
- Figure 28. Global Pedelec Sales Market Share in Volume by Application (2017-2028)
- Figure 29. Europe Pedelec Market Share by Application in 2022 & 2028
- Figure 30. Europe Pedelec Sales Market Share in Value by Application (2017-2028)
- Figure 31. Europe Pedelec Sales in Volume Market Share by Application in 2022 & 2028
- Figure 32. Europe Pedelec Sales Market Share in Volume by Application (2017-2028)
- Figure 33. The Top 5 and 10 Largest Manufacturers of Pedelec in the World: Market Share by Pedelec Revenue in 2021
- Figure 34. Global Pedelec Sales in Volume Market Share by Region (2017-2028)
- Figure 35. Global Pedelec Sales in Value Market Share by Region (2017-2028)
- Figure 36. North America Pedelec Sales in Volume Growth Rate 2017-2028 (K Units)
- Figure 37. North America Pedelec Sales in Value Growth Rate 2017-2028 (US$ Million)
- Figure 38. United States Pedelec Sales in Value Growth Rate (2017-2028) & (US$ Million)
- Figure 39. United States Pedelec Sales in Volume Growth Rate (2017-2028) & (K Units)
- Figure 40. Canada Pedelec Sales in Value Growth Rate (2017-2028) & (US$ Million)
- Figure 41. Canada Pedelec Sales in Volume Growth Rate (2017-2028) & (K Units)
- Figure 42. Mexico Pedelec Sales in Value Growth Rate (2017-2028) & (US$ Million)
- Figure 43. Mexico Pedelec Sales in Volume Growth Rate (2017-2028) & (K Units)
- Figure 44. Asia-Pacific Pedelec Sales in Volume Growth Rate 2017-2028 (K Units)
- Figure 45. Asia-Pacific Pedelec Sales in Value Growth Rate 2017-2028 (US$ Million)
- Figure 46. China Pedelec Sales in Value Growth Rate (2017-2028) & (US$ Million)
- Figure 47. China Pedelec Sales in Volume Growth Rate (2017-2028) & (K Units)
- Figure 48. Japan Pedelec Sales in Value Growth Rate (2017-2028) & (US$ Million)
- Figure 49. Japan Pedelec Sales in Volume Growth Rate (2017-2028) & (K Units)
- Figure 50. South Korea Pedelec Sales in Value Growth Rate (2017-2028) & (US$ Million)
- Figure 51. South Korea Pedelec Sales in Volume Growth Rate (2017-2028) & (K Units)
- Figure 52. India Pedelec Sales in Value Growth Rate (2017-2028) & (US$ Million)
- Figure 53. India Pedelec Sales in Volume Growth Rate (2017-2028) & (K Units)
- Figure 54. Australia Pedelec Sales in Value Growth Rate (2017-2028) & (US$ Million)
- Figure 55. Australia Pedelec Sales in Volume Growth Rate (2017-2028) & (K Units)
- Figure 56. Southeast Asia Pedelec Sales in Value Growth Rate (2017-2028) & (US$ Million)
- Figure 57. Southeast Asia Pedelec Sales in Volume Growth Rate (2017-2028) & (K Units)
- Figure 58. Europe Pedelec Sales in Volume Growth Rate 2017-2028 (K Units)
- Figure 59. Europe Pedelec Sales in Value Growth Rate 2017-2028 (US$ Million)
- Figure 60. Germany Pedelec Sales in Value Growth Rate (2017-2028) & (US$ Million)
- Figure 61. Germany Pedelec Sales in Volume Growth Rate (2017-2028) & (K Units)
- Figure 62. France Pedelec Sales in Value Growth Rate (2017-2028) & (US$ Million)
- Figure 63. France Pedelec Sales in Volume Growth Rate (2017-2028) & (K Units)
- Figure 64. UK Pedelec Sales in Value Growth Rate (2017-2028) & (US$ Million)
- Figure 65. UK Pedelec Sales in Volume Growth Rate (2017-2028) & (K Units)
- Figure 66. Spain Pedelec Sales in Value Growth Rate (2017-2028) & (US$ Million)
- Figure 67. Spain Pedelec Sales in Volume Growth Rate (2017-2028) & (K Units)
- Figure 68. Switzerland Pedelec Sales in Value Growth Rate (2017-2028) & (US$ Million)
- Figure 69. Switzerland Pedelec Sales in Volume Growth Rate (2017-2028) & (K Units)
- Figure 70. Northern Europe Pedelec Sales in Value Growth Rate (2017-2028) & (US$ Million)
- Figure 71. Northern Europe Pedelec Sales in Volume Growth Rate (2017-2028) & (K Units)
- Figure 72. South America Pedelec Sales in Volume Growth Rate 2017-2028 (K Units)
- Figure 73. South America Pedelec Sales in Value Growth Rate 2017-2028 (US$ Million)
- Figure 74. Brazil Pedelec Sales in Value Growth Rate (2017-2028) & (US$ Million)
- Figure 75. Brazil Pedelec Sales in Volume Growth Rate (2017-2028) & (K Units)
- Figure 76. Argentina Pedelec Sales in Value Growth Rate (2017-2028) & (US$ Million)
- Figure 77. Argentina Pedelec Sales in Volume Growth Rate (2017-2028) & (K Units)
- Figure 78. Middle East and Africa Pedelec Sales in Volume Growth Rate 2017-2028 (K Units)
- Figure 79. Middle East and Africa Pedelec Sales in Value Growth Rate 2017-2028 (US$ Million)
- Figure 80. Turkey Pedelec Sales in Value Growth Rate (2017-2028) & (US$ Million)
- Figure 81. Turkey Pedelec Sales in Volume Growth Rate (2017-2028) & (K Units)
- Figure 82. Egypt Pedelec Sales in Value Growth Rate (2017-2028) & (US$ Million)
- Figure 83. Egypt Pedelec Sales in Volume Growth Rate (2017-2028) & (K Units)
- Figure 84. Russia & CIS Pedelec Sales in Value Growth Rate (2017-2028) & (US$ Million)
- Figure 85. Russia & CIS Pedelec Sales in Volume Growth Rate (2017-2028) & (K Units)
- Figure 86. Giant Pedelec Product
- Figure 87. Accell Group Pedelec Product
- Figure 88. Pon Pedelec Product
- Figure 89. Panasonic Pedelec Product
- Figure 90. Merida Pedelec Product
- Figure 91. Yamaha Pedelec Product
- Figure 92. Rad Power Bikes Pedelec Product
- Figure 93. Trek Pedelec Product
- Figure 94. Bridgestone Pedelec Product
- Figure 95. Riese & Muller Pedelec Product
- Figure 96. Yadea Pedelec Product
- Figure 97. Cycleurope Pedelec Product
- Figure 98. Flyer Pedelec Product
- Figure 99. TAILG Pedelec Product
- Figure 100. Specialized Pedelec Product
- Figure 101. Mustache Pedelec Product
- Figure 102. VanMoof Pedelec Product
- Figure 103. Pedego Pedelec Product
- Figure 104. Stromer Pedelec Product
- Figure 105. Beistegui Hermanos Pedelec Product
- Figure 106. Pedelec Value Chain
- Figure 107. Channels of Distribution
- Figure 108. Distributors Profiles
- Figure 109. Bottom-up and Top-down Approaches for This Report
- Figure 110. Data Triangulation
- Figure 111. Key Executives Interviewed
Market Analysis and Insights:
This report focuses on global and Europe Pedelec market, also covers the segmentation data of other regions in regional level and county level.
The global Pedelec market was valued at US$ 14,544.49 million in 2022 and will reach US$ 28,987.19 million by the end of 2028, growing at a CAGR of 12.18% during 2022-2028.
In Europe the Pedelec market size is expected to grow from US$ 9,681.99 million in 2022 to US$ 18,217.68 million by 2028, at a CAGR of 11.11% during the forecast period.
Scope and Market Size:
Pedelec market is segmented in regional and country level, by players, by Type, and by Application. Players, stakeholders, and other participants in the global Pedelec market will be able to gain the upper hand as they use the report as a powerful resource. The segmental analysis focuses on sales, revenue and forecast by Type and by Application for the period 2017-2028.
For Europe market, this report focuses on the Pedelec market size by players, by Type, and by Application, for the period 2017-2028. The key players include the global and local players which play important roles in Europe.
By Company
- Giant
- Accell Group
- Pon
- Panasonic
- Merida
- Yamaha
- Rad Power Bikes
- Trek
- Bridgestone
- Riese & Muller
- Yadea
- Cycleurope
- Flyer
- TAILG
- Specialized
- Mustache
- VanMoof
- Pedego
- Stromer
- Beistegui Hermanos
Segment by Type
- Urban Pedelec
- Touring Pedelec
- Mountain Pedelec
- Cargo Bikes
- Others
Segment by Application
- Offline
- On-line
By Region
- North America
- United States
- Canada
- Mexico
- Asia-Pacific
- China
- Japan
- South Korea
- India
- Australia
- Southeast Asia
- Europe
- Germany
- France
- UK
- Spain
- Switzerland
- Northern Europe
- South America
- Brazil
- Argentina
- Middle East & Africa
- Turkey
- Egypt
- Russia & CIS
Table of Contents
1 Study Coverage
- 1.1 Pedelec Product Introduction
- 1.2 Global Pedelec Outlook 2017 VS 2022 VS 2028
- 1.2.1 Global Pedelec Sales in US$ Million for the Year 2017-2028
- 1.2.2 Global Pedelec Sales in Volume for the Year 2017-2028
- 1.3 Europe Pedelec Outlook 2017 VS 2022 VS 2028
- 1.3.1 Europe Pedelec Sales in US$ Million for the Year 2017-2028
- 1.3.2 Europe Pedelec Sales in Volume for the Year 2017-2028
- 1.4 Pedelec Market Size, Europe VS Global, 2017 VS 2022 VS 2028
- 1.4.1 The Market Share of Europe Pedelec in Global, 2017 VS 2022 VS 2028
- 1.4.2 The Growth Rate of Pedelec Market Size, Europe VS Global, 2017 VS 2022 VS 2028
- 1.5 Pedelec Market Dynamics
- 1.5.1 Pedelec Industry Trends
- 1.5.2 Pedelec Market Drivers
- 1.5.3 Pedelec Market Challenges
- 1.5.4 Pedelec Market Restraints
- 1.6 Study Objectives
- 1.7 Years Considered
2 Pedelec by Type
- 2.1 Pedelec Market Segment by Type
- 2.1.1 Urban Pedelec
- 2.1.2 Touring Pedelec
- 2.1.3 Mountain Pedelec
- 2.1.4 Cargo Bikes
- 2.1.5 Others
- 2.2 Global Pedelec Market Size by Type
- 2.2.1 Global Pedelec Sales in Value, by Type (2017, 2022 & 2028)
- 2.2.2 Global Pedelec Sales in Volume, by Type (2017, 2022 & 2028)
- 2.2.3 Global Pedelec Average Selling Price (ASP) by Type (2017, 2022 & 2028)
- 2.3 Europe Pedelec Market Size by Type
- 2.3.1 Europe Pedelec Sales in Value, by Type (2017, 2022 & 2028)
- 2.3.2 Europe Pedelec Sales in Volume, by Type
- 2.3.3 Europe Pedelec Average Selling Price (ASP) by Type (2017, 2022 & 2028)
3 Pedelec by Application
- 3.1 Pedelec Market Segment by Application
- 3.1.1 Offline
- 3.1.2 On-line
- 3.2 Global Pedelec Market Size by Application
- 3.2.1 Global Pedelec Sales in Value, by Application (2017, 2022 & 2028)
- 3.2.2 Global Pedelec Sales in Volume, by Application (2017, 2022 & 2028)
- 3.2.3 Global Pedelec Average Selling Price (ASP) by Application (2017, 2022 & 2028)
- 3.3 Europe Pedelec Market Size by Application
- 3.3.1 Europe Pedelec Sales in Value, by Application (2017, 2022 & 2028)
- 3.3.2 Europe Pedelec Sales in Volume, by Application (2017, 2022 & 2028)
- 3.3.3 Europe Pedelec Average Selling Price (ASP) by Application (2017, 2022 & 2028)
4 Global Pedelec Competitor Landscape by Company
- 4.1 Global Pedelec Market Size by Company
- 4.1.1 Top Global Pedelec Manufacturers Ranked (2021)
- 4.1.2 Global Pedelec Revenue by Manufacturer (2017-2022)
- 4.1.3 Global Pedelec Sales by Manufacturer (2017-2022)
- 4.1.4 Global Pedelec Price by Manufacturer (2017-2022)
- 4.2 Global Pedelec Concentration Ratio (CR)
- 4.2.1 Pedelec Market Concentration Ratio (CR) (2017-2022)
- 4.2.2 Global Top 5 and Top 10 Largest Manufacturers of Pedelec in 2021
- 4.2.3 Global Pedelec Market Share by Company Type (Tier 1, Tier 2, and Tier 3)
- 4.3 Global Pedelec Manufacturers Headquarters and Established Date
- 4.4 Manufacturers Mergers & Acquisitions, Expansion Plans
- 4.5 Europe Pedelec Market Size by Company
- 4.5.1 Europe Pedelec Revenue by Players (2017-2022)
- 4.5.2 Europe Pedelec Sales by Players (2017-2022)
5 Global Pedelec Market Size by Region
- 5.1 Global Pedelec Market Size by Region: 2017 VS 2022 VS 2028
- 5.2 Global Pedelec Market Size in Volume by Region (2017-2028)
- 5.2.1 Global Pedelec Sales in Volume by Region: 2017-2022
- 5.2.2 Global Pedelec Sales in Volume Forecast by Region (2023-2028)
- 5.3 Global Pedelec Market Size in Value by Region (2017-2028)
- 5.3.1 Global Pedelec Sales in Value by Region: 2017-2022
- 5.3.2 Global Pedelec Sales in Value by Region: 2023-2028
6 Segment in Regional Level & Country Level
- 6.1 North America
- 6.1.1 North America Pedelec Market Size YoY Growth 2017-2028
- 6.1.2 North America Pedelec Market Facts & Figures by Country (2017, 2022 & 2028)
- 6.1.3 United States
- 6.1.4 Canada
- 6.1.5 Mexico
- 6.2 Asia-Pacific
- 6.2.1 Asia-Pacific Pedelec Market Size YoY Growth 2017-2028
- 6.2.2 Asia-Pacific Pedelec Market Facts & Figures by Region (2017, 2022 & 2028)
- 6.2.3 China
- 6.2.4 Japan
- 6.2.5 South Korea
- 6.2.6 India
- 6.2.7 Australia
- 6.2.8 Southeast Asia
- 6.3 Europe
- 6.3.1 Europe Pedelec Market Size YoY Growth 2017-2028
- 6.3.2 Europe Pedelec Market Facts & Figures by Country (2017, 2022 & 2028)
- 6.3.3 Germany
- 6.3.4 France
- 6.3.5 UK
- 6.3.6 Spain
- 6.3.7 Switzerland
- 6.3.8 Northern Europe
- 6.4 South America
- 6.4.1 South America Pedelec Market Size YoY Growth 2017-2028
- 6.4.2 South America Pedelec Market Facts & Figures by Country (2017, 2022 & 2028)
- 6.4.3 Brazil
- 6.4.4 Argentina
- 6.5 Middle East and Africa
- 6.5.1 Middle East and Africa Pedelec Market Size YoY Growth 2017-2028
- 6.5.2 Middle East and Africa Pedelec Market Facts & Figures by Country (2017, 2022 & 2028)
- 6.5.3 Turkey
- 6.5.4 Egypt
- 6.5.5 Russia & CIS
7 Company Profiles
- 7.1 Giant
- 7.1.1 Giant Corporation Information
- 7.1.2 Giant Description and Business Overview
- 7.1.3 Giant Pedelec Sales, Revenue and Gross Margin (2017-2022)
- 7.1.4 Giant Pedelec Products Offered
- 7.2 Accell Group
- 7.2.1 Accell Group Corporation Information
- 7.2.2 Accell Group Description and Business Overview
- 7.2.3 Accell Group Pedelec Sales, Revenue and Gross Margin (2017-2022)
- 7.2.4 Accell Group Pedelec Products Offered
- 7.3 Pon
- 7.3.1 Pon Corporation Information
- 7.3.2 Pon Description and Business Overview
- 7.3.3 Pon Pedelec Sales, Revenue and Gross Margin (2017-2022)
- 7.3.4 Pon Pedelec Products Offered
- 7.4 Panasonic
- 7.4.1 Panasonic Corporation Information
- 7.4.2 Panasonic Description and Business Overview
- 7.4.3 Panasonic Pedelec Sales, Revenue and Gross Margin (2017-2022)
- 7.4.4 Panasonic Pedelec Products Offered
- 7.5 Merida
- 7.5.1 Merida Corporation Information
- 7.5.2 Merida Description and Business Overview
- 7.5.3 Merida Pedelec Sales, Revenue and Gross Margin (2017-2022)
- 7.5.4 Merida Pedelec Products Offered
- 7.6 Yamaha
- 7.6.1 Yamaha Corporation Information
- 7.6.2 Yamaha Description and Business Overview
- 7.6.3 Yamaha Pedelec Sales, Revenue and Gross Margin (2017-2022)
- 7.6.4 Yamaha Pedelec Products Offered
- 7.7 Rad Power Bikes
- 7.7.1 Rad Power Bikes Corporation Information
- 7.7.2 Rad Power Bikes Description and Business Overview
- 7.7.3 Rad Power Bikes Pedelec Sales, Revenue and Gross Margin (2017-2022)
- 7.7.4 Rad Power Bikes Pedelec Products Offered
- 7.8 Trek
- 7.8.1 Trek Corporation Information
- 7.8.2 Trek Description and Business Overview
- 7.8.3 Trek Pedelec Sales, Revenue and Gross Margin (2017-2022)
- 7.8.4 Trek Pedelec Products Offered
- 7.9 Bridgestone
- 7.9.1 Bridgestone Corporation Information
- 7.9.2 Bridgestone Description and Business Overview
- 7.9.3 Bridgestone Pedelec Sales, Revenue and Gross Margin (2017-2022)
- 7.9.4 Bridgestone Pedelec Products Offered
- 7.10 Riese & Muller
- 7.10.1 Riese & Muller Corporation Information
- 7.10.2 Riese & Muller Description and Business Overview
- 7.10.3 Riese & Muller Pedelec Sales, Revenue and Gross Margin (2017-2022)
- 7.10.4 Riese & Muller Pedelec Products Offered
- 7.11 Yadea
- 7.11.1 Yadea Corporation Information
- 7.11.2 Yadea Description and Business Overview
- 7.11.3 Yadea Pedelec Sales, Revenue and Gross Margin (2017-2022)
- 7.11.4 Yadea Pedelec Products Offered
- 7.12 Cycleurope
- 7.12.1 Cycleurope Corporation Information
- 7.12.2 Cycleurope Description and Business Overview
- 7.12.3 Cycleurope Pedelec Sales, Revenue and Gross Margin (2017-2022)
- 7.12.4 Cycleurope Pedelec Products Offered
- 7.13 Flyer
- 7.13.1 Flyer Corporation Information
- 7.13.2 Flyer Description and Business Overview
- 7.13.3 Flyer Pedelec Sales, Revenue and Gross Margin (2017-2022)
- 7.13.4 Flyer Pedelec Products Offered
- 7.14 TAILG
- 7.14.1 TAILG Corporation Information
- 7.14.2 TAILG Description and Business Overview
- 7.14.3 TAILG Pedelec Sales, Revenue and Gross Margin (2017-2022)
- 7.14.4 TAILG Pedelec Products Offered
- 7.15 Specialized
- 7.15.1 Specialized Corporation Information
- 7.15.2 Specialized Description and Business Overview
- 7.15.3 Specialized Pedelec Sales, Revenue and Gross Margin (2017-2022)
- 7.15.4 Specialized Pedelec Products Offered
- 7.16 Mustache
- 7.16.1 Mustache Corporation Information
- 7.16.2 Mustache Description and Business Overview
- 7.16.3 Mustache Pedelec Sales, Revenue and Gross Margin (2017-2022)
- 7.16.4 Mustache Pedelec Products Offered
- 7.17 VanMoof
- 7.17.1 VanMoof Corporation Information
- 7.17.2 VanMoof Description and Business Overview
- 7.17.3 VanMoof Pedelec Sales, Revenue and Gross Margin (2017-2022)
- 7.17.4 VanMoof Pedelec Products Offered
- 7.18 Pedego
- 7.18.1 Pedego Corporation Information
- 7.18.2 Pedego Description and Business Overview
- 7.18.3 Pedego Pedelec Sales, Revenue and Gross Margin (2017-2022)
- 7.18.4 Pedego Pedelec Products Offered
- 7.19 Stromer
- 7.19.1 Stromer Corporation Information
- 7.19.2 Stromer Description and Business Overview
- 7.19.3 Stromer Pedelec Sales, Revenue and Gross Margin (2017-2022)
- 7.19.4 Stromer Pedelec Products Offered
- 7.20 Beistegui Hermanos
- 7.20.1 Beistegui Hermanos Corporation Information
- 7.20.2 Beistegui Hermanos Description and Business Overview
- 7.20.3 Beistegui Hermanos Pedelec Sales, Revenue and Gross Margin (2017-2022)
- 7.20.4 Beistegui Hermanos Pedelec Products Offered
8 Industry Chain and Sales Channels Analysis
- 8.1 Pedelec Industry Chain Analysis
- 8.2 Pedelec Key Raw Materials
- 8.2.1 Key Raw Materials
- 8.2.2 Raw Materials Key Suppliers
- 8.3 Pedelec Sales and Marketing
- 8.3.1 Pedelec Sales Channels
- 8.3.2 Pedelec Distributors
- 8.4 Pedelec Customers
9 Research Findings and Conclusion
10 Appendix
- 10.1 Research Methodology
- 10.1.1 Methodology/Research Approach
- 10.1.2 Data Source
- 10.2 Author Details
- 10.3 Disclaimer