|
|
市場調査レポート
商品コード
1109352
世界の外科手術用癒着防止バリア市場(2022年)Global Surgical Adhesion Barrier Market Research Report 2022 - Customized Version |
||||||
|
|
|||||||
|
● お客様のご希望に応じて、既存データの加工や未掲載情報(例:国別セグメント)の追加などの対応が可能です。 詳細はお問い合わせください。 |
|||||||


| 世界の外科手術用癒着防止バリア市場(2022年) |
|
出版日: 2022年08月04日
発行: QYResearch
ページ情報: 英文 125 Pages
納期: 2~3営業日
|
- 全表示
- 概要
- 図表
- 目次
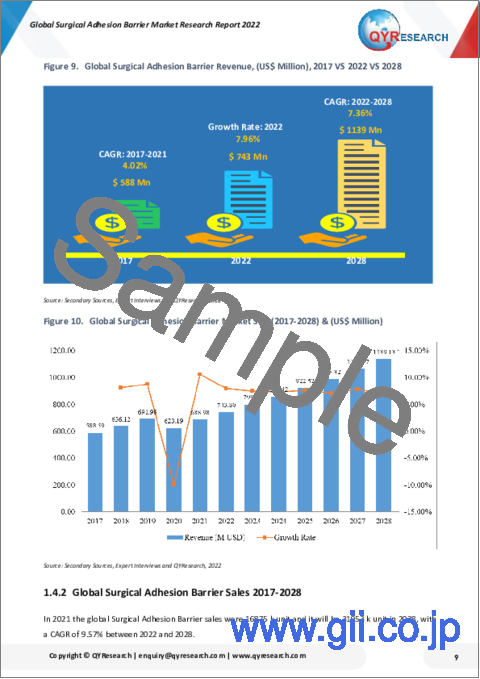
世界の外科手術用癒着防止バリアの市場規模は、2021年に6億8800万米ドルとなり、2022年から2028年の間に7.36%のCAGRで成長する見通しで、2028年までに11億3900万米ドルに達すると予測されています。
外科手術用癒着防止バリアの世界の主要メーカーは、Baxter、J&J、Integra Lifesciences、Sanofi Group、Medtronic、Getinge、BD、Haohai Biological、Yishengtangなどであります。収益面では、2021年の外科手術用癒着防止バリアの市場シェアは世界3大プレイヤーが65.71%を占めています。
本レポートは、世界レベル、地域レベル、企業レベルでの外科手術用癒着防止バリアの数量と価値に焦点を当てています。世界の観点から、本レポートは過去のデータと将来の見通しを分析することで、外科手術用癒着防止バリアの全体的な市場規模を表現しています。地域的には、このレポートはいくつかの主要な地域に焦点を当てています。北米、欧州、アジア太平洋、南米など。
セグメント分析
調査レポートには、地域(国)別、企業別、タイプ別、用途別の具体的なセグメントが含まれています。この調査では、2017年から2028年までの歴史的期間と予測期間における売上高と収益に関する情報を提供しています。セグメントを理解することは、市場の成長を助ける様々な要因の重要性を特定するのに役立ちます。
目次
第1章 外科手術用癒着防止バリア市場の市場概要
- 外科手術用癒着防止バリアの製品概要と適用範囲
- タイプ別:外科手術用癒着防止バリアセグメント
- タイプ別:世界の販売成長率比較(2022-2028)
- フィルム製剤
- ゲル製剤
- 液体製剤
- 用途別:外科手術用癒着防止バリアセグメント
- 用途別:世界の販売比較(2022-2028)
- 腹部手術
- 婦人科手術
- 世界の外科手術用癒着防止バリアの市場規模推計・予測
第2章 メーカー別:外科手術用癒着防止バリアの市場競争
- メーカー別:世界の販売市場シェア(2017-2022)
- メーカー別:世界の収益市場シェア(2017-2022)
- メーカー別:世界の平均価格(2017-2022)
- メーカーの製造拠点、サービス提供エリア、製品タイプ
- 市場の競争情勢と動向
- メーカーの合併と買収、拡張計画
第3章 地域別:外科手術用癒着防止バリア市場のレトロスペクティブシナリオ
- 地域別:世界の販売市場のレトロスペクティブシナリオ(2017-2022)
- 地域別:世界の収益市場のレトロスペクティブシナリオ:(2017-2022)
- 北米:国別市場データ
- 国別:販売
- 国別:収益
- 米国
- カナダ
- メキシコ
- 欧州:国別市場データ
- 国別:販売
- 国別:収益
- ドイツ
- フランス
- 英国
- イタリア
- ロシア
- アジア太平洋:地域別市場データ
- 国別:販売
- 国別:収益
- 中国
- 日本
- 韓国
- インド
- オーストラリア
- 東南アジア
- 南米:国別市場データ
- 国別:販売
- 国別:収益
- ブラジル
- 中東・アフリカ:国別市場データ
- 国別:販売
- 国別:収益
- 中東
- アフリカ
第4章 タイプ別:外科手術用癒着防止バリアの市場実績分析
- タイプ別:世界の外科手術用癒着防止バリア販売市場シェア(2017-2022)
- タイプ別:世界の外科手術用癒着防止バリア収益市場シェア(2017-2022)
- タイプ別:世界の外科手術用癒着防止バリアの価格(2017-2022)
第5章 用途別:外科手術用癒着防止バリアの市場実績分析
- 用途別:世界の外科手術用癒着防止バリア販売市場シェア(2017-2022)
- 用途別:世界の外科手術用癒着防止バリア収益市場シェア(2017-2022)
- 用途別:世界の外科手術用癒着防止バリアの価格(2017-2022)
第6章 主要企業プロファイル
- Baxter
- 企業情報
- 企業・事業概要
- 売上、収益、粗利(2017-2022)
- 製品ポートフォリオ
- 最近の開発/最新情報
- J&J
- 企業情報
- 企業・事業概要
- 売上、収益、粗利(2017-2022)
- 製品ポートフォリオ
- Integra Lifesciences
- 企業情報
- 企業・事業概要
- 売上、収益、粗利(2017-2022)
- 製品ポートフォリオ
- 最近の開発/最新情報
- Medtronic
- 企業情報
- 企業・事業概要
- 売上、収益、粗利(2017-2022)
- 製品ポートフォリオ
- Getinge
- 企業情報
- 企業・事業概要
- 売上、収益、粗利(2017-2022)
- 製品ポートフォリオ
- Haohai Biological
- 企業情報
- 企業・事業概要
- 売上、収益、粗利(2017-2022)
- 製品ポートフォリオ
- Yishengtang
- 企業情報
- 企業・事業概要
- 売上、収益、粗利(2017-2022)
- 製品ポートフォリオ
- Singclean
- 企業情報
- 企業・事業概要
- 売上、収益、粗利(2017-2022)
- 製品ポートフォリオ
- FzioMed
- 企業情報
- 企業・事業概要
- 売上、収益、粗利(2017-2022)
- 製品ポートフォリオ
- MAST Biosurgery
- 企業情報
- 企業・事業概要
- 売上、収益、粗利(2017-2022)
- 製品ポートフォリオ
- Anika Therapeutics
- 企業情報
- 企業・事業概要
- 売上、収益、粗利(2017-2022)
- 製品ポートフォリオ
第7章 外科手術用癒着防止バリアの製造コスト分析
- 外科手術用癒着防止バリアの主要原材料分析
- 製造コスト構造比
- 外科手術用癒着防止バリアの製造プロセス分析
- 外科手術用癒着防止バリアの産業チェーン分析
第8章 マーケティングチャネル、ディストリビューター、および顧客
- マーケティングチャネル
- ディストリビューターリスト
- 顧客
第9章 外科手術用癒着防止バリアの市場力学
- 外科手術用癒着防止バリア業界の動向
- 外科手術用癒着防止バリア市場の促進要因
- 外科手術用癒着防止バリア市場の課題
第10章 世界市場予測
- タイプ別:市場推計・予測
- 用途別:市場推計・予測
- 地域別:市場推計・予測
第11章 調査結果と結論
第12章 調査手法と情報源
LIST OF TABLES
- Table 1. Global Surgical Adhesion Barrier Sales Growth Rate Comparison by Type (2022-2028) & (K Units) & (US$ Million)
- Table 2. Global Surgical Adhesion Barrier Sales Growth Rate Comparison by Application (2022-2028) & (K Units) & (US$ Million)
- Table 3. Global Surgical Adhesion Barrier Market Size by Region (US$ Million): 2017 VS 2021 VS 2028
- Table 4. Global Surgical Adhesion Barrier Market Competitive Situation by Manufacturers in 2021
- Table 5. Global Surgical Adhesion Barrier Sales (K Units) of Key Manufacturers (2017-2022)
- Table 6. Global Surgical Adhesion Barrier Sales Market Share by Manufacturers (2017-2022)
- Table 7. Global Surgical Adhesion Barrier Revenue (US$ Million) by Manufacturers (2017-2022)
- Table 8. Global Surgical Adhesion Barrier Revenue Share by Manufacturers (2017-2022)
- Table 9. Global Market Surgical Adhesion Barrier Average Price (US$/Unit) of Key Manufacturers (2017-2022)
- Table 10. Manufacturers Surgical Adhesion Barrier Manufacturing Sites and Area Served
- Table 11. Manufacturers Surgical Adhesion Barrier Product Type
- Table 12. Global Manufacturers Market Concentration Ratio (CR5 and HHI)
- Table 13. Global Surgical Adhesion Barrier by Company Type (Tier 1, Tier 2, and Tier 3) & (based on the Revenue in Surgical Adhesion Barrier as of 2021)
- Table 14. Manufacturers Mergers & Acquisitions, Expansion Plans
- Table 15. Global Surgical Adhesion Barrier Sales by Region (2017-2022) & (K Units)
- Table 16. Global Surgical Adhesion Barrier Sales Market Share by Region (2017-2022)
- Table 17. Global Surgical Adhesion Barrier Revenue by Region (2017-2022) & (US$ Million)
- Table 18. Global Surgical Adhesion Barrier Revenue Market Share by Region (2017-2022)
- Table 19. North America Surgical Adhesion Barrier Sales by Country (2017-2022) & (K Units)
- Table 20. North America Surgical Adhesion Barrier Sales Market Share by Country (2017-2022)
- Table 21. North America Surgical Adhesion Barrier Revenue by Country (2017-2022) & (US$ Million)
- Table 22. North America Surgical Adhesion Barrier Revenue Market Share by Country (2017-2022)
- Table 23. United States Surgical Adhesion Barrier Sales (2017-2022) & (K Unit)
- Table 24. United States Surgical Adhesion Barrier Sales Market Share (2017-2022)
- Table 25. United States Surgical Adhesion Barrier Revenue (2017-2022) & (US$ Million)
- Table 26. United States Surgical Adhesion Barrier Revenue Market Share (2017-2022)
- Table 27. United States Surgical Adhesion Barrier Market Competitive Situation by Manufacturers in 2021
- Table 28. United States Surgical Adhesion Barrier Sales by Type (2017-2022) & (K Units)
- Table 29. United States Surgical Adhesion Barrier Sales Market Share by Type (2017-2022)
- Table 30. United States Surgical Adhesion Barrier Revenue by Type (2017-2022) & (US$ Million)
- Table 31. United States Surgical Adhesion Barrier Revenue Share by Type (2017-2022)
- Table 32. Europe Surgical Adhesion Barrier Sales by Country (2017-2022) & (K Units)
- Table 33. Europe Surgical Adhesion Barrier Sales Market Share by Country (2017-2022)
- Table 34. Europe Surgical Adhesion Barrier Revenue by Country (2017-2022) & (US$ Million)
- Table 35. Europe Surgical Adhesion Barrier Revenue Market Share by Country (2017-2022)
- Table 36. Asia Pacific Surgical Adhesion Barrier Sales by Region (2017-2022) & (K Units)
- Table 37. Asia Pacific Surgical Adhesion Barrier Sales Market Share by Region (2017-2022)
- Table 38. Asia Pacific Surgical Adhesion Barrier Revenue by Region (2017-2022) & (US$ Million)
- Table 39. Asia Pacific Surgical Adhesion Barrier Revenue Market Share by Region (2017-2022)
- Table 40. Japan Surgical Adhesion Barrier Sales (2017-2022) & (K Unit)
- Table 41. Japan Surgical Adhesion Barrier Sales Market Share (2017-2022)
- Table 42. Japan Surgical Adhesion Barrier Revenue (2017-2022) & (US$ Million)
- Table 43. Japan Surgical Adhesion Barrier Revenue Market Share (2017-2022)
- Table 44. Japan Surgical Adhesion Barrier Market Competitive Situation by Manufacturers in 2021
- Table 45. Japan Surgical Adhesion Barrier Sales by Type (2017-2022) & (K Units)
- Table 46. Japan Surgical Adhesion Barrier Sales Market Share by Type (2017-2022)
- Table 47. Japan Surgical Adhesion Barrier Revenue by Type (2017-2022) & (US$ Million)
- Table 48. Japan Surgical Adhesion Barrier Revenue Share by Type (2017-2022)
- Table 49. South America Surgical Adhesion Barrier Sales by Country (2017-2022) & (K Units)
- Table 50. South America Surgical Adhesion Barrier Sales Market Share by Country (2017-2022)
- Table 51. South America Surgical Adhesion Barrier Revenue by Country (2017-2022) & (US$ Million)
- Table 52. South America Surgical Adhesion Barrier Revenue Market Share by Country (2017-2022)
- Table 53. Middle East and Africa Surgical Adhesion Barrier Sales by Country (2017-2022) & (K Units)
- Table 54. Middle East and Africa Surgical Adhesion Barrier Sales Market Share by Country (2017-2022)
- Table 55. Middle East and Africa Surgical Adhesion Barrier Revenue by Country (2017-2022) & (US$ Million)
- Table 56. Middle East and Africa Surgical Adhesion Barrier Revenue Market Share by Country (2017-2022)
- Table 57. Global Surgical Adhesion Barrier Sales by Type (2017-2022) & (K Units)
- Table 58. Global Surgical Adhesion Barrier Sales Market Share by Type (2017-2022)
- Table 59. Global Surgical Adhesion Barrier Revenue by Type (2017-2022) & (US$ Million)
- Table 60. Global Surgical Adhesion Barrier Revenue Share by Type (2017-2022)
- Table 61. Global Surgical Adhesion Barrier Price by Type (2017-2022) & (US$/Unit)
- Table 62. Global Surgical Adhesion Barrier Sales (K Units) by Application (2017-2022)
- Table 63. Global Surgical Adhesion Barrier Sales Market Share by Application (2017-2022)
- Table 64. Global Surgical Adhesion Barrier Revenue by Application (2017-2022) & (US$ Million)
- Table 65. Global Surgical Adhesion Barrier Revenue Share by Application (2017-2022)
- Table 66. Global Surgical Adhesion Barrier Price by Application (2017-2022) & (US$/Unit)
- Table 67. Baxter Corporation Information
- Table 68. Baxter Description and Business Overview
- Table 69. Baxter Surgical Adhesion Barrier Sales (K Units), Revenue (US$ Million), Price (US$/Unit) and Gross Margin (2017-2022)
- Table 70. Baxter Surgical Adhesion Barrier Product
- Table 71. Baxter Recent Developments/Updates
- Table 72. J&J Corporation Information
- Table 73. J&J Description and Business Overview
- Table 74. J&J Surgical Adhesion Barrier Sales (K Units), Revenue (US$ Million), Price (US$/Unit) and Gross Margin (2017-2022)
- Table 75. J&J Surgical Adhesion Barrier Product
- Table 76. Integra Lifesciences Corporation Information
- Table 77. Integra Lifesciences Description and Business Overview
- Table 78. Integra Lifesciences Surgical Adhesion Barrier Sales (K Units), Revenue (US$ Million), Price (US$/Unit) and Gross Margin (2017-2022)
- Table 79. Integra Lifesciences Surgical Adhesion Barrier Product
- Table 80. Integra Lifesciences Recent Developments/Updates
- Table 81. Medtronic Corporation Information
- Table 82. Medtronic Description and Business Overview
- Table 83. Medtronic Surgical Adhesion Barrier Sales (K Units), Revenue (US$ Million), Price (US$/Unit) and Gross Margin (2017-2022)
- Table 84. Medtronic Surgical Adhesion Barrier Product
- Table 85. Getinge Corporation Information
- Table 86. Getinge Description and Business Overview
- Table 87. Getinge Surgical Adhesion Barrier Sales (K Units), Revenue (US$ Million), Price (US$/Unit) and Gross Margin (2017-2022)
- Table 88. Getinge Surgical Adhesion Barrier Product
- Table 89. Haohai Biological Corporation Information
- Table 90. Haohai Biological Description and Business Overview
- Table 91. Haohai Biological Surgical Adhesion Barrier Sales (K Units), Revenue (US$ Million), Price (US$/Unit) and Gross Margin (2017-2022)
- Table 92. Haohai Biological Surgical Adhesion Barrier Product
- Table 93. Yishengtang Corporation Information
- Table 94. Yishengtang Description and Business Overview
- Table 95. Yishengtang Surgical Adhesion Barrier Sales (K Units), Revenue (US$ Million), Price (US$/Unit) and Gross Margin (2017-2022)
- Table 96. Yishengtang Surgical Adhesion Barrier Product
- Table 97. Singclean Corporation Information
- Table 98. Singclean Description and Business Overview
- Table 99. Singclean Surgical Adhesion Barrier Sales (K Units), Revenue (US$ Million), Price (US$/Unit) and Gross Margin (2017-2022)
- Table 100. Singclean Surgical Adhesion Barrier Product
- Table 101. FzioMed Corporation Information
- Table 102. FzioMed Description and Business Overview
- Table 103. FzioMed Surgical Adhesion Barrier Sales (K Units), Revenue (US$ Million), Price (US$/Unit) and Gross Margin (2017-2022)
- Table 104. FzioMed Surgical Adhesion Barrier Product
- Table 105. MAST Biosurgery Corporation Information
- Table 106. MAST Biosurgery Description and Business Overview
- Table 107. MAST Biosurgery Surgical Adhesion Barrier Sales (K Units), Revenue (US$ Million), Price (US$/Unit) and Gross Margin (2017-2022)
- Table 108. MAST Biosurgery Surgical Adhesion Barrier Product
- Table 109. Anika Therapeutics Corporation Information
- Table 110. Anika Therapeutics Description and Business Overview
- Table 111. Anika Therapeutics Surgical Adhesion Barrier Sales (K Units), Revenue (US$ Million), Price (US$/Unit) and Gross Margin (2017-2022)
- Table 112. Anika Therapeutics Surgical Adhesion Barrier Product
- Table 113. Production Base and Market Concentration Rate of Raw Material
- Table 114. Key Suppliers of Raw Materials
- Table 115. Key Suppliers of Raw Materials
- Table 116. Manufacturing Cost Structure of Surgical Adhesion Barrier
- Table 117. Surgical Adhesion Barrier Distributors List
- Table 118. Surgical Adhesion Barrier Customers List
- Table 119. Surgical Adhesion Barrier Market Drivers
- Table 120. Global Surgical Adhesion Barrier Sales Forecast by Type (2023-2028) & (K Units)
- Table 121. Global Surgical Adhesion Barrier Sales Market Share Forecast by Type (2023-2028)
- Table 122. Global Surgical Adhesion Barrier Revenue Forecast by Type (2023-2028) & (US$ Million)
- Table 123. Global Surgical Adhesion Barrier Revenue Market Share Forecast by Type (2023-2028)
- Table 124. Global Surgical Adhesion Barrier Sales Forecast by Application (2023-2028) & (K Units)
- Table 125. Global Surgical Adhesion Barrier Sales Market Share Forecast by Application (2023-2028)
- Table 126. Global Surgical Adhesion Barrier Revenue Forecast by Application (2023-2028) & (US$ Million)
- Table 127. Global Surgical Adhesion Barrier Revenue Market Share Forecast by Application (2023-2028)
- Table 128. Global Surgical Adhesion Barrier Sales Forecast by Region (2023-2028) & (K Units)
- Table 129. Global Surgical Adhesion Barrier Sales Market Share Forecast by Region (2023-2028)
- Table 130. Global Surgical Adhesion Barrier Revenue Forecast by Region (2023-2028) & (US$ Million)
- Table 131. Global Surgical Adhesion Barrier Revenue Market Share Forecast by Region (2023-2028)
- Table 132. Research Programs/Design for This Report
- Table 133. Key Data Information from Secondary Sources
- Table 134. Key Data Information from Primary Sources
List of Figures
- Figure 1. Product Picture of Surgical Adhesion Barrier
- Figure 2. Global Surgical Adhesion Barrier Market Share by Type: 2022 & 2028
- Figure 3. Film Formulation Product Picture
- Figure 4. Gel Formulation Product Picture
- Figure 5. Liquid Formulation Product Picture
- Figure 6. Global Surgical Adhesion Barrier Market Share by Application: 2022 & 2028
- Figure 7. Abdominal Surgery
- Figure 8. Gynecological Surgery
- Figure 9. Global Surgical Adhesion Barrier Revenue, (US$ Million), 2017 VS 2022 VS 2028
- Figure 10. Global Surgical Adhesion Barrier Market Size (2017-2028) & (US$ Million)
- Figure 11. Global Surgical Adhesion Barrier Sales (2017-2028) & (K Units)
- Figure 12. Surgical Adhesion Barrier Sales Share by Manufacturers in 2021
- Figure 13. Global Surgical Adhesion Barrier Revenue Share by Manufacturers in 2021
- Figure 14. Global 5 Largest Surgical Adhesion Barrier Players: Market Share by Revenue in Surgical Adhesion Barrier in 2021
- Figure 15. North America Surgical Adhesion Barrier Sales Market Share by Country in 2021
- Figure 16. United States Surgical Adhesion Barrier Revenue Growth Rate (2017-2022) & (US$ Million)
- Figure 17. Canada Surgical Adhesion Barrier Revenue Growth Rate (2017-2022) & (US$ Million)
- Figure 18. Mexico Surgical Adhesion Barrier Revenue Growth Rate (2017-2022) & (US$ Million)
- Figure 19. Germany Surgical Adhesion Barrier Revenue Growth Rate (2017-2022) & (US$ Million)
- Figure 20. France Surgical Adhesion Barrier Revenue Growth Rate (2017-2022) & (US$ Million)
- Figure 21. U.K. Surgical Adhesion Barrier Revenue Growth Rate (2017-2022) & (US$ Million)
- Figure 22. Italy Surgical Adhesion Barrier Revenue Growth Rate (2017-2022) & (US$ Million)
- Figure 23. Russia Surgical Adhesion Barrier Revenue Growth Rate (2017-2022) & (US$ Million)
- Figure 24. China Surgical Adhesion Barrier Revenue Growth Rate (2017-2022) & (US$ Million)
- Figure 25. Japan Surgical Adhesion Barrier Revenue Growth Rate (2017-2022) & (US$ Million)
- Figure 26. South Korea Surgical Adhesion Barrier Revenue Growth Rate (2017-2022) & (US$ Million)
- Figure 27. India Surgical Adhesion Barrier Revenue Growth Rate (2017-2022) & (US$ Million)
- Figure 28. Australia Surgical Adhesion Barrier Revenue Growth Rate (2017-2022) & (US$ Million)
- Figure 29. Southeast Asia Surgical Adhesion Barrier Revenue Growth Rate (2017-2022) & (US$ Million)
- Figure 30. Brazil Surgical Adhesion Barrier Revenue Growth Rate (2017-2022) & (US$ Million)
- Figure 31. Middle East Surgical Adhesion Barrier Revenue Growth Rate (2017-2022) & (US$ Million)
- Figure 32. Africa Surgical Adhesion Barrier Revenue Growth Rate (2017-2022) & (US$ Million)
- Figure 33. Sales Market Share of Surgical Adhesion Barrier by Type (2017-2022)
- Figure 34. Manufacturing Process Analysis of Surgical Adhesion Barrier
- Figure 35. Surgical Adhesion Barrier Industrial Chain Analysis
- Figure 36. Channels of Distribution
- Figure 37. Distributors Profiles
- Figure 38. Bottom-up and Top-down Approaches for This Report
- Figure 39. Data Triangulation
- Figure 40. Key Executives Interviewed 106
In 2021, the global Surgical Adhesion Barrier market size was US$ 688 million and it will reach US$ 1139 million in 2028, growing at CAGR of 7.36% between 2022 and 2028.
The global major manufacturers of Surgical Adhesion Barrier include Baxter, J&J, Integra Lifesciences, Sanofi Group, Medtronic, Getinge, BD, Haohai Biological, and Yishengtang, etc. In terms of revenue, the global 3 largest players have a 65.71% market share of Surgical Adhesion Barrier in 2021.
This report focuses on Surgical Adhesion Barrier volume and value at the global level, regional level, and company level. From a global perspective, this report represents overall Surgical Adhesion Barrier market size by analysing historical data and future prospect. Regionally, this report focuses on several key regions: North America, Europe, Asia-Pacific, South America etc.
Segment Analysis:
The research report includes specific segments by region (country), by company, by Type and by Application. This study provides information about the sales and revenue during the historic and forecasted period of 2017 to 2028. Understanding the segments helps in identifying the importance of different factors that aid the market growth.
By Company
- Baxter
- J&J
- Integra Lifesciences
- Medtronic
- Getinge
- Haohai Biological
- Yishengtang
- Singclean
- FzioMed
- MAST Biosurgery
- Anika Therapeutics
Segment by Type
- Film Formulation
- Gel Formulation
- Liquid Formulation
Segment by Application
- Abdominal Surgery
- Gynecological Surgery
- Others
By Region
- North America
- United States
- Canada
- Mexico
- Asia-Pacific
- China
- Japan
- Korea
- India
- Southeast Asia
- Australia
- Europe
- Germany
- France
- U.K.
- Italy
- Russia
- South America
- Brazil
- Middle East & Africa
- Middle East
- Africa
TABLE OF CONTENTS
1 SURGICAL ADHESION BARRIER MARKET OVERVIEW
- 1.1 Product Overview and Scope of Surgical Adhesion Barrier
- 1.2 Surgical Adhesion Barrier Segment by Type
- 1.2.1 Global Surgical Adhesion Barrier Sales Growth Rate Comparison by Type (2022-2028)
- 1.2.2 Film Formulation
- 1.2.3 Gel Formulation
- 1.2.4 Liquid Formulation
- 1.3 Surgical Adhesion Barrier Segment by Application
- 1.3.1 Global Surgical Adhesion Barrier Sales Comparison by Application (2022-2028)
- 1.3.2 Abdominal Surgery
- 1.3.3 Gynecological Surgery
- 1.4 Global Surgical Adhesion Barrier Market Size Estimates and Forecasts
- 1.4.1 Global Surgical Adhesion Barrier Revenue 2017-2028
- 1.4.2 Global Surgical Adhesion Barrier Sales 2017-2028
- 1.4.3 Surgical Adhesion Barrier Market Size by Region: 2017 Versus 2021 Versus 2028
2 SURGICAL ADHESION BARRIER MARKET COMPETITION BY MANUFACTURERS
- 2.1 Global Surgical Adhesion Barrier Sales Market Share by Manufacturers (2017-2022)
- 2.2 Global Surgical Adhesion Barrier Revenue Market Share by Manufacturers (2017-2022)
- 2.3 Global Surgical Adhesion Barrier Average Price by Manufacturers (2017-2022)
- 2.4 Manufacturers Surgical Adhesion Barrier Manufacturing Sites, Area Served, Product Type
- 2.5 Surgical Adhesion Barrier Market Competitive Situation and Trends
- 2.5.1 Surgical Adhesion Barrier Market Concentration Rate
- 2.5.2 The Global 5 Largest Surgical Adhesion Barrier Players Market Share by Revenue
- 2.5.3 Global Surgical Adhesion Barrier by Company Type (Tier 1, Tier 2, and Tier 3)
- 2.6 Manufacturers Mergers & Acquisitions, Expansion Plans
3 SURGICAL ADHESION BARRIER RETROSPECTIVE MARKET SCENARIO BY REGION
- 3.1 Global Surgical Adhesion Barrier Retrospective Market Scenario in Sales by Region: 2017-2022
- 3.2 Global Surgical Adhesion Barrier Retrospective Market Scenario in Revenue by Region: 2017-2022
- 3.3 North America Surgical Adhesion Barrier Market Facts & Figures by Country
- 3.3.1 North America Surgical Adhesion Barrier Sales by Country
- 3.3.2 North America Surgical Adhesion Barrier Revenue by Country
- 3.3.3 United States
- 3.3.4 Canada
- 3.3.5 Mexico
- 3.4 Europe Surgical Adhesion Barrier Market Facts & Figures by Country
- 3.4.1 Europe Surgical Adhesion Barrier Sales by Country
- 3.4.2 Europe Surgical Adhesion Barrier Revenue by Country
- 3.4.3 Germany
- 3.4.4 France
- 3.4.5 U.K.
- 3.4.6 Italy
- 3.4.7 Russia
- 3.5 Asia Pacific Surgical Adhesion Barrier Market Facts & Figures by Region
- 3.5.1 Asia Pacific Surgical Adhesion Barrier Sales by Region
- 3.5.2 Asia Pacific Surgical Adhesion Barrier Revenue by Region
- 3.5.3 China
- 3.5.4 Japan
- 3.5.5 South Korea
- 3.5.6 India
- 3.5.7 Australia
- 3.5.8 Southeast Asia
- 3.6 South America Surgical Adhesion Barrier Market Facts & Figures by Country
- 3.6.1 South America Surgical Adhesion Barrier Sales by Country
- 3.6.2 South America Surgical Adhesion Barrier Revenue by Country
- 3.6.3 Brazil
- 3.7 Middle East and Africa Surgical Adhesion Barrier Market Facts & Figures by Country
- 3.7.1 Middle East and Africa Surgical Adhesion Barrier Sales by Country
- 3.7.2 Middle East and Africa Surgical Adhesion Barrier Revenue by Country
- 3.7.3 Middle East
- 3.7.4 Africa
4 SURGICAL ADHESION BARRIER HISTORIC MARKET ANALYSIS BY TYPE
- 4.1 Global Surgical Adhesion Barrier Sales Market Share by Type (2017-2022)
- 4.2 Global Surgical Adhesion Barrier Revenue Market Share by Type (2017-2022)
- 4.3 Global Surgical Adhesion Barrier Price by Type (2017-2022)
5 SURGICAL ADHESION BARRIER HISTORIC MARKET ANALYSIS BY APPLICATION
- 5.1 Global Surgical Adhesion Barrier Sales Market Share by Application (2017-2022)
- 5.2 Global Surgical Adhesion Barrier Revenue Market Share by Application (2017-2022)
- 5.3 Global Surgical Adhesion Barrier Price by Application (2017-2022)
6 KEY COMPANIES PROFILED
- 6.1 Baxter
- 6.1.1 Baxter Corporation Information
- 6.1.2 Baxter Description and Business Overview
- 6.1.3 Baxter Surgical Adhesion Barrier Sales, Revenue and Gross Margin (2017-2022)
- 6.1.4 Baxter Surgical Adhesion Barrier Product Portfolio
- 6.1.5 Baxter Recent Developments/Updates
- 6.2 J&J
- 6.2.1 J&J Corporation Information
- 6.2.2 J&J Description and Business Overview
- 6.2.3 J&J Surgical Adhesion Barrier Sales, Revenue and Gross Margin (2017-2022)
- 6.2.4 J&J Surgical Adhesion Barrier Product Portfolio
- 6.3 Integra Lifesciences
- 6.3.1 Integra Lifesciences Corporation Information
- 6.3.2 Integra Lifesciences Description and Business Overview
- 6.3.3 Integra Lifesciences Surgical Adhesion Barrier Sales, Revenue and Gross Margin (2017-2022)
- 6.3.4 Integra Lifesciences Surgical Adhesion Barrier Product Portfolio
- 6.3.5 Integra Lifesciences Recent Developments/Updates
- 6.4 Medtronic
- 6.4.1 Medtronic Corporation Information
- 6.4.2 Medtronic Description and Business Overview
- 6.4.3 Medtronic Surgical Adhesion Barrier Sales, Revenue and Gross Margin (2017-2022)
- 6.4.4 Medtronic Surgical Adhesion Barrier Product Portfolio
- 6.5 Getinge
- 6.5.1 Getinge Corporation Information
- 6.5.2 Getinge Description and Business Overview
- 6.5.3 Getinge Surgical Adhesion Barrier Sales, Revenue and Gross Margin (2017-2022)
- 6.5.4 Getinge Surgical Adhesion Barrier Product Portfolio
- 6.6 Haohai Biological
- 6.6.1 Haohai Biological Corporation Information
- 6.6.2 Haohai Biological Description and Business Overview
- 6.6.3 Haohai Biological Surgical Adhesion Barrier Sales, Revenue and Gross Margin (2017-2022)
- 6.6.4 Haohai Biological Surgical Adhesion Barrier Product Portfolio
- 6.7 Yishengtang
- 6.7.1 Yishengtang Corporation Information
- 6.7.2 Yishengtang Description and Business Overview
- 6.7.3 Yishengtang Surgical Adhesion Barrier Sales, Revenue and Gross Margin (2017-2022)
- 6.7.4 Yishengtang Surgical Adhesion Barrier Product Portfolio
- 6.8 Singclean
- 6.8.1 Singclean Corporation Information
- 6.8.2 Singclean Description and Business Overview
- 6.8.3 Singclean Surgical Adhesion Barrier Sales, Revenue and Gross Margin (2017-2022)
- 6.8.4 Singclean Surgical Adhesion Barrier Product Portfolio
- 6.9 FzioMed
- 6.9.1 FzioMed Corporation Information
- 6.9.2 FzioMed Description and Business Overview
- 6.9.3 FzioMed Surgical Adhesion Barrier Sales, Revenue and Gross Margin (2017-2022)
- 6.9.4 FzioMed Surgical Adhesion Barrier Product Portfolio
- 6.10 MAST Biosurgery
- 6.10.1 MAST Biosurgery Corporation Information
- 6.10.2 MAST Biosurgery Description and Business Overview
- 6.10.3 MAST Biosurgery Surgical Adhesion Barrier Sales, Revenue and Gross Margin (2017-2022)
- 6.10.4 MAST Biosurgery Surgical Adhesion Barrier Product Portfolio
- 6.11 Anika Therapeutics
- 6.11.1 Anika Therapeutics Corporation Information
- 6.11.2 Anika Therapeutics Description and Business Overview
- 6.11.3 Anika Therapeutics Surgical Adhesion Barrier Sales, Revenue and Gross Margin (2017-2022)
- 6.11.4 Anika Therapeutics Surgical Adhesion Barrier Product Portfolio
7 SURGICAL ADHESION BARRIER MANUFACTURING COST ANALYSIS
- 7.1 Surgical Adhesion Barrier Key Raw Materials Analysis
- 7.1.1 Key Raw Materials
- 7.1.2 Key Suppliers of Raw Materials
- 7.2 Proportion of Manufacturing Cost Structure
- 7.3 Manufacturing Process Analysis of Surgical Adhesion Barrier
- 7.4 Surgical Adhesion Barrier Industrial Chain Analysis
8 MARKETING CHANNEL, DISTRIBUTORS AND CUSTOMERS
- 8.1 Marketing Channel
- 8.2 Surgical Adhesion Barrier Distributors List
- 8.3 Surgical Adhesion Barrier Customers
9 SURGICAL ADHESION BARRIER MARKET DYNAMICS
- 9.1 Surgical Adhesion Barrier Industry Trends
- 9.2 Surgical Adhesion Barrier Market Drivers
- 9.3 Surgical Adhesion Barrier Market Challenges
10 GLOBAL MARKET FORECAST
- 10.1 Surgical Adhesion Barrier Market Estimates and Projections by Type
- 10.1.1 Global Forecasted Sales of Surgical Adhesion Barrier by Type (2023-2028)
- 10.1.2 Global Forecasted Revenue of Surgical Adhesion Barrier by Type (2023-2028)
- 10.2 Surgical Adhesion Barrier Market Estimates and Projections by Application
- 10.2.1 Global Forecasted Sales of Surgical Adhesion Barrier by Application (2023-2028)
- 10.2.2 Global Forecasted Revenue of Surgical Adhesion Barrier by Application (2023-2028)
- 10.3 Surgical Adhesion Barrier Market Estimates and Projections by Region
- 10.3.1 Global Forecasted Sales of Surgical Adhesion Barrier by Region (2023-2028)
- 10.3.2 Global Forecasted Revenue of Surgical Adhesion Barrier by Region (2023-2028)
11 RESEARCH FINDINGS AND CONCLUSION
12 METHODOLOGY AND DATA SOURCE
- 12.1 Methodology/Research Approach
- 12.1.1 Research Programs/Design
- 12.1.2 Market Size Estimation
- 12.1.3 Market Breakdown and Data Triangulation
- 12.2 Data Source
- 12.2.1 Secondary Sources
- 12.2.2 Primary Sources
- 12.3 Author List
- 12.4 Disclaimer