|
|
市場調査レポート
商品コード
1109349
ピエゾ抵抗型力覚センサーの世界市場 - 実績・予測:2017年~2028年Global Piezoresistive Force Sensors Market Report, History and Forecast 2017-2028 |
||||||
|
|
|||||||
|
● お客様のご希望に応じて、既存データの加工や未掲載情報(例:国別セグメント)の追加などの対応が可能です。 詳細はお問い合わせください。 |
|||||||


| ピエゾ抵抗型力覚センサーの世界市場 - 実績・予測:2017年~2028年 |
|
出版日: 2022年08月04日
発行: QYResearch
ページ情報: 英文 162 Pages
納期: 2~3営業日
|
- 全表示
- 概要
- 図表
- 目次
COVID-19の大流行により、世界のピエゾ抵抗型力覚センサーの市場規模は、2021年に7億258万米ドルとなり、2028年までに11億2,164万米ドルに再調整され、予測期間(2022年~2028年)にはCAGRで6.61%の成長が予測されています。
世界のピエゾ抵抗型力覚センサーの主要メーカーは、Nissha、New Degree Technology、Citizen Electronics、Memtronik、Tekscan、Butler Technologies、Hanwei Electronics Groupなどです。2021年、世界の6大企業が収益で約61.85%のシェアを有しています。
北米のピエゾ抵抗型力覚センサーの市場規模は、2021年に1億5,403万米ドルでした。欧州のピエゾ抵抗型力覚センサーの情勢は、2028年までに2億1,785万米ドルに達すると予測されています。
COVID-19による経済変化を十分に考慮すると、2021年にピエゾ抵抗型力覚センサーの世界市場の60.77%を占めているシャントモードFSRは、2028年までに6億5,605万米ドルとなり、2022年から2028年までのCAGRで改訂6.03%の成長が予測されています。モバイルデバイスセグメントは、この予測期間を通してCAGRで4.02%に変更され、2028年には約35.84%のシェアを占めると予測されています。
目次
第1章 ピエゾ抵抗型力覚センサー市場概要
- ピエゾ抵抗型力覚センサー製品概要
- ピエゾ抵抗型力覚センサー市場セグメント:タイプ別
- シャントモードFSR
- スルーモードFSR
- 世界のピエゾ抵抗型力覚センサーの市場規模:タイプ別
- 主要地域の市場規模セグメント:タイプ別
第2章 ピエゾ抵抗型力覚センサー市場競合:企業別
- 世界の主要企業:ピエゾ抵抗型力覚センサーの販売別(2017年~2022年)
- 世界の主要企業:ピエゾ抵抗型力覚センサーの収益別(2017年~2022年)
- 世界の主要企業:ピエゾ抵抗型力覚センサーの価格別(2017年~2022年)
- 世界のピエゾ抵抗型力覚センサー主要メーカーの製造拠点分布・販売エリア・製品タイプ
- ピエゾ抵抗型力覚センサー市場の競合状況と動向
- 世界の主要メーカー:企業タイプ別(ティア1、ティア2、ティア3)
- ピエゾ抵抗型力覚センサー主要メーカーの設立日
- ピエゾ抵抗型力覚センサー主要メーカーの提供製品
- M&A、拡張
第3章 ピエゾ抵抗型力覚センサーの状況と見通し:地域別
- 世界のピエゾ抵抗型力覚センサーの市場規模とCAGR:地域別(2017年、2021年、2028年)
- 世界のピエゾ抵抗型力覚センサーの過去の市場規模:地域別
- 世界のピエゾ抵抗型力覚センサーの市場規模予測:地域別
第4章 ピエゾ抵抗型力覚センサー:用途別
- ピエゾ抵抗型力覚センサー市場セグメント:用途別
- モバイルデバイス
- ウェアラブルデバイス
- 自動車
- 医療機器
- 家庭用電化製品
- その他
- 世界のピエゾ抵抗型力覚センサーの市場規模:用途別
- 主要地域の市場規模セグメント:用途別
第5章 ピエゾ抵抗型力覚センサー事業の企業プロファイルと主要数値
- NEXTINPUT (QORVO)
- INTERLINK
- TEKSCAN
- NISSHA
- SENSITRONICS
- TANGIO PRINTED ELECTRONICS (SYTEK)
- OHMITE
- CUBBISON
- REID INDUSTRIAL GRAPHIC PRODUCTS
- CITIZEN ELECTRONICS
- BUTLER TECHNOLOGIES
- MEMTRONIK
- TECHPRINT
- HANWEI ELECTRONICS GROUP
- NEW DEGREE TECHNOLOGY
- FSRTEK
- TAIWAN ALPHA ELECTRONIC
- CERADEX
- RUIHU
- LEGACT
- FPSEN
第6章 アップストリーム・機会・課題・リスク・影響要因分析
- ピエゾ抵抗型力覚センサーの主要原材料
- 製造コスト構造
- ピエゾ抵抗型力覚センサーの業界チェーン分析
- ピエゾ抵抗型力覚センサーの市場力学
第7章 マーケティング戦略分析・ディストリビューター
- 販売チャンネル
- ピエゾ抵抗型力覚センサーのディストリビューター
- ピエゾ抵抗型力覚センサーのダウンストリームの顧客
第8章 調査結果・結論
第9章 付録
LIST OF TABLES
- Table 1. Global Piezoresistive Force Sensors Sales by Type: 2017 VS 2021 VS 2028 (US$ Million)
- Table 2. Global Piezoresistive Force Sensors Sales by Type (2017-2022) & (M Units)
- Table 3. Global Piezoresistive Force Sensors Sales Market Share in Volume by Type (2017-2022)
- Table 4. Global Piezoresistive Force Sensors Sales by Type (2017-2022) & (US$ Million)
- Table 5. Global Piezoresistive Force Sensors Sales Market Share in Value by Type (2017-2022)
- Table 6. Global Piezoresistive Force Sensors Price by Type (2017-2022) & (US$/K Units)
- Table 7. Global Piezoresistive Force Sensors Sales by Type (2023-2028) & (M Units)
- Table 8. Global Piezoresistive Force Sensors Sales Market Share in Volume by Type (2023-2028)
- Table 9. Global Piezoresistive Force Sensors Sales by Type (2023-2028) & (US$ Million)
- Table 10. Global Piezoresistive Force Sensors Sales Market Share in Value by Type (2023-2028)
- Table 11. Global Piezoresistive Force Sensors Price by Type (2023-2028) & (US$/K Units)
- Table 12. North America Piezoresistive Force Sensors Sales by Type (2017-2022) & (M Units)
- Table 13. North America Piezoresistive Force Sensors Sales by Type (2017-2022) & (US$ Million)
- Table 14. Europe Piezoresistive Force Sensors Sales (M Units) by Type (2017-2022)
- Table 15. Europe Piezoresistive Force Sensors Sales by Type (2017-2022) & (US$ Million)
- Table 16. Asia-Pacific Piezoresistive Force Sensors Sales (M Units) by Type (2017-2022)
- Table 17. Asia-Pacific Piezoresistive Force Sensors Sales by Type (2017-2022) & (US$ Million)
- Table 18. Latin America Piezoresistive Force Sensors Sales (M Units) by Type (2017-2022)
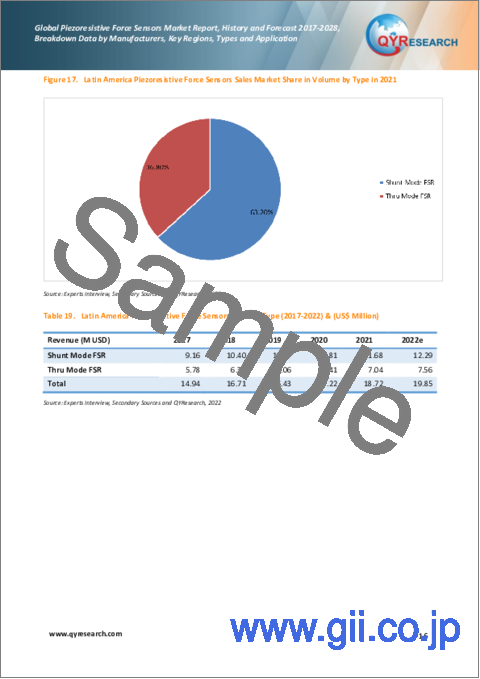
- Table 19. Latin America Piezoresistive Force Sensors Sales by Type (2017-2022) & (US$ Million)
- Table 20. Middle East and Africa Piezoresistive Force Sensors Sales (M Units) by Type (2017-2022)
- Table 21. Middle East and Africa Piezoresistive Force Sensors Sales by Type (2017-2022) & (US$ Million)
- Table 22. Global Piezoresistive Force Sensors Sales by Company (2017-2022) & (M Units)
- Table 23. Global Piezoresistive Force Sensors Sales Share by Company (2017-2022)
- Table 24. Global Piezoresistive Force Sensors Revenue by Company (2017-2022) & (US$ Million)
- Table 25. Global Piezoresistive Force Sensors Revenue Share by Company (2017-2022)
- Table 26. Global Market Piezoresistive Force Sensors Price by Company (2017-2022) & (US$/K Units)
- Table 27. Global Piezoresistive Force Sensors Top Manufacturers Manufacturing Base Distribution and Sales Area
- Table 28. Global Piezoresistive Force Sensors Manufacturers Market Concentration Ratio (CR5)
- Table 29. Global Top Manufacturers Market Share by Company Type (Tier 1, Tier 2, and Tier 3) & (based on the Revenue in Piezoresistive Force Sensors as of 2021)
- Table 30. Establish Date of Key Key Piezoresistive Force Sensors Manufacturers
- Table 31. Key Manufacturers Piezoresistive Force Sensors Product Type
- Table 32. Mergers & Acquisitions, Expansion Plans
- Table 33. Global Piezoresistive Force Sensors Market Size Comparison by Region (US$ Million): 2017 VS 2021 VS 2028
- Table 34. Global Piezoresistive Force Sensors Sales by Region (2017-2022) & (M Units)
- Table 35. Global Piezoresistive Force Sensors Sales Market Share in Volume by Region (2017-2022)
- Table 36. Global Piezoresistive Force Sensors Sales by Region (2017-2022) & (US$ Million)
- Table 37. Global Piezoresistive Force Sensors Sales Market Share in Value by Region (2017-2022)
- Table 38. Global Piezoresistive Force Sensors Sales (M Units), Value (US$ Million), Price (US$/K Units)
- Table 39. Global Piezoresistive Force Sensors Sales by Region (2023-2028) & (M Units)
- Table 40. Global Piezoresistive Force Sensors Sales Market Share in Volume by Region (2023-2028)
- Table 41. Global Piezoresistive Force Sensors Sales by Region (2023-2028) & (US$ Million)
- Table 42. Global Piezoresistive Force Sensors Sales Market Share in Value by Region (2023-2028)
- Table 43. Global Piezoresistive Force Sensors Sales (M Units), Value (US$ Million), Price (US$/K Units) (2023-2028)
- Table 44. Global Piezoresistive Force Sensors Sales by Application: 2017 VS 2021 VS 2028 (US$ Million)
- Table 45. Global Piezoresistive Force Sensors Sales by Application (2017-2022) & (M Units)
- Table 46. Global Piezoresistive Force Sensors Sales Market Share in Volume by Application (2017-2022)
- Table 47. Global Piezoresistive Force Sensors Sales by Application (2017-2022) & (US$ Million)
- Table 48. Global Piezoresistive Force Sensors Sales Market Share in Value by Application (2017-2022)
- Table 49. Global Piezoresistive Force Sensors Price by Application (2017-2022) & (US$/K Units)
- Table 50. Global Piezoresistive Force Sensors Sales by Application (2023-2028) & (M Units)
- Table 51. Global Piezoresistive Force Sensors Sales Market Share in Volume by Application (2023-2028)
- Table 52. Global Piezoresistive Force Sensors Sales by Application (2023-2028) & (US$ Million)
- Table 53. Global Piezoresistive Force Sensors Sales Market Share in Value by Application (2023-2028)
- Table 54. Global Piezoresistive Force Sensors Price by Application (2023-2028) & (US$/K Units)
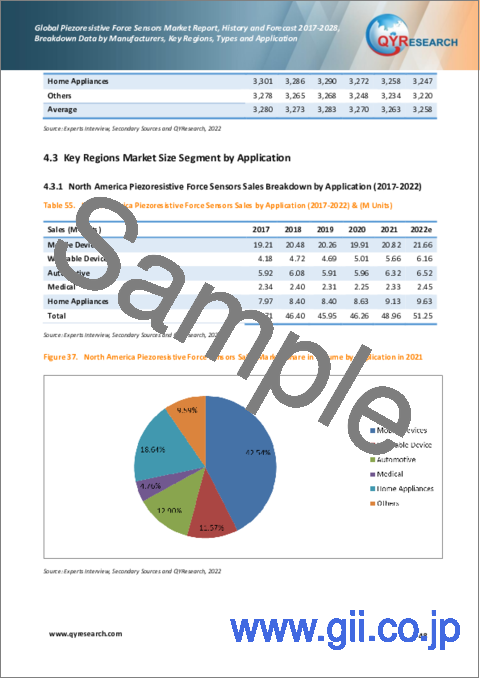
- Table 55. North America Piezoresistive Force Sensors Sales by Application (2017-2022) & (M Units)
- Table 56. North America Piezoresistive Force Sensors Sales by Application (2017-2022) & (US$ Million)
- Table 57. Europe Piezoresistive Force Sensors Sales (M Units) by Application (2017-2022)
- Table 58. Europe Piezoresistive Force Sensors Sales by Application (2017-2022) & (US$ Million)
- Table 59. Asia-Pacific Piezoresistive Force Sensors Sales (M Units) by Application (2017-2022)
- Table 60. Asia-Pacific Piezoresistive Force Sensors Sales by Application (2017-2022) & (US$ Million)
- Table 61. Latin America Piezoresistive Force Sensors Sales (M Units) by Application (2017-2022)
- Table 62. Latin America Piezoresistive Force Sensors Sales by Application (2017-2022) & (US$ Million)
- Table 63. Middle East and Africa Piezoresistive Force Sensors Sales (M Units) by Application (2017-2022)
- Table 64. Middle East and Africa Piezoresistive Force Sensors Sales by Application (2017-2022) & (US$ Million)
- Table 65. NextInput (Qorvo) Corporation Information
- Table 66. NextInput (Qorvo) Introduction and Business Overview
- Table 67. NextInput (Qorvo) Piezoresistive Force Sensors Sales (M Units), Revenue (US$ Million), Price (US$/K Units) and Gross Margin (2017-2022)
- Table 68. NextInput (Qorvo) Piezoresistive Force Sensors Product
- Table 69. NextInput (Qorvo) Recent Development
- Table 70. Interlink Corporation Information
- Table 71. Interlink Introduction and Business Overview
- Table 72. Interlink Piezoresistive Force Sensors Sales (M Units), Revenue (US$ Million), Price (US$/K Units) and Gross Margin (2017-2022)
- Table 73. Interlink Piezoresistive Force Sensors Product
- Table 74. Interlink Recent Development
- Table 75. Tekscan Corporation Information
- Table 76. Tekscan Introduction and Business Overview
- Table 77. Tekscan Piezoresistive Force Sensors Sales (M Units), Revenue (US$ Million), Price (US$/K Units) and Gross Margin (2017-2022)
- Table 78. Tekscan Piezoresistive Force Sensors Product
- Table 79. Tekscan Recent Development
- Table 80. Nissha Corporation Information
- Table 81. Nissha Introduction and Business Overview
- Table 82. Nissha Piezoresistive Force Sensors Sales (M Units), Revenue (US$ Million), Price (US$/K Units) and Gross Margin (2017-2022)
- Table 83. Nissha Piezoresistive Force Sensors Product
- Table 84. Sensitronics Corporation Information
- Table 85. Sensitronics Introduction and Business Overview
- Table 86. Sensitronics Piezoresistive Force Sensors Sales (M Units), Revenue (US$ Million), Price (US$/K Units) and Gross Margin (2017-2022)
- Table 87. Sensitronics Piezoresistive Force Sensors Product
- Table 88. Tangio Printed Electronics (Sytek) Corporation Information
- Table 89. Tangio Printed Electronics (Sytek) Introduction and Business Overview
- Table 90. Tangio Printed Electronics (Sytek) Piezoresistive Force Sensors Sales (M Units), Revenue (US$ Million), Price (US$/K Units) and Gross Margin (2017-2022)
- Table 91. Tangio Printed Electronics (Sytek) Piezoresistive Force Sensors Product
- Table 92. Ohmite Corporation Information
- Table 93. Ohmite Introduction and Business Overview
- Table 94. Ohmite Piezoresistive Force Sensors Sales (M Units), Revenue (US$ Million), Price (US$/K Units) and Gross Margin (2017-2022)
- Table 95. Ohmite Piezoresistive Force Sensors Product
- Table 96. Cubbison Corporation Information
- Table 97. Cubbison Introduction and Business Overview
- Table 98. Cubbison Piezoresistive Force Sensors Sales (M Units), Revenue (US$ Million), Price (US$/K Units) and Gross Margin (2017-2022)
- Table 99. Cubbison Piezoresistive Force Sensors Product
- Table 100. Reid Industrial Graphic Products Corporation Information
- Table 101. Reid Industrial Graphic Products Introduction and Business Overview
- Table 102. Reid Industrial Graphic Products Piezoresistive Force Sensors Sales (M Units), Revenue (US$ Million), Price (US$/K Units) and Gross Margin (2017-2022)
- Table 103. Reid Industrial Graphic Products Piezoresistive Force Sensors Product
- Table 104. Citizen Electronics Corporation Information
- Table 105. Citizen Electronics Introduction and Business Overview
- Table 106. Citizen Electronics Piezoresistive Force Sensors Sales (M Units), Revenue (US$ Million), Price (US$/K Units) and Gross Margin (2017-2022)
- Table 107. Citizen Electronics Piezoresistive Force Sensors Product
- Table 108. Butler Technologies Corporation Information
- Table 109. Butler Technologies Introduction and Business Overview
- Table 110. Butler Technologies Piezoresistive Force Sensors Sales (M Units), Revenue (US$ Million), Price (US$/K Units) and Gross Margin (2017-2022)
- Table 111. Butler Technologies Piezoresistive Force Sensors Product
- Table 112. Memtronik Corporation Information
- Table 113. Memtronik Introduction and Business Overview
- Table 114. Memtronik Piezoresistive Force Sensors Sales (M Units), Revenue (US$ Million), Price (US$/K Units) and Gross Margin (2017-2022)
- Table 115. Memtronik Piezoresistive Force Sensors Product
- Table 116. Memtronik Recent Development
- Table 117. Techprint Corporation Information
- Table 118. Techprint Introduction and Business Overview
- Table 119. Techprint Piezoresistive Force Sensors Sales (M Units), Revenue (US$ Million), Price (US$/K Units) and Gross Margin (2017-2022)
- Table 120. Techprint Piezoresistive Force Sensors Product
- Table 121. Hanwei Electronics Group Corporation Information
- Table 122. Hanwei Electronics Group Introduction and Business Overview
- Table 123. Hanwei Electronics Group Piezoresistive Force Sensors Sales (M Units), Revenue (US$ Million), Price (US$/K Units) and Gross Margin (2017-2022)
- Table 124. Hanwei Electronics Group Piezoresistive Force Sensors Product
- Table 125. New Degree Technology Corporation Information
- Table 126. New Degree Technology Introduction and Business Overview
- Table 127. New Degree Technology Piezoresistive Force Sensors Sales (M Units), Revenue (US$ Million), Price (US$/K Units) and Gross Margin (2017-2022)
- Table 128. New Degree Technology Piezoresistive Force Sensors Product
- Table 129. FSRTEK Corporation Information
- Table 130. FSRTEK Introduction and Business Overview
- Table 131. FSRTEK Piezoresistive Force Sensors Sales (M Units), Revenue (US$ Million), Price (US$/K Units) and Gross Margin (2017-2022)
- Table 132. FSRTEK Piezoresistive Force Sensors Product
- Table 133. TAIWAN ALPHA ELECTRONIC Corporation Information
- Table 134. TAIWAN ALPHA ELECTRONIC Introduction and Business Overview
- Table 135. TAIWAN ALPHA ELECTRONIC Piezoresistive Force Sensors Sales (M Units), Revenue (US$ Million), Price (US$/K Units) and Gross Margin (2017-2022)
- Table 136. TAIWAN ALPHA ELECTRONIC Piezoresistive Force Sensors Product
- Table 137. CERADEX Corporation Information
- Table 138. CERADEX Introduction and Business Overview
- Table 139. CERADEX Piezoresistive Force Sensors Sales (M Units), Revenue (US$ Million), Price (US$/K Units) and Gross Margin (2017-2022)
- Table 140. CERADEX Piezoresistive Force Sensors Product
- Table 141. Ruihu Corporation Information
- Table 142. Ruihu Introduction and Business Overview
- Table 143. Ruihu Piezoresistive Force Sensors Sales (M Units), Revenue (US$ Million), Price (US$/K Units) and Gross Margin (2017-2022)
- Table 144. Ruihu Piezoresistive Force Sensors Product
- Table 145. Legact Corporation Information
- Table 146. Legact Introduction and Business Overview
- Table 147. Legact Piezoresistive Force Sensors Sales (M Units), Revenue (US$ Million), Price (US$/K Units) and Gross Margin (2017-2022)
- Table 148. Legact Piezoresistive Force Sensors Product
- Table 149. Fpsen Corporation Information
- Table 150. Fpsen Introduction and Business Overview
- Table 151. Fpsen Piezoresistive Force Sensors Sales (M Units), Revenue (US$ Million), Price (US$/K Units) and Gross Margin (2017-2022)
- Table 152. Fpsen Piezoresistive Force Sensors Product
- Table 153. Raw Materials Key Suppliers Lists
- Table 154. Piezoresistive Force Sensors Market Trends
- Table 155. Piezoresistive Force Sensors Market Drivers
- Table 156. Piezoresistive Force Sensors Market Challenges
- Table 157. Piezoresistive Force Sensors Market Restraints
- Table 158. Piezoresistive Force Sensors Distributors List
- Table 159. Piezoresistive Force Sensors Downstream Customers
- Table 160. Research Programs/Design for This Report
- Table 161. Key Data Information from Secondary Sources
- Table 162. Key Data Information from Primary Sources
List of Figures
- Figure 1. Piezoresistive Force Sensors Product Picture
- Figure 2. Global Piezoresistive Force Sensors Market Size, 2017 VS 2021 VS 2028 (US$ Million)
- Figure 3. Global Piezoresistive Force Sensors Market Size Status and Outlook (2017-2028) & (US$ Million)
- Figure 4. Global Piezoresistive Force Sensors Sales Status and Outlook (2017-2028) & (M Units)
- Figure 5. Product Picture of Shunt Mode FSR
- Figure 6. Global Shunt Mode FSR Sales YoY Growth (2017-2028) & (M Units)
- Figure 7. Product Picture of Thru Mode FSR
- Figure 8. Global Thru Mode FSR Sales YoY Growth (2017-2028) & (M Units)
- Figure 9. Global Piezoresistive Force Sensors Sales by Type (2017-2028) & (US$ Million)
- Figure 10. Global Piezoresistive Force Sensors Market Share by Type in 2021 & 2028
- Figure 11. North America Piezoresistive Force Sensors Sales Market Share in Volume by Type in 2021
- Figure 12. North America Piezoresistive Force Sensors Sales Market Share in Value by Type in 2021
- Figure 13. Europe Piezoresistive Force Sensors Sales Market Share in Volume by Type in 2021
- Figure 14. Europe Piezoresistive Force Sensors Sales Market Share in Value by Type in 2021
- Figure 15. Asia-Pacific Piezoresistive Force Sensors Sales Market Share in Volume by Type in 2021
- Figure 16. Asia-Pacific Piezoresistive Force Sensors Sales Market Share in Value by Type in 2021
- Figure 17. Latin America Piezoresistive Force Sensors Sales Market Share in Volume by Type in 2021
- Figure 18. Latin America Piezoresistive Force Sensors Sales Market Share in Value by Type in 2021
- Figure 19. Middle East and Africa Piezoresistive Force Sensors Sales Market Share in Volume by Type in 2021
- Figure 20. Middle East and Africa Piezoresistive Force Sensors Sales Market Share in Value by Type in 2021
- Figure 21. The 5 Largest Manufacturers in the World: Market Share by Piezoresistive Force Sensors Sales in 2021
- Figure 22. The 5 Largest Manufacturers in the World: Market Share by Piezoresistive Force Sensors Revenue in 2021
- Figure 23. Product Picture of Mobile Devices
- Figure 24. Global Mobile Devices Sales YoY Growth (2017-2028) & (M Units)
- Figure 25. Product Picture of Wearable Device
- Figure 26. Global Wearable Device Sales YoY Growth (2017-2028) & (M Units)
- Figure 27. Product Picture of Automotive
- Figure 28. Global Automotive Sales YoY Growth (2017-2028) & (M Units)
- Figure 29. Product Picture of Medical
- Figure 30. Global Medical Sales YoY Growth (2017-2028) & (M Units)
- Figure 31. Product Picture of Home Appliances
- Figure 32. Global Home Appliances Sales YoY Growth (2017-2028) & (M Units)
- Figure 33. Product Picture of Others
- Figure 34. Global Others Sales YoY Growth (2017-2028) & (M Units)
- Figure 35. Global Piezoresistive Force Sensors Sales by Application (2017-2028) & (US$ Million)
- Figure 36. Global Piezoresistive Force Sensors Market Share by Application in 2021 & 2028
- Figure 37. North America Piezoresistive Force Sensors Sales Market Share in Volume by Application in 2021
- Figure 38. North America Piezoresistive Force Sensors Sales Market Share in Value by Application in 2021
- Figure 39. Europe Piezoresistive Force Sensors Sales Market Share in Volume by Application in 2021
- Figure 40. Europe Piezoresistive Force Sensors Sales Market Share in Value by Application in 2021
- Figure 41. Asia-Pacific Piezoresistive Force Sensors Sales Market Share in Volume by Application in 2021
- Figure 42. Asia-Pacific Piezoresistive Force Sensors Sales Market Share in Value by Application in 2021
- Figure 43. Latin America Piezoresistive Force Sensors Sales Market Share in Volume by Application in 2021
- Figure 44. Latin America Piezoresistive Force Sensors Sales Market Share in Value by Application in 2021
- Figure 45. Middle East and Africa Piezoresistive Force Sensors Sales Market Share in Volume by Application in 2021
- Figure 46. Middle East and Africa Piezoresistive Force Sensors Sales Market Share in Value by Application in 2021
- Figure 47. Piezoresistive Force Sensors Manufacturing Cost Structure
- Figure 48. Piezoresistive Force Sensors Industrial Chain Analysis
- Figure 49. Channels of Distribution
- Figure 50. Distributors Profiles
- Figure 51. Bottom-up and Top-down Approaches for This Report
- Figure 52. Data Triangulation
- Figure 53. Key Executives Interviewed 142
Market Analysis and Insights:
Due to the COVID-19 pandemic, the global Piezoresistive Force Sensors market size was value at US$ 702.58 million in 2021 and is forecast to be a readjusted size of US$ 1,121.64 million by 2028 with a CAGR of 6.61% during the forecast period 2022-2028.
The global main manufacturers of Piezoresistive Force Sensors include Nissha, New Degree Technology, Citizen Electronics, Memtronik, Tekscan, Butler Technologies, Hanwei Electronics Group etc. In 2021, the global six largest players have a share approximately 61.85% in terms of revenue.
The North America Piezoresistive Force Sensors market size was US$ 154.03 million in 2021. As for the Europe Piezoresistive Force Sensors landscape is projected to reach US$ 217.85 million by 2028.
Fully considering the economic change by the COVID-19, Shunt Mode FSR accounting for 60.77% of the Piezoresistive Force Sensors global market in 2021, is projected to value US$ 656.05 million by 2028, growing at a revised 6.03% CAGR from 2022 to 2028. While Mobile Devices segment is altered to a 4.02% CAGR throughout this forecast period and will hold a share about 35.84% in 2028.
Scope and Market Size:
The global Piezoresistive Force Sensors market is segmented by region (country), company, by Type, and by Application. Players, stakeholders, and other participants in the global Piezoresistive Force Sensors market will be able to gain the upper hand as they use the report as a powerful resource. The segmental analysis focuses on sales, revenue and forecast by region (country), by Type, and by Application for the period 2017-2028.
By Company
- Nissha
- New Degree Technology
- Citizen Electronics
- Memtronik
- Tekscan
- Butler Technologies
- Hanwei Electronics Group
- FSRTEK
- NextInput (Qorvo)
- Interlink
- Ohmite
- Techprint
- TAIWAN ALPHA ELECTRONIC
- Tangio Printed Electronics (Sytek)
- Ruihu
- Sensitronics
- Legact
- Cubbison
- CERADEX
- Reid Industrial Graphic Products
- fpsen
Segment by Type
- Shunt Mode FSR
- Thru Mode FSR
Segment by Application
- Mobile Devices
- Wearable Device
- Automotive
- Medical
- Home Appliances
- Others
By Region
- North America
- Asia-Pacific
- Europe
- Latin America
- Middle East & Africa
TABLE OF CONTENTS
1 PIEZORESISTIVE FORCE SENSORS MARKET OVERVIEW
- 1.1 PIEZORESISTIVE FORCE SENSORS PRODUCT OVERVIEW
- 1.2 PIEZORESISTIVE FORCE SENSORS MARKET SEGMENT BY TYPE
- 1.2.1 SHUNT MODE FSR
- 1.2.2 THRU MODE FSR
- 1.3 GLOBAL PIEZORESISTIVE FORCE SENSORS MARKET SIZE BY TYPE
- 1.3.1 GLOBAL PIEZORESISTIVE FORCE SENSORS MARKET SIZE OVERVIEW BY TYPE (2017-2028)
- 1.3.2 GLOBAL PIEZORESISTIVE FORCE SENSORS HISTORIC MARKET SIZE REVIEW BY TYPE (2017-2022)
- 1.3.3 GLOBAL PIEZORESISTIVE FORCE SENSORS FORECASTED MARKET SIZE BY TYPE (2023-2028)
- 1.4 KEY REGIONS MARKET SIZE SEGMENT BY TYPE
- 1.4.1 NORTH AMERICA PIEZORESISTIVE FORCE SENSORS SALES BREAKDOWN BY TYPE (2017-2022)
- 1.4.2 EUROPE PIEZORESISTIVE FORCE SENSORS SALES BREAKDOWN BY TYPE (2017-2022)
- 1.4.3 ASIA-PACIFIC PIEZORESISTIVE FORCE SENSORS SALES BREAKDOWN BY TYPE (2017-2022)
- 1.4.4 LATIN AMERICA PIEZORESISTIVE FORCE SENSORS SALES BREAKDOWN BY TYPE (2017-2022)
- 1.4.5 MIDDLE EAST AND AFRICA PIEZORESISTIVE FORCE SENSORS SALES BREAKDOWN BY TYPE (2017-2022)
2 PIEZORESISTIVE FORCE SENSORS MARKET COMPETITION BY COMPANY
- 2.1 GLOBAL TOP PLAYERS BY PIEZORESISTIVE FORCE SENSORS SALES (2017-2022)
- 2.2 GLOBAL TOP PLAYERS BY PIEZORESISTIVE FORCE SENSORS REVENUE (2017-2022)
- 2.3 GLOBAL TOP PLAYERS BY PIEZORESISTIVE FORCE SENSORS PRICE (2017-2022)
- 2.4 GLOBAL TOP MANUFACTURERS PIEZORESISTIVE FORCE SENSORS MANUFACTURING BASE DISTRIBUTION, SALES AREA, PRODUCT TYPE
- 2.5 PIEZORESISTIVE FORCE SENSORS MARKET COMPETITIVE SITUATION AND TRENDS
- 2.5.1 PIEZORESISTIVE FORCE SENSORS MARKET CONCENTRATION RATE (2017-2022)
- 2.5.2 GLOBAL 5 AND 10 LARGEST MANUFACTURERS BY PIEZORESISTIVE FORCE SENSORS SALES AND REVENUE IN 2021
- 2.6 GLOBAL TOP MANUFACTURERS BY COMPANY TYPE (TIER 1, TIER 2, AND TIER 3) & (BASED ON THE REVENUE IN PIEZORESISTIVE FORCE SENSORS AS OF 2021)
- 2.7 ESTABLISHED DATE OF KEY PIEZORESISTIVE FORCE SENSORS MANUFACTURERS
- 2.8 KEY MANUFACTURERS PIEZORESISTIVE FORCE SENSORS PRODUCT OFFERED
- 2.9 MERGERS & ACQUISITIONS, EXPANSION
3 PIEZORESISTIVE FORCE SENSORS STATUS AND OUTLOOK BY REGION
- 3.1 GLOBAL PIEZORESISTIVE FORCE SENSORS MARKET SIZE AND CAGR BY REGION: 2017 VS 2021 VS 2028
- 3.2 GLOBAL PIEZORESISTIVE FORCE SENSORS HISTORIC MARKET SIZE BY REGION
- 3.2.1 GLOBAL PIEZORESISTIVE FORCE SENSORS SALES IN VOLUME BY REGION (2017-2022)
- 3.2.2 GLOBAL PIEZORESISTIVE FORCE SENSORS SALES IN VALUE BY REGION (2017-2022)
- 3.2.3 GLOBAL PIEZORESISTIVE FORCE SENSORS SALES (VOLUME & VALUE), PRICE
- 3.3 GLOBAL PIEZORESISTIVE FORCE SENSORS FORECASTED MARKET SIZE BY REGION
- 3.3.1 GLOBAL PIEZORESISTIVE FORCE SENSORS SALES IN VOLUME BY REGION (2023-2028)
- 3.3.2 GLOBAL PIEZORESISTIVE FORCE SENSORS SALES IN VALUE BY REGION (2023-2028)
- 3.3.3 GLOBAL PIEZORESISTIVE FORCE SENSORS SALES (VOLUME & VALUE), PRICE (2023-2028)
4 PIEZORESISTIVE FORCE SENSORS BY APPLICATION
- 4.1 PIEZORESISTIVE FORCE SENSORS MARKET SEGMENT BY APPLICATION
- 4.1.1 MOBILE DEVICES
- 4.1.2 WEARABLE DEVICE
- 4.1.3 AUTOMOTIVE
- 4.1.4 MEDICAL
- 4.1.5 HOME APPLIANCES
- 4.1.6 OTHERS
- 4.2 GLOBAL PIEZORESISTIVE FORCE SENSORS MARKET SIZE BY APPLICATION
- 4.2.1 GLOBAL PIEZORESISTIVE FORCE SENSORS MARKET SIZE OVERVIEW BY APPLICATION (2017-2028)
- 4.2.2 GLOBAL PIEZORESISTIVE FORCE SENSORS HISTORIC MARKET SIZE REVIEW BY APPLICATION (2017-2022)
- 4.2.3 GLOBAL PIEZORESISTIVE FORCE SENSORS FORECASTED MARKET SIZE BY APPLICATION (2023-2028)
- 4.3 KEY REGIONS MARKET SIZE SEGMENT BY APPLICATION
- 4.3.1 NORTH AMERICA PIEZORESISTIVE FORCE SENSORS SALES BREAKDOWN BY APPLICATION (2017-2022)
- 4.3.2 EUROPE PIEZORESISTIVE FORCE SENSORS SALES BREAKDOWN BY APPLICATION (2017-2022)
- 4.3.3 ASIA-PACIFIC PIEZORESISTIVE FORCE SENSORS SALES BREAKDOWN BY APPLICATION (2017-2022)
- 4.3.4 LATIN AMERICA PIEZORESISTIVE FORCE SENSORS SALES BREAKDOWN BY APPLICATION (2017-2022)
- 4.3.5 MIDDLE EAST AND AFRICA PIEZORESISTIVE FORCE SENSORS SALES BREAKDOWN BY APPLICATION (2017-2022)
5 COMPANY PROFILES AND KEY FIGURES IN PIEZORESISTIVE FORCE SENSORS BUSINESS
- 5.1 NEXTINPUT (QORVO)
- 5.1.1 NEXTINPUT (QORVO) CORPORATION INFORMATION
- 5.1.2 NEXTINPUT (QORVO) INTRODUCTION AND BUSINESS OVERVIEW
- 5.1.3 NEXTINPUT (QORVO) PIEZORESISTIVE FORCE SENSORS SALES, REVENUE AND GROSS MARGIN (2017-2022)
- 5.1.4 NEXTINPUT (QORVO) PIEZORESISTIVE FORCE SENSORS PRODUCTS OFFERED
- 5.1.5 NEXTINPUT (QORVO) RECENT DEVELOPMENT
- 5.2 INTERLINK
- 5.2.1 INTERLINK CORPORATION INFORMATION
- 5.2.2 INTERLINK INTRODUCTION AND BUSINESS OVERVIEW
- 5.2.3 INTERLINK PIEZORESISTIVE FORCE SENSORS SALES, REVENUE AND GROSS MARGIN (2017-2022)
- 5.2.4 INTERLINK PIEZORESISTIVE FORCE SENSORS PRODUCTS OFFERED
- 5.2.5 INTERLINK RECENT DEVELOPMENT
- 5.3 TEKSCAN
- 5.3.1 TEKSCAN CORPORATION INFORMATION
- 5.3.2 TEKSCAN INTRODUCTION AND BUSINESS OVERVIEW
- 5.3.3 TEKSCAN PIEZORESISTIVE FORCE SENSORS SALES, REVENUE AND GROSS MARGIN (2017-2022)
- 5.3.4 TEKSCAN PIEZORESISTIVE FORCE SENSORS PRODUCTS OFFERED
- 5.3.5 TEKSCAN RECENT DEVELOPMENT
- 5.4 NISSHA
- 5.4.1 NISSHA CORPORATION INFORMATION
- 5.4.2 NISSHA INTRODUCTION AND BUSINESS OVERVIEW
- 5.4.3 NISSHA PIEZORESISTIVE FORCE SENSORS SALES, REVENUE AND GROSS MARGIN (2017-2022)
- 5.4.4 NISSHA PIEZORESISTIVE FORCE SENSORS PRODUCTS OFFERED
- 5.5 SENSITRONICS
- 5.5.1 SENSITRONICS CORPORATION INFORMATION
- 5.5.2 SENSITRONICS INTRODUCTION AND BUSINESS OVERVIEW
- 5.5.3 SENSITRONICS PIEZORESISTIVE FORCE SENSORS SALES, REVENUE AND GROSS MARGIN (2017-2022)
- 5.5.4 SENSITRONICS PIEZORESISTIVE FORCE SENSORS PRODUCTS OFFERED
- 5.6 TANGIO PRINTED ELECTRONICS (SYTEK)
- 5.6.1 TANGIO PRINTED ELECTRONICS (SYTEK) CORPORATION INFORMATION
- 5.6.2 TANGIO PRINTED ELECTRONICS (SYTEK) INTRODUCTION AND BUSINESS OVERVIEW
- 5.6.3 TANGIO PRINTED ELECTRONICS (SYTEK) PIEZORESISTIVE FORCE SENSORS SALES, REVENUE AND GROSS MARGIN (2017-2022)
- 5.6.4 TANGIO PRINTED ELECTRONICS (SYTEK) PIEZORESISTIVE FORCE SENSORS PRODUCTS OFFERED
- 5.7 OHMITE
- 5.7.1 OHMITE CORPORATION INFORMATION
- 5.7.2 OHMITE INTRODUCTION AND BUSINESS OVERVIEW
- 5.7.3 OHMITE PIEZORESISTIVE FORCE SENSORS SALES, REVENUE AND GROSS MARGIN (2017-2022)
- 5.7.4 OHMITE PIEZORESISTIVE FORCE SENSORS PRODUCTS OFFERED
- 5.8 CUBBISON
- 5.8.1 CUBBISON CORPORATION INFORMATION
- 5.8.2 CUBBISON INTRODUCTION AND BUSINESS OVERVIEW
- 5.8.3 CUBBISON PIEZORESISTIVE FORCE SENSORS SALES, REVENUE AND GROSS MARGIN (2017-2022)
- 5.8.4 CUBBISON PIEZORESISTIVE FORCE SENSORS PRODUCTS OFFERED
- 5.9 REID INDUSTRIAL GRAPHIC PRODUCTS
- 5.9.1 REID INDUSTRIAL GRAPHIC PRODUCTS CORPORATION INFORMATION
- 5.9.2 REID INDUSTRIAL GRAPHIC PRODUCTS INTRODUCTION AND BUSINESS OVERVIEW
- 5.9.3 REID INDUSTRIAL GRAPHIC PRODUCTS PIEZORESISTIVE FORCE SENSORS SALES, REVENUE AND GROSS MARGIN (2017-2022)
- 5.9.4 REID INDUSTRIAL GRAPHIC PRODUCTS PIEZORESISTIVE FORCE SENSORS PRODUCTS OFFERED
- 5.10 CITIZEN ELECTRONICS
- 5.10.1 CITIZEN ELECTRONICS CORPORATION INFORMATION
- 5.10.2 CITIZEN ELECTRONICS INTRODUCTION AND BUSINESS OVERVIEW
- 5.10.3 CITIZEN ELECTRONICS PIEZORESISTIVE FORCE SENSORS SALES, REVENUE AND GROSS MARGIN (2017-2022)
- 5.10.4 CITIZEN ELECTRONICS PIEZORESISTIVE FORCE SENSORS PRODUCTS OFFERED
- 5.11 BUTLER TECHNOLOGIES
- 5.11.1 BUTLER TECHNOLOGIES CORPORATION INFORMATION
- 5.11.2 BUTLER TECHNOLOGIES INTRODUCTION AND BUSINESS OVERVIEW
- 5.11.3 BUTLER TECHNOLOGIES PIEZORESISTIVE FORCE SENSORS SALES, REVENUE AND GROSS MARGIN (2017-2022)
- 5.11.4 BUTLER TECHNOLOGIES PIEZORESISTIVE FORCE SENSORS PRODUCTS OFFERED
- 5.12 MEMTRONIK
- 5.12.1 MEMTRONIK CORPORATION INFORMATION
- 5.12.2 MEMTRONIK INTRODUCTION AND BUSINESS OVERVIEW
- 5.12.3 MEMTRONIK PIEZORESISTIVE FORCE SENSORS SALES, REVENUE AND GROSS MARGIN (2017-2022)
- 5.12.4 MEMTRONIK PIEZORESISTIVE FORCE SENSORS PRODUCTS OFFERED
- 5.12.5 MEMTRONIK RECENT DEVELOPMENT
- 5.13 TECHPRINT
- 5.13.1 TECHPRINT CORPORATION INFORMATION
- 5.13.2 TECHPRINT INTRODUCTION AND BUSINESS OVERVIEW
- 5.13.3 TECHPRINT PIEZORESISTIVE FORCE SENSORS SALES, REVENUE AND GROSS MARGIN (2017-2022)
- 5.13.4 TECHPRINT PIEZORESISTIVE FORCE SENSORS PRODUCTS OFFERED
- 5.14 HANWEI ELECTRONICS GROUP
- 5.14.1 HANWEI ELECTRONICS GROUP CORPORATION INFORMATION
- 5.14.2 HANWEI ELECTRONICS GROUP INTRODUCTION AND BUSINESS OVERVIEW
- 5.14.3 HANWEI ELECTRONICS GROUP PIEZORESISTIVE FORCE SENSORS SALES, REVENUE AND GROSS MARGIN (2017-2022)
- 5.14.4 HANWEI ELECTRONICS GROUP PIEZORESISTIVE FORCE SENSORS PRODUCTS OFFERED
- 5.15 NEW DEGREE TECHNOLOGY
- 5.15.1 NEW DEGREE TECHNOLOGY CORPORATION INFORMATION
- 5.15.2 NEW DEGREE TECHNOLOGY INTRODUCTION AND BUSINESS OVERVIEW
- 5.15.3 NEW DEGREE TECHNOLOGY PIEZORESISTIVE FORCE SENSORS SALES, REVENUE AND GROSS MARGIN (2017-2022)
- 5.15.4 NEW DEGREE TECHNOLOGY PIEZORESISTIVE FORCE SENSORS PRODUCTS OFFERED
- 5.16 FSRTEK
- 5.16.1 FSRTEK CORPORATION INFORMATION
- 5.16.2 FSRTEK INTRODUCTION AND BUSINESS OVERVIEW
- 5.16.3 FSRTEK PIEZORESISTIVE FORCE SENSORS SALES, REVENUE AND GROSS MARGIN (2017-2022)
- 5.16.4 FSRTEK PIEZORESISTIVE FORCE SENSORS PRODUCTS OFFERED
- 5.17 TAIWAN ALPHA ELECTRONIC
- 5.17.1 TAIWAN ALPHA ELECTRONIC CORPORATION INFORMATION
- 5.17.2 TAIWAN ALPHA ELECTRONIC INTRODUCTION AND BUSINESS OVERVIEW
- 5.17.3 TAIWAN ALPHA ELECTRONIC PIEZORESISTIVE FORCE SENSORS SALES, REVENUE AND GROSS MARGIN (2017-2022)
- 5.17.4 TAIWAN ALPHA ELECTRONIC PIEZORESISTIVE FORCE SENSORS PRODUCTS OFFERED
- 5.18 CERADEX
- 5.18.1 CERADEX CORPORATION INFORMATION
- 5.18.2 CERADEX INTRODUCTION AND BUSINESS OVERVIEW
- 5.18.3 CERADEX PIEZORESISTIVE FORCE SENSORS SALES, REVENUE AND GROSS MARGIN (2017-2022)
- 5.18.4 CERADEX PIEZORESISTIVE FORCE SENSORS PRODUCTS OFFERED
- 5.19 RUIHU
- 5.19.1 RUIHU CORPORATION INFORMATION
- 5.19.2 RUIHU INTRODUCTION AND BUSINESS OVERVIEW
- 5.19.3 RUIHU PIEZORESISTIVE FORCE SENSORS SALES, REVENUE AND GROSS MARGIN (2017-2022)
- 5.19.4 RUIHU PIEZORESISTIVE FORCE SENSORS PRODUCTS OFFERED
- 5.20 LEGACT
- 5.20.1 LEGACT CORPORATION INFORMATION
- 5.20.2 LEGACT INTRODUCTION AND BUSINESS OVERVIEW
- 5.20.3 LEGACT PIEZORESISTIVE FORCE SENSORS SALES, REVENUE AND GROSS MARGIN (2017-2022)
- 5.20.4 LEGACT PIEZORESISTIVE FORCE SENSORS PRODUCTS OFFERED
- 5.21 FPSEN
- 5.21.1 FPSEN CORPORATION INFORMATION
- 5.21.2 FPSEN INTRODUCTION AND BUSINESS OVERVIEW
- 5.21.3 FPSEN PIEZORESISTIVE FORCE SENSORS SALES, REVENUE AND GROSS MARGIN (2017-2022)
- 5.21.4 FPSEN PIEZORESISTIVE FORCE SENSORS PRODUCTS OFFERED
6 UPSTREAM, OPPORTUNITIES, CHALLENGES, RISKS AND INFLUENCES FACTORS ANALYSIS
- 6.1 PIEZORESISTIVE FORCE SENSORS KEY RAW MATERIALS
- 6.1.1 KEY RAW MATERIALS
- 6.1.2 RAW MATERIALS KEY SUPPLIERS
- 6.2 MANUFACTURING COST STRUCTURE
- 6.2.1 RAW MATERIALS
- 6.2.2 LABOR COST
- 6.2.3 MANUFACTURING EXPENSES
- 6.3 PIEZORESISTIVE FORCE SENSORS INDUSTRIAL CHAIN ANALYSIS
- 6.4 PIEZORESISTIVE FORCE SENSORS MARKET DYNAMICS
- 6.4.1 PIEZORESISTIVE FORCE SENSORS INDUSTRY TRENDS
- 6.4.2 PIEZORESISTIVE FORCE SENSORS MARKET DRIVERS
- 6.4.3 PIEZORESISTIVE FORCE SENSORS MARKET CHALLENGES
- 6.4.4 PIEZORESISTIVE FORCE SENSORS MARKET RESTRAINTS
7 MARKETING STRATEGY ANALYSIS, DISTRIBUTORS
- 7.1 SALES CHANNEL
- 7.2 PIEZORESISTIVE FORCE SENSORS DISTRIBUTORS
- 7.3 PIEZORESISTIVE FORCE SENSORS DOWNSTREAM CUSTOMERS
8 RESEARCH FINDINGS AND CONCLUSION
9 APPENDIX
- 9.1 RESEARCH METHODOLOGY
- 9.1.1 METHODOLOGY/RESEARCH APPROACH
- 9.1.2 DATA SOURCE
- 9.2 AUTHOR DETAILS
- 9.3 DISCLAIMER