|
|
市場調査レポート
商品コード
1109342
チップバリスタの世界市場(2022年)Global Chip Varistor Market Research Report 2022 |
||||||
|
|
|||||||
|
● お客様のご希望に応じて、既存データの加工や未掲載情報(例:国別セグメント)の追加などの対応が可能です。 詳細はお問い合わせください。 |
|||||||


| チップバリスタの世界市場(2022年) |
|
出版日: 2022年08月04日
発行: QYResearch
ページ情報: 英文 139 Pages
納期: 2~3営業日
|
- 全表示
- 概要
- 図表
- 目次
COVID-19の流行により、世界のチップバリスタ収益は過去5年間、平均成長率5.12%で成長を続けています。
2020年と比較すると、チップバリスタ市場は2020年の668億1,818万個から、2021年には716億432万個へと7.16%の数量増加を達成することができました。全体として、チップバリスタ市場のパフォーマンスは、弱い経済環境にもかかわらず、肯定的です。
チップバリスタの世界市場は、この動向を維持し、2022年の6億1725万米ドルから2028年には9億9425万米ドルに拡大し、2022年から2028年までのCAGRは8.27%で成長すると予測されます。そして、2028年には数量ベースで1,377億767万個に達すると予測されています。
チップバリスタ市場は、市場の集中度が高く、メーカーは主に日本、ドイツ、韓国に集中しています。世界のチップバリスタ市場は、2021年の売上高でTDKが16.58%のシェアを獲得し、パナソニック、AVX、KOA Corporation、Littelfuse、MARUWA、Lattron、 Shenzhen Sunlord、JOYIN、Sinochip Electronicsが続く世界有数の企業となっています。2021年の収益市場シェアは、上場企業上位11社で70.37%を占めています。
世界のチップバリスタ市場の促進要因と抑制要因
調査レポートでは、市場の成長を増大させる様々な要因の分析を組み込んでいます。それは、市場をプラスにもマイナスにも変化させる動向と抑制要因、促進要因を構成しています。このセクションでは、将来の市場に影響を与える可能性のある様々なセグメントと用途の展望も提供しています。詳細な情報は、現在の動向と歴史的なマイルストーンに基づいています。このセクションでは、2017年から2028年までの世界市場に関する生産量と各タイプに関する分析も行っています。2017年から2028年までの地域別の生産量について言及しています。2017年から2028年までの各タイプ、2017年から2022年までのメーカー、2017年から2022年までの地域、2017年から2028年までの世界価格による価格分析が記載されています。
レポートに含まれる抑制の徹底的な評価は、促進要因との対比を描き、戦略的な計画のための余地を与えます。市場の専門家の意見に対する洞察は、市場をよりよく理解するために行われています。
世界のチップバリスタの市場セグメント分析
調査レポートには、地域(国)別、メーカー別、タイプ別、用途別の具体的なセグメントが含まれています。各タイプは、2017年から2028年の予測期間中の生産に関する情報を提供します。また、用途別セグメントは、2017年から2028年の予測期間中の消費に関する情報を提供します。セグメントを理解することは、市場の成長を助けるさまざまな要因の重要性を特定するのに役立ちます。
目次
第1章 チップバリスタ市場概要
- チップバリスタの製品概要と適用範囲
- タイプ別:チップバリスタセグメント
- タイプ別:世界の市場規模成長率分析(2022 VS 2028)
- 一般グレード
- 自動車グレード
- 用途別:チップバリスタセグメント
- 用途別:世界の市場規模成長率分析(2022 VS 2028)
- モバイル電子機器
- テレビ
- AV機器
- 自動車
- 工業
- 世界市場の成長見通し
- 世界の収益推計・予測(2017-2028)
- 世界の生産推計・予測(2017-2028)
- 地域別:世界市場規模
- 地域別:世界の市場規模推計・予測(2017 VS 2022 VS 2028)
- 北米の推計・予測(2017-2028)
- 欧州の推計・予測(2017-2028)
- 中国の推計・予測(2017-2028)
- 日本の推計・予測(2017-2028)
- 韓国の推計・予測(2017-2028)
第2章 メーカー別:市場競争
- メーカー別:世界の生産能力市場シェア(2017-2022)
- メーカー別:世界の収益市場シェア(2019-2022)
- 企業タイプ別:市場シェア(Tier 1、Tier 2、Tier 3)
- メーカー別:世界の平均価格(2019-2022)
- 市場の競争情勢と動向
第3章 地域別:生産
- 地域別:市場シェアの世界生産(2017-2022)
- 地域別:世界収益市場シェア(2017-2022)
- 世界の生産、収益、価格、粗利(2017-2022)
- 北米
- 欧州
- 中国
- 日本
- 韓国
第4章 地域別:チップバリスタの消費
- 地域別:世界の消費
- 北米
- 国別:消費
- 米国
- メキシコ
- カナダ
- 欧州
- 国別:消費
- ドイツ
- フランス
- 英国
- イタリア
- ロシア
- アジア太平洋
- 地域別:消費
- 中国
- 日本
- 韓国
- 東南アジア
- インド
- 南米
- 国別:消費
- ブラジル
第5章 タイプ別:セグメント
- タイプ別:世界の生産市場シェア(2017-2022)
- タイプ別:世界の収益市場シェア(2017-2022)
- タイプ別:世界の価格(2017-2022)
第6章 用途別:セグメント
- 用途別:世界の生産(2017-2022)
- 用途別:世界の生産市場シェア(2017-2022)
第7章 主要企業の紹介
- TDK(日本)
- 企業プロファイル
- 製品の写真と仕様
- TDKの生産、収益、価格、粗利分析
- 連絡先
- Panasonic(日本)
- 企業プロファイル
- 製品の写真と仕様
- Panasonicの生産、収益、価格、粗利分析
- 連絡先
- AVX(米国)
- 企業プロファイル
- 製品の写真と仕様
- AVXの生産、収益、価格、粗利分析
- 連絡先
- KOA Corporation(日本)
- 企業プロファイル
- 製品の写真と仕様
- KOA Corporationの生産、収益、価格、粗利分析
- 連絡先
- Littelfuse(米国)
- 企業プロファイル
- 製品の写真と仕様
- Littelfuseの生産、収益、価格、粗利分析
- 連絡先
- MARUWA(日本)
- 企業プロファイル
- 製品の写真と仕様
- MARUWAの生産、収益、価格、粗利分析
- 連絡先
- Lattron(韓国)
- 企業プロファイル
- 製品の写真と仕様
- Lattronの生産、収益、価格、粗利分析
- 連絡先
- Shenzhen Sunlord(中国)
- 企業プロファイル
- 製品の写真と仕様
- Shenzhen Sunlordの生産、収益、価格、粗利分析
- 連絡先
- JOYIN(台湾)
- 企業プロファイル
- 製品の写真と仕様
- JOYINの生産、収益、価格、粗利分析
- 連絡先
- Sinochip Electronics(中国)
- 企業プロファイル
- 製品の写真と仕様
- Sinochip Electronicsの生産、収益、価格、粗利分析
- 連絡先
- AMO group(KR)
- AMO groupチップバリスタ企業情報
- AMO groupのチップバリスタの製品ポートフォリオ
- AMO groupチップバリスタの生産、収益、価格、粗利(2017-2022)
- AMO groupの主な事業と市場
第8章 チップバリスタの製造コスト分析
- 主要原材料分析
- 製造コスト構造比
- 製造プロセス分析
- 産業チェーン分析
第9章 マーケティングチャネル、ディストリビューター、および顧客
- マーケティングチャネル
- ディストリビューターのリスト
- 顧客
- Appleバリスタのサプライヤ情報
第10章 チップバリスタの市場力学
- 業界動向
- 市場促進要因
- 市場の課題
- 市場抑制要因
第11章 生産と供給予測
- 地域別:世界予測生産(2023-2028)
- 北米:生産、収益予測(2023-2028)
- 欧州:生産、収益予測(2023-2028)
- 中国:生産、収益予測(2023-2028)
- 日本:生産、収益予測(2023-2028)
- 韓国:生産、収益予測(2023-2028)
第12章 消費と需要予測
- 世界需要予測分析
- 北米の消費予測
- 欧州の消費予測
- アジア太平洋の消費予測
- 南米の消費予測
第13章 タイプ・用途別:予測
- タイプ別:世界の生産、収益、価格予測(2023-2028)
- 用途別:世界の生産予測(2023-2028)
第14章 調査結果と結論
第15章 調査手法と情報源
LIST OF TABLES
- Table 1. Global Chip Varistor Market Size by Type (K Units) & (US$ Million) & (2022 VS 2028)
- Table 2. Global Chip Varistor Market Size by Application (K Units) & (2022 VS 2028)
- Table 3. Chip Varistor Market Size Comparison by Region: 2017 VS 2022 VS 2028
- Table 4. Global Chip Varistor Production (Million Pcs) by Manufacturers in 2021
- Table 5. Global Chip Varistor Production by Manufacturers (2019-2022) & (Million Pcs)
- Table 6. Global Chip Varistor Production Market Share by Manufacturers (2019-2022)
- Table 7. Global Chip Varistor Revenue by Manufacturers (2019-2022) & (US$ Million)
- Table 8. Global Chip Varistor Revenue Share by Manufacturers (2019-2022)
- Table 9. Company Type (Tier 1, Tier 2, and Tier 3) & (based on the Revenue in Chip Varistor as of 2021)
- Table 10. Global Market Chip Varistor Average Price (USD/K Pcs) of Key Manufacturers (2019-2022)
- Table 11. Global Chip Varistor Manufacturers Market Concentration Ratio (CR5 and HHI)
- Table 12. Global Chip Varistor Production (Million Pcs) by Region (2017-2022)
- Table 13. Global Chip Varistor Revenue (US$ Million) by Region (2017-2022)
- Table 14. Global Chip Varistor Revenue Market Share by Region (2017-2022)
- Table 15. Global Chip Varistor Production (Million Pcs), Revenue (US$ Million), Price (USD/K Pcs) and Gross Margin (2017-2022)
- Table 16. North America Chip Varistor Production (Million Pcs), Revenue (US$ Million), Price (USD/K Pcs) (2017-2022)
- Table 17. Europe Chip Varistor Production (Million Pcs), Revenue (US$ Million), Price (USD/K Pcs) (2017-2022)
- Table 18. China Chip Varistor Production (Million Pcs), Revenue (US$ Million), Price (USD/K Pcs) (2017-2022)
- Table 19. Japan Chip Varistor Production (Million Pcs), Revenue (US$ Million), Price (USD/K Pcs) (2017-2022)
- Table 20. South Korea Chip Varistor Production (Million Pcs), Revenue (US$ Million), Price (USD/K Pcs) (2017-2022)
- Table 21. Global Chip Varistor Consumption by Region (2017-2022) & (Million Pcs)
- Table 22. Global Chip Varistor Consumption Market Share by Region (2017-2022)
- Table 23. North America Chip Varistor Consumption by Country (2017-2022) & (Million Pcs)
- Table 24. Europe Chip Varistor Consumption by Country (2017-2022) & (Million Pcs)
- Table 25. Asia Pacific Chip Varistor Consumption by Region (2017-2022) & (Million Pcs)
- Table 26. South America Chip Varistor Consumption by Country (2017-2022) & (Million Pcs)
- Table 27. Global Chip Varistor Production (Million Pcs) by Type (2017-2022)
- Table 28. Global Chip Varistor Production Market Share by Type (2017-2022)
- Table 29. Global Chip Varistor Revenue (US$ Million) by Type (2017-2022)
- Table 30. Global Chip Varistor Revenue Share by Type (2017-2022)
- Table 31. Global Chip Varistor Price (USD/K Pcs) by Type (2017-2022)
- Table 32. Global Chip Varistor Production (Million Pcs) by Application (2017-2022)
- Table 33. Global Chip Varistor Production Market Share by Application (2017-2022)
- Table 34. TDK Information List
- Table 35. Chip Varistor Production, Revenue, Price and Gross Margin of TDK 2019-2022
- Table 36. Contact Information of TDK
- Table 37. Panasonic Information List
- Table 38. Chip Varistor Product Introduction of Panasonic
- Table 39. Chip Varistor Production, Revenue, Price and Gross Margin of Panasonic 2019-2022
- Table 40. Contact Information of Panasonic
- Table 41. AVX Information List
- Table 42. Chip Varistor Product Introduction of AVX
- Table 43. Chip Varistor Production, Revenue, Price and Gross Margin of AVX 2019-2022
- Table 44. Contact Information of AVX
- Table 45. KOA Corporation Information List
- Table 46. Chip Varistor Product Introduction of KOA Corporation
- Table 47. Chip Varistor Production, Revenue, Price and Gross Margin of KOA Corporation 2019-2022
- Table 48. Contact Information of KOA Corporation
- Table 49. Littelfuse Information List
- Table 50. Chip Varistor Product Introduction of Littelfuse
- Table 51. Chip Varistor Production, Revenue, Price and Gross Margin of Littelfuse 2019-2022
- Table 52. Contact Information of Littelfuse
- Table 53. MARUWA Information List
- Table 54. Chip Varistor Product Introduction of MARUWA
- Table 55. Chip Varistor Production, Revenue, Price and Gross Margin of MARUWA 2019-2022
- Table 56. Contact Information of MARUWA
- Table 57. Lattron Information List
- Table 58. Chip Varistor Product Introduction of Lattron
- Table 59. Chip Varistor Production, Revenue, Price and Gross Margin of Lattron 2019-2022
- Table 60. Contact Information of Lattron
- Table 61. Shenzhen Sunlord Information List
- Table 62. Chip Varistor Product Introduction of Shenzhen Sunlord
- Table 63. Chip Varistor Production, Revenue, Price and Gross Margin of Shenzhen Sunlord 2019-2022
- Table 64. Contact Information of Shenzhen Sunlord
- Table 65. JOYIN Information List
- Table 66. Chip Varistor Product Introduction of JOYIN
- Table 67. Chip Varistor Production, Revenue, Price and Gross Margin of JOYIN 2019-2022
- Table 68. Contact Information of JOYIN
- Table 69. Sinochip Electronics Information List
- Table 70. Chip Varistor Production, Revenue, Price and Gross Margin of Sinochip Electronics 2019-2022
- Table 71. Contact Information of Sinochip Electronics
- Table 72. AMO group Chip Varistor Corporation Information
- Table 73. AMO group Chip Varistor Specification and Application
- Table 74. AMO group Chip Varistor Production, Revenue, Price and Gross Margin (2017-2022)
- Table 75. AMO group Main Business and Markets Served
- Table 76. Key Suppliers of Raw Materials
- Table 77. Chip Varistor Distributors List
- Table 78. Chip Varistor Customers List
- Table 79. what kind of varistor vendor providing to them
- Table 80. Chip Varistor Market Trends
- Table 81. Chip Varistor Market Drivers
- Table 82. Chip Varistor Market Challenges
- Table 83. Chip Varistor Market Restraints
- Table 84. Global Chip Varistor Production (Million Pcs) Forecast by Region (2023-2028)
- Table 85. Global Chip Varistor Production Forecast by Type (2023-2028) & (Million Pcs)
- Table 86. Global Chip Varistor Revenue Forecast by Type (2023-2028) & (US$ Million)
- Table 87. Global Chip Varistor Price Forecast by Type (2023-2028) & (USD/K Pcs)
- Table 88. Global Chip Varistor Production Forecast by Application (2023-2028) & (Million Pcs)
- Table 89. Research Programs/Design for This Report
- Table 90. Key Data Information from Secondary Sources
- Table 91. Key Data Information from Primary Sources
List of Figures
- Figure 1. Product Picture of Chip Varistor
- Figure 2. Global Chip Varistor Market Share by Type: 2022 VS 2028
- Figure 3. Global Chip Varistor Market Share by Application: 2022 VS 2028
- Figure 4. Mobile Electronic Device
- Figure 5. TVs
- Figure 6. AV Devices
- Figure 7. Automotive
- Figure 8. Industry
- Figure 9. Global Chip Varistor Revenue (US$ Million), 2017 VS 2022 VS 2028
- Figure 10. Global Chip Varistor Revenue (US$ Million) (2017-2028)
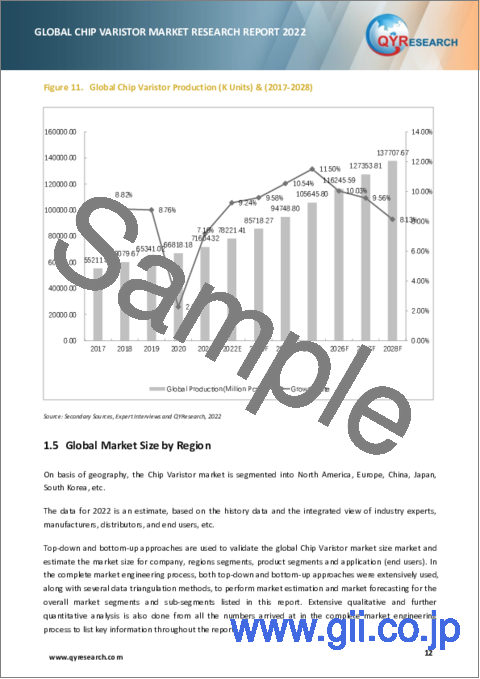
- Figure 11. Global Chip Varistor Production (K Units) & (2017-2028)
- Figure 12. Chip Varistor Market Size Comparison by Region: 2017 VS 2022 VS 2028
- Figure 13. North America Chip Varistor Revenue (US$ Million) Growth Rate (2017-2028)
- Figure 14. Europe Chip Varistor Revenue (US$ Million) Growth Rate (2017-2028)
- Figure 15. China Chip Varistor Revenue (US$ Million) Growth Rate (2017-2028)
- Figure 16. Japan Chip Varistor Revenue (US$ Million) Growth Rate (2017-2028)
- Figure 17. South Korea Chip Varistor Revenue (US$ Million) Growth Rate (2017-2028)
- Figure 18. Chip Varistor Production Share by Manufacturers in 2021
- Figure 19. Global Chip Varistor Revenue Share by Manufacturers in 2021
- Figure 20. The Global 5 and 10 Largest Players: Market Share by Chip Varistor Revenue in 2021
- Figure 21. Global Chip Varistor Production Market Share by Region (2017-2022)
- Figure 22. North America Chip Varistor Production (Million Pcs) Growth Rate (2017-2022)
- Figure 23. Europe Chip Varistor Production (Million Pcs) Growth Rate (2017-2022)
- Figure 24. China Chip Varistor Production (Million Pcs) Growth Rate (2017-2022)
- Figure 25. Japan Chip Varistor Production (Million Pcs) Growth Rate (2017-2022)
- Figure 26. South Korea Chip Varistor Production (Million Pcs) Growth Rate (2017-2022)
- Figure 27. Global Chip Varistor Consumption Market Share by Region (2017-2022)
- Figure 28. North America Chip Varistor Consumption and Growth Rate (2017-2022) & (Million Pcs)
- Figure 29. U.S. Chip Varistor Consumption and Growth Rate (2017-2022) & (Million Pcs)
- Figure 30. Mexico Chip Varistor Consumption and Growth Rate (2017-2022) & (Million Pcs)
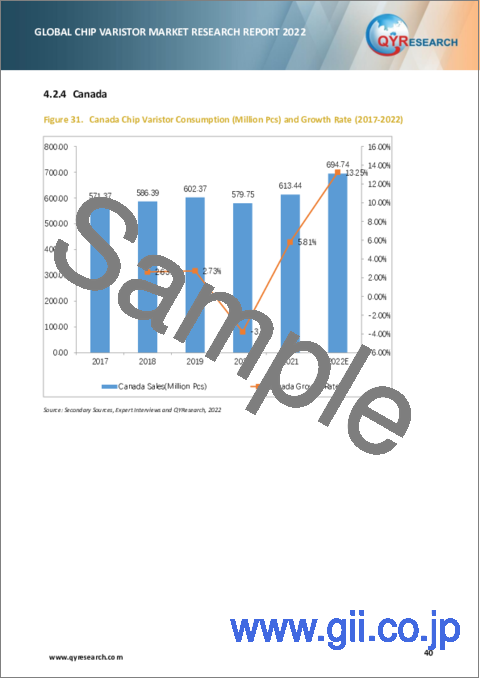
- Figure 31. Canada Chip Varistor Consumption (Million Pcs) and Growth Rate (2017-2022)
- Figure 32. Europe Chip Varistor Consumption and Growth Rate (2017-2022) & (Million Pcs)
- Figure 33. Germany Chip Varistor Consumption and Growth Rate (2017-2022) & (Million Pcs)
- Figure 34. France Chip Varistor Consumption and Growth Rate (2017-2022) & (Million Pcs)
- Figure 35. U.K. Chip Varistor Consumption and Growth Rate (2017-2022) & (Million Pcs)
- Figure 36. Italy Chip Varistor Consumption and Growth Rate (2017-2022) & (Million Pcs)
- Figure 37. Russia Chip Varistor Consumption and Growth Rate (2017-2022) & (Million Pcs)
- Figure 38. Asia Pacific Chip Varistor Consumption and Growth Rate (Million Pcs)
- Figure 39. China Chip Varistor Consumption and Growth Rate (2017-2022) & (Million Pcs)
- Figure 40. Japan Chip Varistor Consumption and Growth Rate (2017-2022) & (Million Pcs)
- Figure 41. South Korea Chip Varistor Consumption and Growth Rate (2017-2022) & (Million Pcs)
- Figure 42. Southeast Asia Chip Varistor Consumption and Growth Rate (2017-2022) & (Million Pcs)
- Figure 43. India Chip Varistor Consumption and Growth Rate (2017-2022) & (Million Pcs)
- Figure 44. South America Chip Varistor Consumption and Growth Rate (Million Pcs)
- Figure 45. Brazil Chip Varistor Consumption and Growth Rate (2017-2022) & (Million Pcs)
- Figure 46. Production Market Share of Chip Varistor by Type (2017-2022)
- Figure 47. Production Market Share of Chip Varistor by Type in 2021
- Figure 48. Revenue Share of Chip Varistor by Type (2017-2022)
- Figure 49. Revenue Market Share of Chip Varistor by Type in 2021
- Figure 50. Production Market Share of Chip Varistor by Application (2017-2022)
- Figure 51. Production Market Share of Chip Varistor by Application in 2021
- Figure 52. Chip Varistor Product Introduction of TDK
- Figure 53. Chip Varistor Product Introduction of Sinochip Electronics
- Figure 54. Key Raw Materials (Zinc Oxide) by Regions 2015-2020 (USD/MT)
- Figure 55. Manufacturing Cost Structure of Chip Varistor
- Figure 56. Chip Varistor Construction
- Figure 57. Chip Varistor Industrial Chain Analysis
- Figure 58. Channels of Distribution
- Figure 59. Distributors Profiles
- Figure 60. Global Chip Varistor Production Market Share Forecast by Region (2023-2028)
- Figure 61. North America Chip Varistor Production (Million Pcs) Growth Rate Forecast (2023-2028)
- Figure 62. Europe Chip Varistor Production (Million Pcs) Growth Rate Forecast (2023-2028)
- Figure 63. China Chip Varistor Production (Million Pcs) Growth Rate Forecast (2023-2028)
- Figure 64. Japan Chip Varistor Production (Million Pcs) Growth Rate Forecast (2023-2028)
- Figure 65. South Korea Chip Varistor Production (Million Pcs) Growth Rate Forecast (2023-2028)
- Figure 66. Global Forecasted Demand Analysis of Chip Varistor (2017-2028) & (Million Pcs)
- Figure 67. North America Chip Varistor Consumption Forecast (2023-2028) & (Million Pcs)
- Figure 68. Europe Chip Varistor Consumption Forecast (2023-2028) & (Million Pcs)
- Figure 69. Asia Pacific Chip Varistor Consumption Forecast (2023-2028) & (Million Pcs)
- Figure 70. South America Chip Varistor Consumption Forecast (2023-2028) & (Million Pcs)
- Figure 71. Global Chip Varistor Production Market Share Forecast by Type (2023-2028)
- Figure 72. Global Chip Varistor Revenue Market Share Forecast by Type (2023-2028)
- Figure 73. Global Chip Varistor Production Market Share Forecast by Application (2023-2028)
- Figure 74. Bottom-up and Top-down Approaches for This Report
- Figure 75. Data Triangulation 123
Due to the COVID-19 pandemic, Global revenue of Chip Varistor has kept growing during the past five years with an average growth rate of 5.12%. Compared to 2020, Chip Varistor market managed to increase volume by 7.16 percent to 71604.32 million pcs worldwide in 2021 from 66818.18 million pcs in 2020. Overall, the Chip Varistor market performance is positive, despite the weak economic environment.
The global Chip Varistor market is forecasted to keep the trend and expand to $ 994.25 million by 2028 from $ 617.25 million in 2022, growing at a CAGR of 8.27% from 2022 to 2028. And it is expected to reach 137707.67 million Pcs in 2028, in terms of volume.
Chip Varistor market is Market concentration is high, and manufacturers are mainly concentrated in Japan, Germany and South Korea. TDKis the world leading player in global Chip Varistor market with the market share of 16.58% in 2021, in terms of revenue, followed by Panasonic, AVX, KOA Corporation, Littelfuse, MARUWA, Lattron, Shenzhen Sunlord, JOYIN and Sinochip Electronics. The top 11 listed companies accounted for 70.37% of the revenue market share in 2021.
Drivers and Restrains:
The research report has incorporated the analysis of different factors that augment the market's growth. It constitutes trends, restraints, and drivers that transform the market in either a positive or negative manner. This section also provides the scope of different segments and applications that can potentially influence the market in the future. The detailed information is based on current trends and historic milestones. This section also provides an analysis of the volume of production about the global market and about each type from 2017 to 2028. This section mentions the volume of production by region from 2017 to 2028. Pricing analysis is included in the report according to each type from the year 2017 to 2028, manufacturer from 2017 to 2022, region from 2017 to 2022, and global price from 2017 to 2028.
A thorough evaluation of the restrains included in the report portrays the contrast to drivers and gives room for strategic planning. Factors that overshadow the market growth are pivotal as they can be understood to devise different bends for getting hold of the lucrative opportunities that are present in the ever-growing market. Additionally, insights into market expert's opinions have been taken to understand the market better.
Segment Analysis:
The research report includes specific segments by region (country), by manufacturers, by Type and by Application. Each type provides information about the production during the forecast period of 2017 to 2028. by Application segment also provides consumption during the forecast period of 2017 to 2028. Understanding the segments helps in identifying the importance of different factors that aid the market growth.
By Company
- TDK
- Panasonic
- AVX
- KOA Corporation
- Littelfuse
- MARUWA
- Lattron
- Shenzhen Sunlord
- JOYIN
- Sinochip Electronics
- AMO group
Segment by Type
- General Grade
- Automotive Grade
Segment by Application
- Mobile Mobile Electronic Device
- TVs
- AV Devices
- Automotive
- Industry
- Other
Production by Region
- North America
- Europe
- China
- Japan
- South Korea
Consumption by Region
- North America
- U.S.
- Mexico
- Canada
- Asia-Pacific
- China
- Japan
- South Korea
- Southeast Asia
- India
- Europe
- Germany
- France
- U.K.
- Italy
- Russia
- Rest of Europe
- South America
- Brazil
- Rest of South America
TABLE OF CONTENTS
1 Chip Varistor Market Overview
- 1.1 Product Overview and Scope of Chip Varistor
- 1.2 Chip Varistor Segment by Type
- 1.2.1 Global Chip Varistor Market Size Growth Rate Analysis by Type: 2022 VS 2028
- 1.2.2 General Grade
- 1.2.3 Automotive Grade
- 1.3 Chip Varistor Segment by Application
- 1.3.1 Global Chip Varistor Market Size Growth Rate Analysis by Application: 2022 VS 2028
- 1.3.2 Mobile Electronic Device
- 1.3.3 TVs
- 1.3.4 AV Devices
- 1.3.5 Automotive
- 1.3.6 Industry
- 1.4 Global Market Growth Prospects
- 1.4.1 Global Chip Varistor Revenue Estimates and Forecasts (2017-2028)
- 1.4.2 Global Chip Varistor Production Estimates and Forecasts (2017-2028)
- 1.5 Global Market Size by Region
- 1.5.1 Global Chip Varistor Market Size Estimates and Forecasts by Region: 2017 VS 2022 VS 2028
- 1.5.2 North America Chip Varistor Estimates and Forecasts (2017-2028)
- 1.5.3 Europe Chip Varistor Estimates and Forecasts (2017-2028)
- 1.5.4 China Chip Varistor Estimates and Forecasts (2017-2028)
- 1.5.5 Japan Chip Varistor Estimates and Forecasts (2017-2028)
- 1.5.6 South Korea Chip Varistor Estimates and Forecasts (2017-2028)
2 Market Competition by Manufacturers
- 2.1 Global Chip Varistor Production Capacity Market Share by Manufacturers (2017-2022)
- 2.2 Global Chip Varistor Revenue Market Share by Manufacturers (2019-2022)
- 2.3 Chip Varistor Market Share by Company Type (Tier 1, Tier 2, and Tier 3)
- 2.4 Global Chip Varistor Average Price by Manufacturers (2019-2022)
- 2.5 Chip Varistor Market Competitive Situation and Trends
- 2.5.1 Chip Varistor Market Concentration Rate
- 2.5.2 Global 5 and 10 Largest Chip Varistor Players Market Share by Revenue
3 Production by Region
- 3.1 Global Production of Chip Varistor Market Share by Region (2017-2022)
- 3.2 Global Chip Varistor Revenue Market Share by Region (2017-2022)
- 3.3 Global Chip Varistor Production, Revenue, Price and Gross Margin (2017-2022)
- 3.4 North America Chip Varistor Production
- 3.4.1 North America Chip Varistor Production Growth Rate (2017-2022)
- 3.4.2 North America Chip Varistor Production, Revenue, Price (2017-2022)
- 3.5 Europe Chip Varistor Production
- 3.5.1 Europe Chip Varistor Production Growth Rate (2017-2022)
- 3.5.2 Europe Chip Varistor Production, Revenue, Price (2017-2022)
- 3.6 China Chip Varistor Production (2017-2022)
- 3.6.1 China Chip Varistor Production Growth Rate (2017-2022)
- 3.6.2 China Chip Varistor Production, Revenue, Price (2017-2022)
- 3.7 Japan Chip Varistor Production (2017-2022)
- 3.7.1 Japan Chip Varistor Production Growth Rate (2017-2022)
- 3.7.2 Japan Chip Varistor Production, Revenue, Price and Gross Margin (2017-2022)
- 3.8 South Korea Chip Varistor Production (2017-2022)
- 3.8.1 South Korea Chip Varistor Production Growth Rate (2017-2022)
- 3.8.2 South Korea Chip Varistor Production, Revenue, Price and Gross Margin (2017-2022)
4 Chip Varistor Consumption by Region
- 4.1 Global Chip Varistor Consumption by Region
- 4.1.1 Global Chip Varistor Consumption by Region
- 4.1.2 Global Chip Varistor Consumption Market Share by Region
- 4.2 North America
- 4.2.1 North America Chip Varistor Consumption by Country
- 4.2.2 U.S.
- 4.2.3 Mexico
- 4.2.4 Canada
- 4.3 Europe
- 4.3.1 Europe Chip Varistor Consumption by Country
- 4.3.2 Germany
- 4.3.3 France
- 4.3.4 U.K.
- 4.3.5 Italy
- 4.3.6 Russia
- 4.4 Asia Pacific
- 4.4.1 Asia Pacific Chip Varistor Consumption by Region
- 4.4.2 China
- 4.4.3 Japan
- 4.4.4 South Korea
- 4.4.5 Southeast Asia
- 4.4.6 India
- 4.5 South America
- 4.5.1 South America Chip Varistor Consumption by Country
- 4.5.2 Brazil
5 Segment by Type
- 5.1 Global Chip Varistor Production Market Share by Type (2017-2022)
- 5.2 Global Chip Varistor Revenue Market Share by Type (2017-2022)
- 5.3 Global Chip Varistor Price by Type (2017-2022)
6 Segment by Application
- 6.1 Global Chip Varistor Production by Application (2017-2022)
- 6.2 Global Chip Varistor Production Market Share by Application (2017-2022)
7 Key Companies Profiled
- 7.1 TDK (JP)
- 7.1.1 Company Profile
- 7.1.2 Product Picture and Specifications
- 7.1.3 Production, Revenue, Price and Gross Margin Analysis of TDK
- 7.1.4 Contact Information
- 7.2 Panasonic (JP)
- 7.2.1 Company Profile
- 7.2.2 Product Picture and Specifications
- 7.2.3 Production, Revenue, Price and Gross Margin Analysis of Panasonic
- 7.2.4 Contact Information
- 7.3 AVX (USA)
- 7.3.1 Company Profile
- 7.3.2 Product Picture and Specifications
- 7.3.3 Production, Revenue, Price and Gross Margin Analysis of AVX
- 7.3.4 Contact Information
- 7.4 KOA Corporation (JP)
- 7.4.1 Company Profile
- 7.4.2 Product Picture and Specifications
- 7.4.3 Production, Revenue, Price and Gross Margin Analysis of KOA Corporation
- 7.4.4 Contact Information
- 7.5 Littelfuse (US)
- 7.5.1 Company Profile
- 7.5.2 Product Picture and Specifications
- 7.5.3 Production, Revenue, Price and Gross Margin Analysis of Littelfuse
- 7.5.4 Contact Information
- 7.6 MARUWA (JP)
- 7.6.1 Company Profile
- 7.6.2 Product Picture and Specifications
- 7.6.3 Production, Revenue, Price and Gross Margin Analysis of MARUWA
- 7.6.4 Contact Information
- 7.7 Lattron (KR)
- 7.7.1 Company Profile
- 7.7.2 Product Picture and Specifications
- 7.7.3 Production, Revenue, Price and Gross Margin Analysis of Lattron
- 7.7.4 Contact Information
- 7.8 Shenzhen Sunlord (CN)
- 7.8.1 Company Profile
- 7.8.2 Product Picture and Specifications
- 7.8.3 Production, Revenue, Price and Gross Margin Analysis of Shenzhen Sunlord
- 7.8.4 Contact Information
- 7.9 JOYIN (CN-TW)
- 7.9.1 Company Profile
- 7.9.2 Product Picture and Specifications
- 7.9.3 Production, Revenue, Price and Gross Margin Analysis of JOYIN
- 7.9.4 Contact Information
- 7.10 Sinochip Electronics (CN)
- 7.10.1 Company Profile
- 7.10.2 Product Picture and Specifications
- 7.10.3 Production, Revenue, Price and Gross Margin Analysis of Sinochip Electronics
- 7.10.4 Contact Information
- 7.11 AMO group(KR)
- 7.11.1 AMO group Chip Varistor Corporation Information
- 7.11.2 AMO group Chip Varistor Product Portfolio
- 7.11.3 AMO group Chip Varistor Production, Revenue, Price and Gross Margin (2017-2022)
- 7.11.4 AMO group Main Business and Markets Served
8 Chip Varistor Manufacturing Cost Analysis
- 8.1 Chip Varistor Key Raw Materials Analysis
- 8.1.1 Key Raw Materials
- 8.1.2 Key Raw Materials Price Trend
- 8.1.3 Key Suppliers of Raw Materials
- 8.2 Proportion of Manufacturing Cost Structure
- 8.3 Manufacturing Process Analysis of Chip Varistor
- 8.4 Chip Varistor Industrial Chain Analysis
9 Marketing Channel, Distributors and Customers
- 9.1 Marketing Channel
- 9.2 Chip Varistor Distributors List
- 9.3 Chip Varistor Customers
- 9.4 Apple Varistor of Supplier Information
10 Chip Varistor Market Dynamics
- 10.1 Chip Varistor Industry Trends
- 10.2 Chip Varistor Market Drivers
- 10.3 Chip Varistor Market Challenges
- 10.4 Chip Varistor Market Restraints
11 Production and Supply Forecast
- 11.1 Global Forecasted Production of Chip Varistor by Region (2023-2028)
- 11.2 North America Chip Varistor Production, Revenue Forecast (2023-2028)
- 11.3 Europe Chip Varistor Production, Revenue Forecast (2023-2028)
- 11.4 China Chip Varistor Production, Revenue Forecast (2023-2028)
- 11.5 Japan Chip Varistor Production, Revenue Forecast (2023-2028)
- 11.6 South Korea Chip Varistor Production, Revenue Forecast (2023-2028)
12 Consumption and Demand Forecast
- 12.1 Global Forecasted Demand Analysis of Chip Varistor
- 12.2 North America Forecasted Consumption of Chip Varistor
- 12.3 Europe Market Forecasted Consumption of Chip Varistor
- 12.4 Asia Pacific Market Forecasted Consumption of Chip Varistor
- 12.5 South America Forecasted Consumption of Chip Varistor
13 Forecast by Type and by Application
- 13.1 Global Production, Revenue and Price Forecast by Type (2023-2028)
- 13.1.1 Global Forecasted Production of Chip Varistor by Type (2023-2028)
- 13.1.2 Global Forecasted Revenue of Chip Varistor by Type (2023-2028)
- 13.1.3 Global Forecasted Price of Chip Varistor by Type (2023-2028)
- 13.2 Global Production Forecast by Application (2023-2028)
14 Research Findings and Conclusion
15 Methodology and Data Source
- 15.1 Methodology/Research Approach
- 15.1.1 Research Programs/Design
- 15.1.2 Market Size Estimation
- 15.1.3 Market Breakdown and Data Triangulation
- 15.2 Data Source
- 15.2.1 Secondary Sources
- 15.2.2 Primary Sources
- 15.3 Author List
- 15.4 Disclaimer