|
|
市場調査レポート
商品コード
1100635
ライブIP放送機器の世界市場の分析 (2022年)Global Live IP Broadcast Equipment Market Research Report 2022 |
||||||
|
|
|||||||
|
● お客様のご希望に応じて、既存データの加工や未掲載情報(例:国別セグメント)の追加などの対応が可能です。 詳細はお問い合わせください。 |
|||||||


| ライブIP放送機器の世界市場の分析 (2022年) |
|
出版日: 2022年07月21日
発行: QYResearch
ページ情報: 英文 151 Pages
納期: 2~3営業日
|
- 全表示
- 概要
- 図表
- 目次
COVID-19の大流行により、ライブIP放送機器の世界市場規模は2022年に12億9,906万米ドルと推定され、2028年には29億7,673万米ドルに再調整され、予測期間 (2022年~2028年) のCAGRは14.82%に達すると予測されています。
この健康危機による経済変化を十分に考慮すると、2021年にライブIP放送機器の世界市場の44.62%を占めた放送用スイッチャーは、2028年までに15億2,676万米ドルの価値を持ち、2022年から2028年まで改訂17.05%のCAGRで成長すると予測されます。一方、放送制作センターのセグメントは、この予測期間を通して16.15%のCAGRに変更されています。
北米のライブIP放送機器の市場規模は、2021年に4億2,369万米ドル、欧州は2億2,216万米ドルでした。2021年の北米のシェアは37.57%、欧州のシェアは19.7%で、欧州の市場シェアは2028年には15.91%に達すると予測され、分析期間を通じてCAGR 11.51%をたどっています。アジアでは、日本と韓国が注目され、今後6年間のCAGRはそれぞれ16.36%および14.92%となります。
目次
第1章 ライブIP放送機器:市場概要
- ライブIP放送機器:製品の概要と範囲
- 種類別のセグメント
- 市場規模・成長率の分析:種類別 (2022年・2028年)
- 放送用スイッチャー
- スイッチ・サーバー
- インフラ
- その他
- 用途別のセグメント
- 市場規模・成長率の分析:用途別 (2022年・2028年)
- 放送制作センター
- スタジアム内放送
- 中継車
- その他
- 世界市場の成長見通し
- 世界のライブIP放送機器の収益:推定・予測 (2017年~2028年)
- 世界のライブIP放送機器の生産:推定・予測 (2017年~2028年)
- 地域別の市場規模
- 世界のライブIP放送機器の市場規模:推定・予測、地域別 (2017年・2022年・2028年)
- 北米:推定・予測 (2017年~2028年)
- 欧州:推定・予測 (2017年~2028年)
- 中国:推定・予測 (2017年~2028年)
- 日本:推定・予測 (2017年~2028年)
- 韓国:推定・予測 (2017年~2028年)
第2章 メーカー別の市場競争
- 世界のライブIP放送機器の生産:メーカー別 (2017年~2022年)
- 世界のライブIP放送機器の収益・市場シェア:メーカー別 (2017年~2022年)
- 市場シェア:企業の種類別 (ティア1、ティア2、ティア3)
- 世界のライブIP放送機器の平均価格:メーカー別 (2017年~2022年)
- ライブIP放送機器メーカーの製造拠点・提供エリア・製品種類
- ライブIP放送機器市場の競争状況と動向
第3章 地域別の生産
- 世界のライブIP放送機器の生産:地域別 (2017年~2022年)
- 世界のライブIP放送機器の収益・市場シェア:地域別 (2017年~2022年)
- 世界のライブIP放送機器の生産・収益・価格・粗利益 (2017年~2022年)
- 北米のライブIP放送機器の生産
- 欧州のライブIP放送機器の生産
- 中国のライブIP放送機器の生産 (2017年~2022年)
- 日本のライブIP放送機器の生産 (2017年~2022年)
- 韓国のライブIP放送機器の生産 (2017年~2022年)
第4章 ライブIP放送機器:地域別の消費
- 世界のライブIP放送機器の消費:地域別
- 消費:地域別
- 消費・市場シェア:地域別
- 北米
- 米国
- カナダ
- 欧州
- ドイツ
- フランス
- 英国
- イタリア
- スイス
- オランダ
- アジア太平洋
- 中国
- 日本
- 韓国
- シンガポール
- オーストラリア
- ラテンアメリカ
- メキシコ
- ブラジル
- アルゼンチン
第5章 種類別のセグメント
- ライブIP放送機器の生産・市場シェア:種類別 (2017年~2022年)
- ライブIP放送機器の収益・市場シェア:種類別 (2017年~2022年)
- ライブIP放送機器の価格:種類別 (2017年~2022年)
第6章 用途別のセグメント
- ライブIP放送機器の生産・市場シェア:用途別 (2017年~2022年)
- ライブIP放送機器の収益・市場シェア:用途別 (2017年~2022年)
- ライブIP放送機器の価格:用途別 (2017年~2022年)
第7章 主要企業のプロファイル
- Cisco Systems
- 企業情報
- 製品ポートフォリオ
- 生産・収益・価格・粗利益 (2017年~2022年)
- 主要事業・市場
- Ross Video
- Belden
- Arista Networks
- Grass Valley
- NewTek (Vizrt)
- Evertz Microsystems
- Sony
- Ikegami Tsushinki
- ETL Systems
- LAWO
- Imagine Communication
- Harmonic
- Matrox
- Telos Alliance
- Ericsson
- EVS Broadcast Equipment
- TAG Video Systems
- Beijing Gefei Technology Co Ltd
- AJA Video Systems
第8章 ライブIP放送機器の製造コストの分析
- ライブIP放送機器の主要原材料の分析
- 製造コストの構造比率
- ライブIP放送機器の製造プロセスの分析
- ライブIP放送機器の産業チェーンの分析
第9章 マーケティングチャネル・流通業者・顧客
- マーケティングチャネル
- ライブIP放送機器の流通業者の一覧
- ライブIP放送機器の顧客
第10章 ライブIP放送機器市場:市場力学
- ライブIP放送機器業界の動向
- ライブIP放送機器市場の促進要因
- ライブIP放送機器市場の課題
- ライブIP放送機器市場の抑制要因
第11章 生産・供給予測
- 世界のライブIP放送機器の生産予測:地域別 (2023年~2028年)
- 北米:生産・収益予測 (2023年~2028年)
- 欧州:生産・収益予測 (2023年~2028年)
- 中国:生産・収益予測 (2023年~2028年)
- 日本:生産・収益予測 (2023年~2028年)
- 韓国:生産・収益予測 (2023年~2028年)
第12章 消費・需要予測
- 世界のライブIP放送機器の予測・需要分析
- 北米:消費予測、国別
- 欧州:消費予測、国別
- アジア太平洋:消費予測、地域別
- ラテンアメリカ:消費予測、国別
第13章 種類別・用途別の予測
- 世界の生産・収益・価格予測:種類別 (2023年~2028年)
- 世界の生産・収益・価格予測:用途別 (2023年~2028年)
第14章 調査結果と結論
第15章 調査手法とデータソース
LIST OF TABLES
- Table 1. Global Live IP Broadcast Equipment Market Size by Type (Units) & (US$ Million) & (2022 VS 2028)
- Table 2. Global Live IP Broadcast Equipment Market Size by Application (Units) & (US$ Million) & (2022 VS 2028)
- Table 3. Live IP Broadcast Equipment Market Size Comparison by Region: 2017 VS 2022 VS 2028
- Table 4. Global Live IP Broadcast Equipment Production by Manufacturers (2017-2022) & (Units)
- Table 5. Global Live IP Broadcast Equipment Production Market Share by Manufacturers (2017-2022)
- Table 6. Global Live IP Broadcast Equipment Revenue by Manufacturers (2017-2022) & (US$ Million)
- Table 7. Global Live IP Broadcast Equipment Revenue Share by Manufacturers (2017-2022)
- Table 8. Company Type (Tier 1, Tier 2, and Tier 3) & (based on the Revenue in Live IP Broadcast Equipment as of 2021)
- Table 9. Global Market Live IP Broadcast Equipment Average Price (US$/Unit) of Key Manufacturers (2017-2022)
- Table 10. Manufacturers Live IP Broadcast Equipment Production Sites and Area Served
- Table 11. Manufacturers Live IP Broadcast Equipment Product Type
- Table 12. Global Live IP Broadcast Equipment Manufacturers Market Concentration Ratio (CR5 and HHI)
- Table 13. Mergers & Acquisitions, Expansion Plans
- Table 14. Global Live IP Broadcast Equipment Production (Units) by Region (2017-2022)
- Table 15. Global Live IP Broadcast Equipment Revenue (US$ Million) by Region (2017-2022)
- Table 16. Global Live IP Broadcast Equipment Revenue Market Share by Region (2017-2022)
- Table 17. Global Live IP Broadcast Equipment Production (Units), Revenue (US$ Million), Price (US$/Unit) and Gross Margin (2017-2022)
- Table 18. North America Live IP Broadcast Equipment Production (Units), Revenue (US$ Million), Price (US$/Unit) and Gross Margin (2017-2022)
- Table 19. Europe Live IP Broadcast Equipment Production (Units), Revenue (US$ Million), Price (US$/Unit) and Gross Margin (2017-2022)
- Table 20. China Live IP Broadcast Equipment Production (Units), Revenue (US$ Million), Price (US$/Unit) and Gross Margin (2017-2022)
- Table 21. Japan Live IP Broadcast Equipment Production (Units), Revenue (US$ Million), Price (US$/Unit) and Gross Margin (2017-2022)
- Table 22. South Korea Live IP Broadcast Equipment Production (Units), Revenue (US$ Million), Price (US$/Unit) and Gross Margin (2017-2022)
- Table 23. Global Live IP Broadcast Equipment Consumption by Region (2017-2022) & (Units)
- Table 24. Global Live IP Broadcast Equipment Consumption Market Share by Region (2017-2022)
- Table 25. North America Live IP Broadcast Equipment Consumption by Country (2017-2022) & (Units)
- Table 26. Europe Live IP Broadcast Equipment Consumption by Country (2017-2022) & (Units)
- Table 27. Asia Pacific Live IP Broadcast Equipment Consumption by Region (2017-2022) & (Units)
- Table 28. Latin America Live IP Broadcast Equipment Consumption by Country (2017-2022) & (Units)
- Table 29. Global Live IP Broadcast Equipment Production (Units) by Type (2017-2022)
- Table 30. Global Live IP Broadcast Equipment Production Market Share by Type (2017-2022)
- Table 31. Global Live IP Broadcast Equipment Revenue (US$ Million) by Type (2017-2022)
- Table 32. Global Live IP Broadcast Equipment Revenue Share by Type (2017-2022)
- Table 33. Global Live IP Broadcast Equipment Price (US$/Unit) by Type (2017-2022)
- Table 34. Global Live IP Broadcast Equipment Production (Units) by Application (2017-2022)
- Table 35. Global Live IP Broadcast Equipment Production Market Share by Application (2017-2022)
- Table 36. Global Live IP Broadcast Equipment Revenue (US$ Million) by Application (2017-2022)
- Table 37. Global Live IP Broadcast Equipment Revenue Share by Application (2017-2022)
- Table 38. Global Live IP Broadcast Equipment Price (US$/Unit) by Application (2017-2022)
- Table 39. Cisco Systems Live IP Broadcast Equipment Corporation Information
- Table 40. Cisco Systems Live IP Broadcast Equipment Specification and Application
- Table 41. Cisco Systems Live IP Broadcast Equipment Production (Units), Revenue (US$ Million), Price (USD/Unit) and Gross Margin (2017-2022)
- Table 42. Ross Video Live IP Broadcast Equipment Corporation Information
- Table 43. Ross Video Live IP Broadcast Equipment Specification and Application
- Table 44. Ross Video Live IP Broadcast Equipment Production (Units), Revenue (US$ Million), Price (USD/Unit) and Gross Margin (2017-2022)
- Table 45. Belden Live IP Broadcast Equipment Corporation Information
- Table 46. Belden Live IP Broadcast Equipment Specification and Application
- Table 47. Belden Live IP Broadcast Equipment Production (Units), Revenue (US$ Million), Price (USD/Unit) and Gross Margin (2017-2022)
- Table 48. Arista Networks Live IP Broadcast Equipment Corporation Information
- Table 49. Arista Networks Live IP Broadcast Equipment Specification and Application
- Table 50. Arista Networks Live IP Broadcast Equipment Production (Units), Revenue (US$ Million), Price (USD/Unit) and Gross Margin (2017-2022)
- Table 51. Grass Valley Live IP Broadcast Equipment Corporation Information
- Table 52. Grass Valley Live IP Broadcast Equipment Specification and Application
- Table 53. Grass Valley Live IP Broadcast Equipment Production (Units), Revenue (US$ Million), Price (USD/Unit) and Gross Margin (2017-2022)
- Table 54. NewTek (Vizrt) Live IP Broadcast Equipment Corporation Information
- Table 55. NewTek (Vizrt) Live IP Broadcast Equipment Specification and Application
- Table 56. NewTek (Vizrt) Live IP Broadcast Equipment Production (Units), Revenue (US$ Million), Price (USD/Unit) and Gross Margin (2017-2022)
- Table 57. NewTek (Vizrt) Recent Developments/Updates
- Table 58. Evertz Microsystems Live IP Broadcast Equipment Corporation Information
- Table 59. Evertz Microsystems Live IP Broadcast Equipment Specification and Application
- Table 60. Evertz Microsystems Live IP Broadcast Equipment Production (Units), Revenue (US$ Million), Price (USD/Unit) and Gross Margin (2017-2022)
- Table 61. Sony Live IP Broadcast Equipment Corporation Information
- Table 62. Sony Live IP Broadcast Equipment Specification and Application
- Table 63. Sony Live IP Broadcast Equipment Production (Units), Revenue (US$ Million), Price (USD/Unit) and Gross Margin (2017-2022)
- Table 64. Sony Recent Developments/Updates
- Table 65. Ikegami Tsushinki Live IP Broadcast Equipment Corporation Information
- Table 66. Ikegami Tsushinki Live IP Broadcast Equipment Specification and Application
- Table 67. Ikegami Tsushinki Live IP Broadcast Equipment Production (Units), Revenue (US$ Million), Price (USD/Unit) and Gross Margin (2017-2022)
- Table 68. ETL Systems Live IP Broadcast Equipment Corporation Information
- Table 69. ETL Systems Live IP Broadcast Equipment Specification and Application
- Table 70. ETL Systems Live IP Broadcast Equipment Production (Units), Revenue (US$ Million), Price (USD/Unit) and Gross Margin (2017-2022)
- Table 71. LAWO Live IP Broadcast Equipment Corporation Information
- Table 72. LAWO Live IP Broadcast Equipment Specification and Application
- Table 73. LAWO Live IP Broadcast Equipment Production (Units), Revenue (US$ Million), Price (USD/Unit) and Gross Margin (2017-2022)
- Table 74. Imagine Communication Live IP Broadcast Equipment Corporation Information
- Table 75. Imagine Communication Live IP Broadcast Equipment Specification and Application
- Table 76. Imagine Communication Live IP Broadcast Equipment Production (Units), Revenue (US$ Million), Price (USD/Unit) and Gross Margin (2017-2022)
- Table 77. Harmonic Live IP Broadcast Equipment Corporation Information
- Table 78. Harmonic Live IP Broadcast Equipment Specification and Application
- Table 79. Harmonic Live IP Broadcast Equipment Production (Units), Revenue (US$ Million), Price (USD/Unit) and Gross Margin (2017-2022)
- Table 80. Matrox Live IP Broadcast Equipment Corporation Information
- Table 81. Matrox Live IP Broadcast Equipment Specification and Application
- Table 82. Matrox Live IP Broadcast Equipment Production (Units), Revenue (US$ Million), Price (USD/Unit) and Gross Margin (2017-2022)
- Table 83. Telos Alliance Live IP Broadcast Equipment Corporation Information
- Table 84. Telos Alliance Live IP Broadcast Equipment Specification and Application
- Table 85. Telos Alliance Live IP Broadcast Equipment Production (Units), Revenue (US$ Million), Price (USD/Unit) and Gross Margin (2017-2022)
- Table 86. Ericsson Live IP Broadcast Equipment Corporation Information
- Table 87. Ericsson Live IP Broadcast Equipment Specification and Application
- Table 88. Ericsson Live IP Broadcast Equipment Production (Units), Revenue (US$ Million), Price (USD/Unit) and Gross Margin (2017-2022)
- Table 89. Ericsson Recent Developments/Updates
- Table 90. EVS Broadcast Equipment Live IP Broadcast Equipment Corporation Information
- Table 91. EVS Broadcast Equipment Live IP Broadcast Equipment Specification and Application
- Table 92. EVS Broadcast Equipment Live IP Broadcast Equipment Production (Units), Revenue (US$ Million), Price (USD/Unit) and Gross Margin (2017-2022)
- Table 93. EVS Broadcast Equipment Recent Developments/Updates
- Table 94. TAG Video Systems Live IP Broadcast Equipment Corporation Information
- Table 95. TAG Video Systems Live IP Broadcast Equipment Specification and Application
- Table 96. TAG Video Systems Live IP Broadcast Equipment Production (Units), Revenue (US$ Million), Price (USD/Unit) and Gross Margin (2017-2022)
- Table 97. Beijing Gefei Technology Co Ltd Live IP Broadcast Equipment Corporation Information
- Table 98. Beijing Gefei Technology Co Ltd Live IP Broadcast Equipment Specification and Application
- Table 99. Beijing Gefei Technology Co Ltd Live IP Broadcast Equipment Production (Units), Revenue (US$ Million), Price (USD/Unit) and Gross Margin (2017-2022)
- Table 100. AJA Video Systems Live IP Broadcast Equipment Corporation Information
- Table 101. AJA Video Systems Live IP Broadcast Equipment Specification and Application
- Table 102. AJA Video Systems Live IP Broadcast Equipment Production (Units), Revenue (US$ Million), Price (USD/Unit) and Gross Margin (2017-2022)
- Table 103. Production Base and Market Concentration Rate of Raw Material
- Table 104. Key Suppliers of Raw Materials
- Table 105. Live IP Broadcast Equipment Distributors List
- Table 106. Live IP Broadcast Equipment Customers List
- Table 107. Live IP Broadcast Equipment Market Trends
- Table 108. Live IP Broadcast Equipment Growth Drivers
- Table 109. Live IP Broadcast Equipment Market Challenges
- Table 110. Live IP Broadcast Equipment Market Restraints
- Table 111. Global Live IP Broadcast Equipment Production (Units) Forecast by Region (2023-2028)
- Table 112. North America Live IP Broadcast Equipment Consumption Forecast by Country (2023-2028) & (Units)
- Table 113. Europe Live IP Broadcast Equipment Consumption Forecast by Country (2023-2028) & (Units)
- Table 114. Asia Pacific Live IP Broadcast Equipment Consumption Forecast by Region (2023-2028) & (Units)
- Table 115. Latin America Live IP Broadcast Equipment Consumption Forecast by Country (2023-2028) & (Units)
- Table 116. Global Live IP Broadcast Equipment Production Forecast by Type (2023-2028) & (Units)
- Table 117. Global Live IP Broadcast Equipment Revenue Forecast by Type (2023-2028) & (US$ Million)
- Table 118. Global Live IP Broadcast Equipment Price Forecast by Type (2023-2028) & (US$/Unit)
- Table 119. Global Live IP Broadcast Equipment Production Forecast by Application (2023-2028) & (Units)
- Table 120. Global Live IP Broadcast Equipment Revenue Forecast by Application (2023-2028) & (US$ Million)
- Table 121. Global Live IP Broadcast Equipment Price Forecast by Application (2023-2028) & (US$/Unit)
- Table 122. Research Programs/Design for This Report
- Table 123. Key Data Information from Secondary Sources
- Table 124. Key Data Information from Primary Sources
List of Figures
- Figure 1. Product Picture of Live IP Broadcast Equipment
- Figure 2. Global Live IP Broadcast Equipment Market Share by Type: 2022 VS 2028
- Figure 3. Broadcast Switcher Product Picture
- Figure 4. Switches and Servers Product Picture
- Figure 5. Infrastructure Product Picture
- Figure 6. Others Product Picture
- Figure 7. Global Live IP Broadcast Equipment Market Share by Application: 2022 VS 2028
- Figure 8. Broadcast Production Centers
- Figure 9. In-Stadium Broadcast
- Figure 10. Outside Broadcast Vans
- Figure 11. Others
- Figure 12. Global Live IP Broadcast Equipment Revenue (US$ Million), 2017 VS 2022 VS 2028
- Figure 13. Global Live IP Broadcast Equipment Revenue (US$ Million) (2017-2028)
- Figure 14. Global Live IP Broadcast Equipment Production (Units) & (2017-2028)
- Figure 15. Live IP Broadcast Equipment Market Size Comparison by Region: 2017 VS 2022 VS 2028
- Figure 16. North America Live IP Broadcast Equipment Revenue (US$ Million) Growth Rate (2017-2028)
- Figure 17. Europe Live IP Broadcast Equipment Revenue (US$ Million) Growth Rate (2017-2028)
- Figure 18. China Live IP Broadcast Equipment Revenue (US$ Million) Growth Rate (2017-2028)
- Figure 19. Japan Live IP Broadcast Equipment Revenue (US$ Million) Growth Rate (2017-2028)
- Figure 20. South Korea Live IP Broadcast Equipment Revenue (US$ Million) Growth Rate (2017-2028)
- Figure 21. Live IP Broadcast Equipment Production Share by Manufacturers in 2021
- Figure 22. Global Live IP Broadcast Equipment Revenue Share by Manufacturers in 2021
- Figure 23. Live IP Broadcast Equipment Market Share by Company Type (Tier 1, Tier 2, and Tier 3): 2017 VS 2021
- Figure 24. Global Market Live IP Broadcast Equipment Average Price (US$/Unit) of Key Manufacturers in 2021
- Figure 25. The Global 5 and 10 Largest Players: Market Share by Live IP Broadcast Equipment Revenue in 2021
- Figure 26. Global Live IP Broadcast Equipment Production Market Share by Region (2017-2022)
- Figure 27. North America Live IP Broadcast Equipment Production (Units) Growth Rate (2017-2022)
- Figure 28. Europe Live IP Broadcast Equipment Production (Units) Growth Rate (2017-2022)
- Figure 29. China Live IP Broadcast Equipment Production (Units) Growth Rate (2017-2022)
- Figure 30. Japan Live IP Broadcast Equipment Production (Units) Growth Rate (2017-2022)
- Figure 31. South Korea Live IP Broadcast Equipment Production (Units) Growth Rate (2017-2022)
- Figure 32. Global Live IP Broadcast Equipment Consumption Market Share by Region (2017-2022)
- Figure 33. North America Live IP Broadcast Equipment Consumption and Growth Rate (2017-2022) & (Units)
- Figure 34. North America Live IP Broadcast Equipment Consumption Market Share by Country in 2021
- Figure 35. U.S. Live IP Broadcast Equipment Consumption and Growth Rate (2017-2022) & (Units)
- Figure 36. Canada Live IP Broadcast Equipment Consumption (Units) and Growth Rate (2017-2022)
- Figure 37. Europe Live IP Broadcast Equipment Consumption and Growth Rate (2017-2022) & (Units)
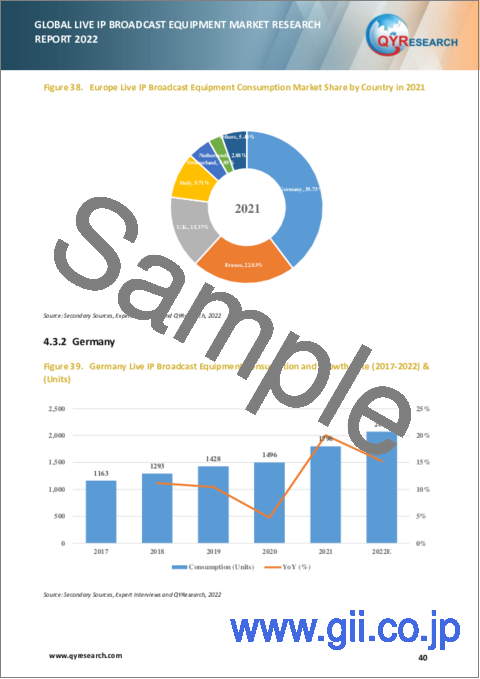
- Figure 38. Europe Live IP Broadcast Equipment Consumption Market Share by Country in 2021
- Figure 39. Germany Live IP Broadcast Equipment Consumption and Growth Rate (2017-2022) & (Units)
- Figure 40. France Live IP Broadcast Equipment Consumption and Growth Rate (2017-2022) & (Units)
- Figure 41. U.K. Live IP Broadcast Equipment Consumption and Growth Rate (2017-2022) & (Units)
- Figure 42. Italy Live IP Broadcast Equipment Consumption and Growth Rate (2017-2022) & (Units)
- Figure 43. Switzerland Live IP Broadcast Equipment Consumption and Growth Rate (2017-2022) & (Units)
- Figure 44. Netherlands Live IP Broadcast Equipment Consumption and Growth Rate (2017-2022) & (Units)
- Figure 45. Asia Pacific Live IP Broadcast Equipment Consumption and Growth Rate (Units)
- Figure 46. Asia Pacific Live IP Broadcast Equipment Consumption Market Share by Region in 2021
- Figure 47. China Live IP Broadcast Equipment Consumption and Growth Rate (2017-2022) & (Units)
- Figure 48. Japan Live IP Broadcast Equipment Consumption and Growth Rate (2017-2022) & (Units)
- Figure 49. South Korea Live IP Broadcast Equipment Consumption and Growth Rate (2017-2022) & (Units)
- Figure 50. Singapore Live IP Broadcast Equipment Consumption and Growth Rate (2017-2022) & (Units)
- Figure 51. Australia Live IP Broadcast Equipment Consumption and Growth Rate (2017-2022) & (Units)
- Figure 52. Latin America Live IP Broadcast Equipment Consumption and Growth Rate (Units)
- Figure 53. Latin America Live IP Broadcast Equipment Consumption Market Share by Country in 2021
- Figure 54. Mexico Live IP Broadcast Equipment Consumption and Growth Rate (2017-2022) & (Units)
- Figure 55. Brazil Live IP Broadcast Equipment Consumption and Growth Rate (2017-2022) & (Units)
- Figure 56. Argentina Live IP Broadcast Equipment Consumption and Growth Rate (2017-2022) & (Units)
- Figure 57. Production Market Share of Live IP Broadcast Equipment by Type (2017-2022)
- Figure 58. Production Market Share of Live IP Broadcast Equipment by Type in 2021
- Figure 59. Revenue Share of Live IP Broadcast Equipment by Type (2017-2022)
- Figure 60. Revenue Market Share of Live IP Broadcast Equipment by Type in 2021
- Figure 61. Production Market Share of Live IP Broadcast Equipment by Application (2017-2022)
- Figure 62. Production Market Share of Live IP Broadcast Equipment by Application in 2021
- Figure 63. Revenue Share of Live IP Broadcast Equipment by Application (2017-2022)
- Figure 64. Revenue Market Share of Live IP Broadcast Equipment by Application in 2021
- Figure 65. Matrox Encoder Product Picture
- Figure 66. Manufacturing Cost Structure of Live IP Broadcast Equipment
- Figure 67. Manufacturing Process Analysis of Live IP Broadcast Equipment
- Figure 68. Live IP Broadcast Equipment Industrial Chain Analysis
- Figure 69. Channels of Distribution
- Figure 70. Distributors Profiles
- Figure 71. Global Live IP Broadcast Equipment Production Market Share Forecast by Region (2023-2028)
- Figure 72. North America Live IP Broadcast Equipment Production (Units) Growth Rate Forecast (2023-2028)
- Figure 73. Europe Live IP Broadcast Equipment Production (Units) Growth Rate Forecast (2023-2028)
- Figure 74. China Live IP Broadcast Equipment Production (Units) Growth Rate Forecast (2023-2028)
- Figure 75. Japan Live IP Broadcast Equipment Production (Units) Growth Rate Forecast (2023-2028)
- Figure 76. South Korea Live IP Broadcast Equipment Production (Units) Growth Rate Forecast (2023-2028)
- Figure 77. Global Forecasted Demand Analysis of Live IP Broadcast Equipment (2017-2028) & (Units)
- Figure 78. Global Live IP Broadcast Equipment Production Market Share Forecast by Type (2023-2028)
- Figure 79. Global Live IP Broadcast Equipment Revenue Market Share Forecast by Type (2023-2028)
- Figure 80. Global Live IP Broadcast Equipment Production Market Share Forecast by Application (2023-2028)
- Figure 81. Global Live IP Broadcast Equipment Revenue Market Share Forecast by Application (2023-2028)
- Figure 82. Bottom-up and Top-down Approaches for This Report
- Figure 83. Data Triangulation 126
Due to the COVID-19 pandemic, the global Live IP Broadcast Equipment market size is estimated to be worth US$ 1299.06 million in 2022 and is forecast to a readjusted size of US$ 2976.73 million by 2028 with a CAGR of 14.82% during the forecast period 2022-2028. Fully considering the economic change by this health crisis, Broadcast Switcher accounting for 44.62% of the Live IP Broadcast Equipment global market in 2021, is projected to value US$ 1526.76 million by 2028, growing at a revised 17.05% CAGR from 2022 to 2028. While Broadcast Production Centers segment is altered to an 16.15 % CAGR throughout this forecast period.
North America Live IP Broadcast Equipment market size was US$ 423.69 million in 2021, while Europe was US$ 222.16 million. The proportion of the North America was 37.57% in 2021, while Europe's percentage was 19.7%, and it is predicted that Europe market share will reach 15.91% in 2028, trailing a CAGR of 11.51 % through the analysis period. As for the Asia, the notable markets are Japan and South Korea, CAGR is 16.36 % and 14.92 % respectively for the next 6-year period.
The global major manufacturers of Live IP Broadcast Equipment include Cisco Systems, Ross Video, Belden, Arista Networks, Grass Valley, NewTek (Vizrt), Evertz Microsystems, Sony, Ikegami Tsushinki, ETL Systems, LAWO, Imagine Communication, Harmonic, Matrox, Telos Alliance, Ericsson, EVS Broadcast Equipment, TAG Video Systems, Bejing Gefei Technology Co Ltd, AJA Video Systems, etc. In terms of revenue, the global five largest players hold a 35.82% market share of Live IP Broadcast Equipment in 2021.
Drivers and Restrains:
The research report has incorporated the analysis of different factors that augment the market's growth. It constitutes trends, restraints, and drivers that transform the market in either a positive or negative manner. This section also provides the scope of different segments and applications that can potentially influence the market in the future. The detailed information is based on current trends and historic milestones. This section also provides an analysis of the volume of production about the global market and about each type from 2017 to 2028. This section mentions the volume of production by region from 2017 to 2028. Pricing analysis is included in the report according to each type from the year 2017 to 2028, manufacturer from 2017 to 2022, region from 2017 to 2022, and global price from 2017 to 2028.
A thorough evaluation of the restrains included in the report portrays the contrast to drivers and gives room for strategic planning. Factors that overshadow the market growth are pivotal as they can be understood to devise different bends for getting hold of the lucrative opportunities that are present in the ever-growing market. Additionally, insights into market expert's opinions have been taken to understand the market better.
Segment Analysis:
The research report includes specific segments by region (country), by manufacturers, by Type and by Application. Each type provides information about the production during the forecast period of 2017 to 2028. by Application segment also provides consumption during the forecast period of 2017 to 2028. Understanding the segments helps in identifying the importance of different factors that aid the market growth.
By Company
- Cisco Systems
- Ross Video
- Belden
- Arista Networks
- Grass Valley
- NewTek (Vizrt)
- Evertz Microsystems
- Sony
- Ikegami Tsushinki
- ETL Systems
- LAWO
- Imagine Communication
- Harmonic
- Matrox
- Telos Alliance
- Ericsson
- EVS Broadcast Equipment
- TAG Video Systems
- Bejing Gefei Technology Co Ltd
- AJA Video Systems
Segment by Type
- Broadcast Switcher
- Switches and Servers
- Infrastructure
- Others
Segment by Application
- Broadcast Production Centers
- In-Stadium Broadcast
- Outside Broadcast Vans
- Others
Production by Region
- North America
- Europe
- China
- Japan
- South Korea
Consumption by Region
- North America
- U.S.
- Canada
- Asia-Pacific
- China
- Japan
- South Korea
- Singapore
- Australia
- Europe
- Germany
- France
- U.K.
- Italy
- Switzerland
- Netherlands
- Rest of Europe
- South America
- Mexico
- Brazil
- Argentina
- Rest of South America
TABLE OF CONTENTS
1 Live IP Broadcast Equipment Market Overview
- 1.1 Product Overview and Scope of Live IP Broadcast Equipment
- 1.2 Live IP Broadcast Equipment Segment by Type
- 1.2.1 Global Live IP Broadcast Equipment Market Size Growth Rate Analysis by Type: 2022 VS 2028
- 1.2.2 Broadcast Switcher
- 1.2.3 Switches and Servers
- 1.2.4 Infrastructure
- 1.2.5 Others
- 1.3 Live IP Broadcast Equipment Segment by Application
- 1.3.1 Global Live IP Broadcast Equipment Market Size Growth Rate Analysis by Application: 2022 VS 2028
- 1.3.2 Broadcast Production Centers
- 1.3.3 In-Stadium Broadcast
- 1.3.4 Outside Broadcast Vans
- 1.3.5 Others
- 1.4 Global Market Growth Prospects
- 1.4.1 Global Live IP Broadcast Equipment Revenue Estimates and Forecasts (2017-2028)
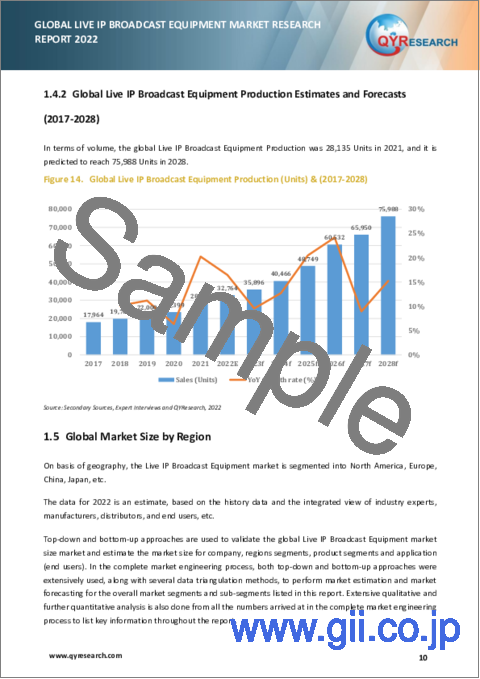
- 1.4.2 Global Live IP Broadcast Equipment Production Estimates and Forecasts (2017-2028)
- 1.5 Global Market Size by Region
- 1.5.1 Global Live IP Broadcast Equipment Market Size Estimates and Forecasts by Region: 2017 VS 2022 VS 2028
- 1.5.2 North America Live IP Broadcast Equipment Estimates and Forecasts (2017-2028)
- 1.5.3 Europe Live IP Broadcast Equipment Estimates and Forecasts (2017-2028)
- 1.5.4 China Live IP Broadcast Equipment Estimates and Forecasts (2017-2028)
- 1.5.5 Japan Live IP Broadcast Equipment Estimates and Forecasts (2017-2028)
- 1.5.6 South Korea Live IP Broadcast Equipment Estimates and Forecasts (2017-2028)
2 Market Competition by Manufacturers
- 2.1 Global Live IP Broadcast Equipment Production by Manufacturers (2017-2022)
- 2.2 Global Live IP Broadcast Equipment Revenue Market Share by Manufacturers (2017-2022)
- 2.3 Live IP Broadcast Equipment Market Share by Company Type (Tier 1, Tier 2, and Tier 3)
- 2.4 Global Live IP Broadcast Equipment Average Price by Manufacturers (2017-2022)
- 2.5 Manufacturers Live IP Broadcast Equipment Production Sites, Area Served, Product Type
- 2.6 Live IP Broadcast Equipment Market Competitive Situation and Trends
- 2.6.1 Live IP Broadcast Equipment Market Concentration Rate
- 2.6.2 Global 5 and 10 Largest Live IP Broadcast Equipment Players Market Share by Revenue
- 2.6.3 Mergers & Acquisitions, Expansion
3 Production by Region
- 3.1 Global Production of Live IP Broadcast Equipment by Region (2017-2022)
- 3.2 Global Live IP Broadcast Equipment Revenue Market Share by Region (2017-2022)
- 3.3 Global Live IP Broadcast Equipment Production, Revenue, Price and Gross Margin (2017-2022)
- 3.4 North America Live IP Broadcast Equipment Production
- 3.4.1 North America Live IP Broadcast Equipment Production Growth Rate (2017-2022)
- 3.4.2 North America Live IP Broadcast Equipment Production, Revenue, Price and Gross Margin (2017-2022)
- 3.5 Europe Live IP Broadcast Equipment Production
- 3.5.1 Europe Live IP Broadcast Equipment Production Growth Rate (2017-2022)
- 3.5.2 Europe Live IP Broadcast Equipment Production, Revenue, Price and Gross Margin (2017-2022)
- 3.6 China Live IP Broadcast Equipment Production (2017-2022)
- 3.6.1 China Live IP Broadcast Equipment Production Growth Rate (2017-2022)
- 3.6.2 China Live IP Broadcast Equipment Production, Revenue, Price and Gross Margin (2017-2022)
- 3.7 Japan Live IP Broadcast Equipment Production (2017-2022)
- 3.7.1 Japan Live IP Broadcast Equipment Production Growth Rate (2017-2022)
- 3.7.2 Japan Live IP Broadcast Equipment Production, Revenue, Price and Gross Margin (2017-2022)
- 3.8 South Korea Live IP Broadcast Equipment Production (2017-2022)
- 3.8.1 South Korea Live IP Broadcast Equipment Production Growth Rate (2017-2022)
- 3.8.2 South Korea Live IP Broadcast Equipment Production, Revenue, Price and Gross Margin (2017-2022)
4 Live IP Broadcast Equipment Consumption by Region
- 4.1 Global Live IP Broadcast Equipment Consumption by Region
- 4.1.1 Global Live IP Broadcast Equipment Consumption by Region
- 4.1.2 Global Live IP Broadcast Equipment Consumption Market Share by Region
- 4.2 North America
- 4.2.1 North America Live IP Broadcast Equipment Consumption by Country
- 4.2.2 U.S.
- 4.2.3 Canada
- 4.3 Europe
- 4.3.1 Europe Live IP Broadcast Equipment Consumption by Country
- 4.3.2 Germany
- 4.3.3 France
- 4.3.4 U.K.
- 4.3.5 Italy
- 4.3.6 Switzerland
- 4.3.7 Netherlands
- 4.4 Asia Pacific
- 4.4.1 Asia Pacific Live IP Broadcast Equipment Consumption by Region
- 4.4.2 China
- 4.4.3 Japan
- 4.4.4 South Korea
- 4.4.5 Singapore
- 4.4.6 Australia
- 4.5 Latin America
- 4.5.1 Latin America Live IP Broadcast Equipment Consumption by Country
- 4.5.2 Mexico
- 4.5.3 Brazil
- 4.5.4 Argentina
5 Segment by Type
- 5.1 Global Live IP Broadcast Equipment Production Market Share by Type (2017-2022)
- 5.2 Global Live IP Broadcast Equipment Revenue Market Share by Type (2017-2022)
- 5.3 Global Live IP Broadcast Equipment Price by Type (2017-2022)
6 Segment by Application
- 6.1 Global Live IP Broadcast Equipment Production Market Share by Application (2017-2022)
- 6.2 Global Live IP Broadcast Equipment Revenue Market Share by Application (2017-2022)
- 6.3 Global Live IP Broadcast Equipment Price by Application (2017-2022)
7 Key Companies Profiled
- 7.1 Cisco Systems
- 7.1.1 Cisco Systems Live IP Broadcast Equipment Corporation Information
- 7.1.2 Cisco Systems Live IP Broadcast Equipment Product Portfolio
- 7.1.3 Cisco Systems Live IP Broadcast Equipment Production, Revenue, Price and Gross Margin (2017-2022)
- 7.1.4 Cisco Systems Main Business and Markets Served
- 7.2 Ross Video
- 7.2.1 Ross Video Live IP Broadcast Equipment Corporation Information
- 7.2.2 Ross Video Live IP Broadcast Equipment Product Portfolio
- 7.2.3 Ross Video Live IP Broadcast Equipment Production, Revenue, Price and Gross Margin (2017-2022)
- 7.2.4 Ross Video Main Business and Markets Served
- 7.3 Belden
- 7.3.1 Belden Live IP Broadcast Equipment Corporation Information
- 7.3.2 Belden Live IP Broadcast Equipment Product Portfolio
- 7.3.3 Belden Live IP Broadcast Equipment Production, Revenue, Price and Gross Margin (2017-2022)
- 7.3.4 Belden Main Business and Markets Served
- 7.4 Arista Networks
- 7.4.1 Arista Networks Live IP Broadcast Equipment Corporation Information
- 7.4.2 Arista Networks Live IP Broadcast Equipment Product Portfolio
- 7.4.3 Arista Networks Live IP Broadcast Equipment Production, Revenue, Price and Gross Margin (2017-2022)
- 7.4.4 Arista Networks Main Business and Markets Served
- 7.5 Grass Valley
- 7.5.1 Grass Valley Live IP Broadcast Equipment Corporation Information
- 7.5.2 Grass Valley Live IP Broadcast Equipment Product Portfolio
- 7.5.3 Grass Valley Live IP Broadcast Equipment Production, Revenue, Price and Gross Margin (2017-2022)
- 7.5.4 Grass Valley Main Business and Markets Served
- 7.6 NewTek (Vizrt)
- 7.6.1 NewTek (Vizrt) Live IP Broadcast Equipment Corporation Information
- 7.6.2 NewTek (Vizrt) Live IP Broadcast Equipment Product Portfolio
- 7.6.3 NewTek (Vizrt) Live IP Broadcast Equipment Production, Revenue, Price and Gross Margin (2017-2022)
- 7.6.4 NewTek (Vizrt) Main Business and Markets Served
- 7.6.5 NewTek (Vizrt) Recent Developments/Updates
- 7.7 Evertz Microsystems
- 7.7.1 Evertz Microsystems Live IP Broadcast Equipment Corporation Information
- 7.7.2 Evertz Microsystems Live IP Broadcast Equipment Product Portfolio
- 7.7.3 Evertz Microsystems Live IP Broadcast Equipment Production, Revenue, Price and Gross Margin (2017-2022)
- 7.7.4 Evertz Microsystems Main Business and Markets Served
- 7.8 Sony
- 7.8.1 Sony Live IP Broadcast Equipment Corporation Information
- 7.8.2 Sony Live IP Broadcast Equipment Product Portfolio
- 7.8.3 Sony Live IP Broadcast Equipment Production, Revenue, Price and Gross Margin (2017-2022)
- 7.8.4 Sony Main Business and Markets Served
- 7.8.5 Sony Recent Developments/Updates
- 7.9 Ikegami Tsushinki
- 7.9.1 Ikegami Tsushinki Live IP Broadcast Equipment Corporation Information
- 7.9.2 Ikegami Tsushinki Live IP Broadcast Equipment Product Portfolio
- 7.9.3 Ikegami Tsushinki Live IP Broadcast Equipment Production, Revenue, Price and Gross Margin (2017-2022)
- 7.9.4 Ikegami Tsushinki Main Business and Markets Served
- 7.10 ETL Systems
- 7.10.1 ETL Systems Live IP Broadcast Equipment Corporation Information
- 7.10.2 ETL Systems Live IP Broadcast Equipment Product Portfolio
- 7.10.3 ETL Systems Live IP Broadcast Equipment Production, Revenue, Price and Gross Margin (2017-2022)
- 7.10.4 ETL Systems Main Business and Markets Served
- 7.11 LAWO
- 7.11.1 LAWO Live IP Broadcast Equipment Corporation Information
- 7.11.2 LAWO Live IP Broadcast Equipment Product Portfolio
- 7.11.3 LAWO Live IP Broadcast Equipment Production, Revenue, Price and Gross Margin (2017-2022)
- 7.11.4 LAWO Main Business and Markets Served
- 7.12 Imagine Communication
- 7.12.1 Imagine Communication Live IP Broadcast Equipment Corporation Information
- 7.12.2 Imagine Communication Live IP Broadcast Equipment Product Portfolio
- 7.12.3 Imagine Communication Live IP Broadcast Equipment Production, Revenue, Price and Gross Margin (2017-2022)
- 7.12.4 Imagine Communication Main Business and Markets Served
- 7.13 Harmonic
- 7.13.1 Harmonic Live IP Broadcast Equipment Corporation Information
- 7.13.2 Harmonic Live IP Broadcast Equipment Product Portfolio
- 7.13.3 Harmonic Live IP Broadcast Equipment Production, Revenue, Price and Gross Margin (2017-2022)
- 7.13.4 Harmonic Main Business and Markets Served
- 7.14 Matrox
- 7.14.1 Matrox Live IP Broadcast Equipment Corporation Information
- 7.14.2 Matrox Live IP Broadcast Equipment Product Portfolio
- 7.14.3 Matrox Live IP Broadcast Equipment Production, Revenue, Price and Gross Margin (2017-2022)
- 7.14.4 Matrox Main Business and Markets Served
- 7.15 Telos Alliance
- 7.15.1 Telos Alliance Live IP Broadcast Equipment Corporation Information
- 7.15.2 Telos Alliance Live IP Broadcast Equipment Product Portfolio
- 7.15.3 Telos Alliance Live IP Broadcast Equipment Production, Revenue, Price and Gross Margin (2017-2022)
- 7.15.4 Telos Alliance Main Business and Markets Served
- 7.16 Ericsson
- 7.16.1 Ericsson Live IP Broadcast Equipment Corporation Information
- 7.16.2 Ericsson Live IP Broadcast Equipment Product Portfolio
- 7.16.3 Ericsson Live IP Broadcast Equipment Production, Revenue, Price and Gross Margin (2017-2022)
- 7.16.4 Ericsson Main Business and Markets Served
- 7.16.5 Ericsson Recent Developments/Updates
- 7.17 EVS Broadcast Equipment
- 7.17.1 EVS Broadcast Equipment Live IP Broadcast Equipment Corporation Information
- 7.17.2 EVS Broadcast Equipment Live IP Broadcast Equipment Product Portfolio
- 7.17.3 EVS Broadcast Equipment Live IP Broadcast Equipment Production, Revenue, Price and Gross Margin (2017-2022)
- 7.17.4 EVS Broadcast Equipment Main Business and Markets Served
- 7.17.5 EVS Broadcast Equipment Recent Developments/Updates
- 7.18 TAG Video Systems
- 7.18.1 TAG Video Systems Live IP Broadcast Equipment Corporation Information
- 7.18.2 TAG Video Systems Live IP Broadcast Equipment Product Portfolio
- 7.18.3 TAG Video Systems Live IP Broadcast Equipment Production, Revenue, Price and Gross Margin (2017-2022)
- 7.18.4 TAG Video Systems Main Business and Markets Served
- 7.19 Beijing Gefei Technology Co Ltd
- 7.19.1 Beijing Gefei Technology Co Ltd Live IP Broadcast Equipment Corporation Information
- 7.19.2 Beijing Gefei Technology Co Ltd Live IP Broadcast Equipment Product Portfolio
- 7.19.3 Beijing Gefei Technology Co Ltd Live IP Broadcast Equipment Production, Revenue, Price and Gross Margin (2017-2022)
- 7.19.4 Beijing Gefei Technology Co Ltd Main Business and Markets Served
- 7.20 AJA Video Systems
- 7.20.1 AJA Video Systems Live IP Broadcast Equipment Corporation Information
- 7.20.2 AJA Video Systems Live IP Broadcast Equipment Product Portfolio
- 7.20.3 AJA Video Systems Live IP Broadcast Equipment Production, Revenue, Price and Gross Margin (2017-2022)
- 7.20.4 AJA Video Systems Main Business and Markets Served
8 Live IP Broadcast Equipment Manufacturing Cost Analysis
- 8.1 Live IP Broadcast Equipment Key Raw Materials Analysis
- 8.1.1 Key Raw Materials
- 8.1.2 Key Suppliers of Raw Materials
- 8.2 Proportion of Manufacturing Cost Structure
- 8.3 Manufacturing Process Analysis of Live IP Broadcast Equipment
- 8.4 Live IP Broadcast Equipment Industrial Chain Analysis
9 Marketing Channel, Distributors and Customers
- 9.1 Marketing Channel
- 9.2 Live IP Broadcast Equipment Distributors List
- 9.3 Live IP Broadcast Equipment Customers
10 Live IP Broadcast Equipment Market Dynamics
- 10.1 Live IP Broadcast Equipment Industry Trends
- 10.2 Live IP Broadcast Equipment Growth Drivers
- 10.3 Live IP Broadcast Equipment Market Challenges
- 10.4 Live IP Broadcast Equipment Market Restraints
11 Production and Supply Forecast
- 11.1 Global Forecasted Production of Live IP Broadcast Equipment by Region (2023-2028)
- 11.2 North America Live IP Broadcast Equipment Production, Revenue Forecast (2023-2028)
- 11.3 Europe Live IP Broadcast Equipment Production, Revenue Forecast (2023-2028)
- 11.4 China Live IP Broadcast Equipment Production, Revenue Forecast (2023-2028)
- 11.5 Japan Live IP Broadcast Equipment Production, Revenue Forecast (2023-2028)
- 11.6 South Korea Live IP Broadcast Equipment Production, Revenue Forecast (2023-2028)
12 Consumption and Demand Forecast
- 12.1 Global Forecasted Demand Analysis of Live IP Broadcast Equipment
- 12.2 North America Forecasted Consumption of Live IP Broadcast Equipment by Country
- 12.3 Europe Market Forecasted Consumption of Live IP Broadcast Equipment by Country
- 12.4 Asia Pacific Market Forecasted Consumption of Live IP Broadcast Equipment by Region
- 12.5 Latin America Forecasted Consumption of Live IP Broadcast Equipment by Country
13 Forecast by Type and by Application
- 13.1 Global Production, Revenue and Price Forecast by Type (2023-2028)
- 13.1.1 Global Forecasted Production of Live IP Broadcast Equipment by Type (2023-2028)
- 13.1.2 Global Forecasted Revenue of Live IP Broadcast Equipment by Type (2023-2028)
- 13.1.3 Global Forecasted Price of Live IP Broadcast Equipment by Type (2023-2028)
- 13.2 Global Production, Revenue and Price Forecast by Application (2023-2028)
- 13.2.1 Global Forecasted Production of Live IP Broadcast Equipment by Application (2023-2028)
- 13.2.2 Global Forecasted Revenue of Live IP Broadcast Equipment by Application (2023-2028)
- 13.2.3 Global Forecasted Price of Live IP Broadcast Equipment by Application (2023-2028)
14 Research Findings and Conclusion
15 Methodology and Data Source
- 15.1 Methodology/Research Approach
- 15.1.1 Research Programs/Design
- 15.1.2 Market Size Estimation
- 15.1.3 Market Breakdown and Data Triangulation
- 15.2 Data Source
- 15.2.1 Secondary Sources
- 15.2.2 Primary Sources
- 15.3 Author List
- 15.4 Disclaimer