|
|
市場調査レポート
商品コード
1224407
遺伝子組み換えヒト血清アルブミンの世界市場:専門的分析レポート (2023年)Global Recombinant Human Serum Albumin Market Professional Survey Report 2023 |
||||||
|
|
|||||||
|
● お客様のご希望に応じて、既存データの加工や未掲載情報(例:国別セグメント)の追加などの対応が可能です。 詳細はお問い合わせください。 |
|||||||


| 遺伝子組み換えヒト血清アルブミンの世界市場:専門的分析レポート (2023年) |
|
出版日: 2023年02月23日
発行: QYResearch
ページ情報: 英文 113 Pages
納期: 2~3営業日
|
- 全表示
- 概要
- 図表
- 目次
世界の遺伝子組み換えヒト血清アルブミンの市場規模は、2021年に6,955万米ドルに達した後、2028年末には1億1,410万米ドルに達し、2022年から2028年の間に7.28%のCAGRで成長すると予測されています。
当レポートでは、世界の遺伝子組み換えヒト血清アルブミンの市場について分析し、種類別・用途別・地域別 (国別) の市場動向の見通し (2018年~2029年)、主要企業のプロファイルなどについて調査しております。
目次
第1章 遺伝子組み換えヒト血清アルブミン:業界分析
- 遺伝子組み換えヒト血清アルブミンの定義
- 種類別の市場セグメント
- 生産・成長率の比較:種類別 (2022年~2029年)
- OsrHSA
- ScrHSA
- 用途別の市場セグメント
- 消費の比較:用途別 (2022年~2029年)
- 細胞培養培地
- 医療用サプリメント
- 遺伝子組み換えヒト血清アルブミン市場全体 (2017年・2021年・2028年)
- 世界の遺伝子組み換えヒト血清アルブミンの収益 (2017年~2028年)
- 世界の遺伝子組み換えヒト血清アルブミンの生産 (2017年~2028年)
- 北米市場の現状・展望 (2017年~2028年)
- 欧州市場の現状・展望 (2017年~2028年)
- 中国市場の現状・展望 (2017年~2028年)
- インド市場の現状・展望 (2017年~2028年)
第2章 製造コスト構造の分析
- 原材料とサプライヤー
- 遺伝子組み換えヒト血清アルブミンの製造コスト構造の分析
- 遺伝子組み換えヒト血清アルブミンの製造プロセスの分析
- 遺伝子組み換えヒト血清アルブミンの産業チェーンの構造
第3章 遺伝子組み換えヒト血清アルブミンの開発・製造プラントの分析
- 主要メーカーの本社:遺伝子組み換えヒト血清アルブミンの生産別のランキング
- 世界の遺伝子組み換えヒト血清アルブミンメーカー:製造拠点・設立時期
- 遺伝子組み換えヒト血清アルブミンの主要メーカー:主力製品
- 近年の開発・拡張計画
第4章 主要メーカーの主要人物
- 世界の遺伝子組み換えヒト血清アルブミンの大手メーカー:生産分析
- 世界の遺伝子組み換えヒト血清アルブミンの大手メーカー:収益分析
- 世界の遺伝子組み換えヒト血清アルブミン市場:企業の種類別 (タイプ1、タイプ2、タイプ3)
- 世界の遺伝子組み換えヒト血清アルブミンの大手メーカー:価格分析
- 市場集中度
第5章 遺伝子組み換えヒト血清アルブミン:地域別の市場分析
- 遺伝子組み換えヒト血清アルブミンの市場規模:地域別 (2017年~2022年)
- 遺伝子組み換えヒト血清アルブミンの生産:地域別 (2017年~2022年)
- 遺伝子組み換えヒト血清アルブミンの収益:地域別 (2017年~2022年)
- 遺伝子組み換えヒト血清アルブミンの市場規模:地域別 (2023年~2028年)
- 遺伝子組み換えヒト血清アルブミンの生産:地域別 (2023年~2028年)
- 遺伝子組み換えヒト血清アルブミンの収益:地域別 (2023年~2028年)
- 遺伝子組み換えヒト血清アルブミンの消費:地域別
- 遺伝子組み換えヒト血清アルブミンの消費:地域別 (2017-2022)
- 遺伝子組み換えヒト血清アルブミンの消費:地域別 (2023-2028)
- 北米の遺伝子組み換えヒト血清アルブミン市場の分析
- 主要メーカー
- 域内の遺伝子組み換えヒト血清アルブミンの消費量
- 欧州の遺伝子組み換えヒト血清アルブミン市場の分析
- 日本の遺伝子組み換えヒト血清アルブミン市場の分析
- 中国の遺伝子組み換えヒト血清アルブミン市場の分析
- インドの遺伝子組み換えヒト血清アルブミン市場の分析
- 東南アジアの遺伝子組み換えヒト血清アルブミン市場の分析
第6章 遺伝子組み換えヒト血清アルブミン:種類別の市場分析
- 遺伝子組み換えヒト血清アルブミンの市場規模:種類別 (2017年~2022年)
- 遺伝子組み換えヒト血清アルブミンの市場規模:種類別 (2023年~2028年)
- 遺伝子組み換えヒト血清アルブミンの価格:種類別
第7章 遺伝子組み換えヒト血清アルブミン:用途別の市場分析
- 概要
- 消費市場シェア:用途別 (2017年~2022年)
- 消費市場シェア:用途別 (2023年~2028年)
第8章 主要企業のプロファイル
- Albumedix
- 企業概要
- 主要製品
- 消費、収益、粗利益 (2017年~2022年)
- 近年の動向
- Merck
- Ventria (InVitria)
- NCPC
- Oryzogen
- HiMedia
第9章 マーケティングチャネル・流通業者・顧客
- マーケティングチャネル
- 直接チャネル
- 間接チャネル
- 遺伝子組み換えヒト血清アルブミンの流通業者の一覧
- 遺伝子組み換えヒト血清アルブミンの顧客
- Thermo Fisher
- STEMCELL Technologies
- Merck Millipore
- Lonza
- Miltenyi Biotec
- GSK
- Merck
- Sanofi
- Changchun Institute of Biological
第10章 遺伝子組み換えヒト血清アルブミンの市場力学
- 遺伝子組み換えヒト血清アルブミン業界の動向
- 遺伝子組み換えヒト血清アルブミン市場の促進要因
- 遺伝子組み換えヒト血清アルブミン市場の課題
- 遺伝子組み換えヒト血清アルブミン市場の抑制要因
- ポーターのファイブフォース分析
第11章 結論
第12章 付録
List of Tables
- Table 1. Global Recombinant Human Serum Albumin Market Size Growth Rate by Type (2022-2028) & (Kg) & (US$ Million)
- Table 2. OsrHSA Major Manufacturers
- Table 3. ScrHSA Major Manufacturers
- Table 4. Global Recombinant Human Serum Albumin Consumption (Kg) Comparison by Application (2022-2028)
- Table 5. Global Recombinant Human Serum Albumin Market Size by Region in US$ Million: 2017 VS 2021 VS 2028
- Table 6. Recombinant Human Serum Albumin Raw Material and Suppliers
- Table 7. Key Suppliers of Raw Materials
- Table 8. Manufacturing Cost Structure Analysis of Recombinant Human Serum Albumin in 2021
- Table 9. Recombinant Human Serum Albumin Production Rank and Commercial Production Date of Key Manufacturers
- Table 10. Global Recombinant Human Serum Albumin Manufacturing Plants Distribution and Founded Date
- Table 11. Recombinant Human Serum Albumin Major Manufacturers Recombinant Human Serum Albumin Product Offered
- Table 12. Recent Development and Expansion Plans in Future
- Table 13. Global Recombinant Human Serum Albumin Manufacturers Covered in This report: Production, Revenue and Market Share in 2021
- Table 14. Global Recombinant Human Serum Albumin Production (Kg) of Major Manufacturers (2017-2022)
- Table 15. Recombinant Human Serum Albumin Production Market Share of Major Manufacturers (2017-2022)
- Table 16. Global Recombinant Human Serum Albumin Revenue (US$ Million) of Major Manufacturers (2017-2022)
- Table 17. Recombinant Human Serum Albumin Revenue Market Share of Major Manufacturers (2017-2022)
- Table 18. Global Recombinant Human Serum Albumin by Company Type (Tier 1, Tier 2, and Tier 3) & (based on the Revenue in Recombinant Human Serum Albumin as of 2021)
- Table 19. Global Recombinant Human Serum Albumin Average Price (US$/g) of Major Manufacturers (2017-2022)
- Table 20. Global Manufacturers Market Concentration Ratio (CR5 and HHI)
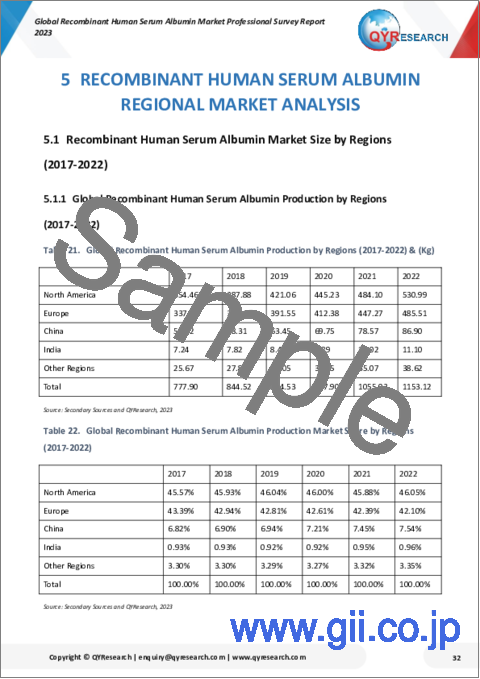
- Table 21. Global Recombinant Human Serum Albumin Production by Regions (2017-2022) & (Kg)
- Table 22. Global Recombinant Human Serum Albumin Production Market Share by Regions (2017-2022)
- Table 23. Global Recombinant Human Serum Albumin Revenue by Regions (2017-2022) & (US$ Million)
- Table 24. Global Recombinant Human Serum Albumin Revenue Market Share by Regions (2017-2022)
- Table 25. Global Recombinant Human Serum Albumin Production by Regions (2023-2028) & (Kg)
- Table 26. Global Recombinant Human Serum Albumin Production Market Share by Regions (2023-2028)
- Table 27. Global Recombinant Human Serum Albumin Revenue by Regions (2023-2028) & (US$ Million)
- Table 28. Global Recombinant Human Serum Albumin Revenue Market Share by Regions (2023-2028)
- Table 29. Global Recombinant Human Serum Albumin Consumption by Regions (2017-2022) & (Kg)
- Table 30. Global Recombinant Human Serum Albumin Consumption Market Share by Regions (2017-2022)
- Table 31. Global Recombinant Human Serum Albumin Consumption Market Share by Regions (2017-2022)
- Table 32. Global Recombinant Human Serum Albumin Consumption by Regions (2023-2028) & (Kg)
- Table 33. Global Recombinant Human Serum Albumin Consumption Market Share by Regions (2023-2028)
- Table 34. Key Recombinant Human Serum Albumin Players in North America
- Table 35. Key Recombinant Human Serum Albumin Players in Europe
- Table 36. Key Recombinant Human Serum Albumin Players in Japan
- Table 37. Key Recombinant Human Serum Albumin Players in China
- Table 38. Key Recombinant Human Serum Albumin Players in India
- Table 39. Key Recombinant Human Serum Albumin Players in Southeast Asia
- Table 40. Global Recombinant Human Serum Albumin Production by Type (2017-2022) & (Kg)
- Table 41. Global Recombinant Human Serum Albumin Production Share by Type (2017-2022)
- Table 42. Global Recombinant Human Serum Albumin Revenue by Type (2017-2022) & (US$ Million)
- Table 43. Global Recombinant Human Serum Albumin Revenue Share by Type (2017-2022)
- Table 44. Global Recombinant Human Serum Albumin Production by Type (2023-2028) & (Kg)
- Table 45. Global Recombinant Human Serum Albumin Production Share by Type (2023-2028)
- Table 46. Global Recombinant Human Serum Albumin Revenue by Type (2023-2028) & (US$ Million)
- Table 47. Global Recombinant Human Serum Albumin Revenue Share by Type (2023-2028)
- Table 48. Recombinant Human Serum Albumin Price by Type (2017-2022) & (US$/g)
- Table 49. Recombinant Human Serum Albumin Price by Type (2023-2028) & (US$/g)
- Table 50. Global Recombinant Human Serum Albumin Consumption (Kg) Comparison by Application (2022-2028)
- Table 51. Global Recombinant Human Serum Albumin Consumption by Application (2017-2022) & (Kg)
- Table 52. Global Recombinant Human Serum Albumin Consumption Share by Application (2017-2022)
- Table 53. Global Recombinant Human Serum Albumin Consumption by Application (2023-2028) & (Kg)
- Table 54. Global Recombinant Human Serum Albumin Consumption Share by Application (2023-2028)
- Table 55. Albumedix Corporation Information
- Table 56. Albumedix Recombinant Human Serum Albumin Consumption (Kg), Revenue (US$ Million), Price (US$/g) and Gross Margin (2017-2022)
- Table 57. Albumedix Recent Developments
- Table 58. Merck Corporation Information
- Table 59. Merck Recombinant Human Serum Albumin Consumption (Kg), Revenue (US$ Million), Price (US$/g) and Gross Margin (2017-2022)
- Table 60. Merck Recent Developments
- Table 61. Ventria (InVitria) Corporation Information
- Table 62. Ventria (InVitria) Recombinant Human Serum Albumin Product
- Table 63. Ventria (InVitria) Recombinant Human Serum Albumin Consumption (Kg), Revenue (US$ Million), Price (US$/g) and Gross Margin (2017-2022)
- Table 64. Ventria (InVitria) Recent Developments
- Table 65. NCPC Corporation Information
- Table 66. NCPC Recombinant Human Serum Albumin Consumption (Kg), Revenue (US$ Million), Price (US$/g) and Gross Margin (2017-2022)
- Table 67. Oryzogen Corporation Information
- Table 68. Oryzogen Recombinant Human Serum Albumin Consumption (Kg), Revenue (US$ Million), Price (US$/g) and Gross Margin (2017-2022)
- Table 69. HiMedia Corporation Information
- Table 70. HiMedia Recombinant Human Serum Albumin Product
- Table 71. HiMedia Recombinant Human Serum Albumin Consumption (Kg), Revenue (US$ Million), Price (US$/g) and Gross Margin (2017-2022)
- Table 72. Recombinant Human Serum Albumin Distributors List
- Table 73. Recombinant Human Serum Albumin Customers List
- Table 74. Thermo Fisher Company Profile
- Table 75. STEMCELL Technologies Company Profile
- Table 76. Merck Millipore Company Profile
- Table 77. Lonza Company Profile
- Table 78. Miltenyi Biotec Company Profile
- Table 79. GSK Company Profile
- Table 80. Merck Company Profile
- Table 81. Sanofi Company Profile
- Table 82. Changchun Institute of Biological Company Profile
- Table 83. Recombinant Human Serum Albumin Market Trends
- Table 84. Recombinant Human Serum Albumin Market Challenges
- Table 85. Recombinant Human Serum Albumin Market Restraints
- Table 86. Research Programs/Design for This Report
- Table 87. Key Data Information from Secondary Sources
- Table 88. Key Data Information from Primary Sources
- Table 89. QYR Business Unit and Senior & Team Lead Analysts
List of Figures
- Figure 1. Picture of Recombinant Human Serum Albumin
- Figure 2. Global Recombinant Human Serum Albumin Market Share by Type in 2022
- Figure 3. Global Recombinant Human Serum Albumin Market Share by Type in 2028
- Figure 4. OsrHSA Product Picture
- Figure 5. ScrHSA Product Picture
- Figure 6. Global Recombinant Human Serum Albumin Market Share by Application in 2022
- Figure 7. Global Recombinant Human Serum Albumin Market Share by Application in 2028
- Figure 8. Cell Culture Media
- Figure 9. Medical Supplements
- Figure 10. Global Recombinant Human Serum Albumin Market Share Scenario by Region in Percentage: 2022
- Figure 11. Global Recombinant Human Serum Albumin Market Share Scenario by Region in Percentage: 2028
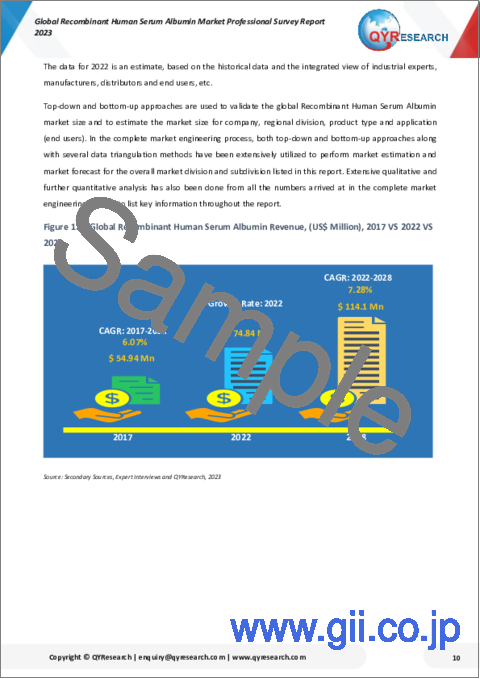
- Figure 12. Global Recombinant Human Serum Albumin Revenue, (US$ Million), 2017 VS 2022 VS 2028
- Figure 13. Global Recombinant Human Serum Albumin Revenue (US$ Million) & (2017-2028)
- Figure 14. Global Recombinant Human Serum Albumin Production (Kg) & (2017-2028)
- Figure 15. North America Recombinant Human Serum Albumin Revenue (US$ Million) Growth Rate (2017-2028)
- Figure 16. Europe Recombinant Human Serum Albumin Revenue (US$ Million) Growth Rate (2017-2028)
- Figure 17. China Recombinant Human Serum Albumin Revenue (US$ Million) Growth Rate (2017-2028)
- Figure 18. India Recombinant Human Serum Albumin Revenue (US$ Million) Growth Rate (2017-2028)
- Figure 19. Manufacturing Process Analysis of Recombinant Human Serum Albumin (OsrHSA)
- Figure 20. Industry Chain Structure of Recombinant Human Serum Albumin
- Figure 21. Recombinant Human Serum Albumin Production Share by Manufacturers in 2021
- Figure 22. Recombinant Human Serum Albumin Revenue Share by Manufacturers in 2021
- Figure 23. The Top 5 Players Market Share by Recombinant Human Serum Albumin Revenue in 2021
- Figure 24. Global Recombinant Human Serum Albumin Production Market Share by Regions in 2021
- Figure 25. Global Recombinant Human Serum Albumin Revenue Market Share by Regions (2017-2022)
- Figure 26. Global Recombinant Human Serum Albumin Consumption Market Share by Regions (2023-2028)
- Figure 27. North America Recombinant Human Serum Albumin Consumption (Kg)
- Figure 28. Europe Recombinant Human Serum Albumin Consumption (Kg)
- Figure 29. Japan Recombinant Human Serum Albumin Consumption (Kg)
- Figure 30. China Recombinant Human Serum Albumin Consumption (Kg)
- Figure 31. India Recombinant Human Serum Albumin Consumption (Kg)
- Figure 32. Southeast Asia Recombinant Human Serum Albumin Consumption (Kg)
- Figure 33. Global Recombinant Human Serum Albumin Production Market Share by Type (2017-2022)
- Figure 34. Global Recombinant Human Serum Albumin Revenue Market Share by Type (2017-2022)
- Figure 35. Global Consumption Recombinant Human Serum Albumin Market Share by Application in 2021
- Figure 36. Albumedix Recombinant Human Serum Albumin Product
- Figure 37. Merck Recombinant Human Serum Albumin Product
- Figure 38. NCPC Recombinant Human Serum Albumin Product
- Figure 39. Oryzogen Recombinant Human Serum Albumin Product
- Figure 40. Channels of Distribution
- Figure 41. Distributors Profiles
- Figure 42. Porter's Five Forces Analysis
- Figure 43. Bottom-up and Top-down Approaches for This Report
- Figure 44. Data Triangulation
- Figure 45. Key Executives Interviewed
The global Recombinant Human Serum Albumin market was valued at US$ 69.55 million in 2021, will reach US$ 114.1 million by the end of 2028, growing at a CAGR of 7.28% during 2022-2028.
This report focuses on Recombinant Human Serum Albumin volume and value at the global level, regional level and company level. From a global perspective, this report represents overall Recombinant Human Serum Albumin market size by analyzing historical data and future prospect.
Regionally, this report categorizes the production, apparent consumption, export and import of Recombinant Human Serum Albumin in North America, Europe, China, India, etc.
For the manufacturers covered, this report analyzes the Recombinant Human Serum Albumin manufacturing sites, capacity, production, ex-factory price, revenue and market share for each company.
By Company
- Albumedix
- Merck
- Ventria (InVitria)
- NCPC
- Oryzogen
- HiMedia
Segment by Type
- OsrHSA
- ScrHSA
Segment by Application
- Cell Culture Media
- Medical Supplements
- Other
By Region
- North America
- Europe
- China
- India
- Japan
- Southeast Asia
Table of Contents
1 Industry Overview of Recombinant Human Serum Albumin
- 1.1 Definition of Recombinant Human Serum Albumin
- 1.2 Recombinant Human Serum Albumin Segment by Type
- 1.2.1 Global Recombinant Human Serum Albumin Production Growth Rate Comparison by Type (2022-2028)
- 1.2.2 OsrHSA
- 1.2.3 ScrHSA
- 1.3 Recombinant Human Serum Albumin Segment by Application
- 1.3.1 Global Recombinant Human Serum Albumin Consumption Comparison by Application (2022-2028)
- 1.3.2 Cell Culture Media
- 1.3.3 Medical Supplements
- 1.4 Recombinant Human Serum Albumin Overall Market: 2017 VS 2021 VS 2028
- 1.4.1 Global Recombinant Human Serum Albumin Revenue (2017-2028)
- 1.4.2 Global Recombinant Human Serum Albumin Production (2017-2028)
- 1.4.3 North America Recombinant Human Serum Albumin Status and Prospect (2017-2028)
- 1.4.4 Europe Recombinant Human Serum Albumin Status and Prospect (2017-2028)
- 1.4.5 China Recombinant Human Serum Albumin Status and Prospect (2017-2028)
- 1.4.6 India Recombinant Human Serum Albumin Status and Prospect (2017-2028)
2 Manufacturing Cost Structure Analysis
- 2.1 Raw Material and Suppliers
- 2.2 Manufacturing Cost Structure Analysis of Recombinant Human Serum Albumin
- 2.3 Manufacturing Process Analysis of Recombinant Human Serum Albumin
- 2.4 Industry Chain Structure of Recombinant Human Serum Albumin
3 Development and Manufacturing Plants Analysis of Recombinant Human Serum Albumin
- 3.1 Top Manufacturers Headquarters, Rank by Recombinant Human Serum Albumin Production
- 3.2 Global Recombinant Human Serum Albumin Manufacturing Plants Distribution and Founded Date
- 3.3 Major Manufacturers Recombinant Human Serum Albumin Product Offered
- 3.4 Recent Development and Expansion Plans
4 Key Figures of Major Manufacturers
- 4.1 Global Top Manufacturers Recombinant Human Serum Albumin Production Analysis
- 4.2 Global Top Manufacturers Recombinant Human Serum Albumin Revenue Analysis
- 4.3 Global Recombinant Human Serum Albumin by Company Type (Tier 1, Tier 2, and Tier 3)
- 4.4 Global Top Manufacturers Recombinant Human Serum Albumin Price Analysis
- 4.5 Market Concentration Degree
5 Recombinant Human Serum Albumin Regional Market Analysis
- 5.1 Recombinant Human Serum Albumin Market Size by Regions (2017-2022)
- 5.1.1 Global Recombinant Human Serum Albumin Production by Regions (2017-2022)
- 5.1.2 Global Recombinant Human Serum Albumin Revenue by Regions (2017-2022)
- 5.2 Recombinant Human Serum Albumin Market Size by Regions (2023-2028)
- 5.2.1 Global Recombinant Human Serum Albumin Production by Regions (2023-2028)
- 5.2.2 Global Recombinant Human Serum Albumin Revenue by Regions (2023-2028)
- 5.3 Recombinant Human Serum Albumin Consumption by Regions
- 5.3.1 Recombinant Human Serum Albumin Consumption by Regions (2017-2022)
- 5.3.2 Recombinant Human Serum Albumin Consumption by Regions (2023-2028)
- 5.4 North America Recombinant Human Serum Albumin Market Analysis
- 5.4.1 Key Manufacturers in North America
- 5.4.2 North America Recombinant Human Serum Albumin Consumption
- 5.5 Europe Recombinant Human Serum Albumin Market Analysis
- 5.5.1 Key Manufacturers in Europe
- 5.5.2 Europe Recombinant Human Serum Albumin Consumption
- 5.6 Japan Recombinant Human Serum Albumin Market Analysis
- 5.6.1 Key Manufacturers in Japan
- 5.6.2 Japan Recombinant Human Serum Albumin Consumption
- 5.7 China Recombinant Human Serum Albumin Market Analysis
- 5.7.1 Key Manufacturers in China
- 5.7.2 China Recombinant Human Serum Albumin Consumption
- 5.8 India Recombinant Human Serum Albumin Market Analysis
- 5.8.1 Key Manufacturers in India
- 5.8.2 India Recombinant Human Serum Albumin Consumption
- 5.9 Southeast Asia Recombinant Human Serum Albumin Market Analysis
- 5.9.1 Key Manufacturers in Southeast Asia
- 5.9.2 Southeast Asia Recombinant Human Serum Albumin Consumption
6 Recombinant Human Serum Albumin Segment Market Analysis (by Type)
- 6.1 Global Recombinant Human Serum Albumin Market Size by Type (2017-2022)
- 6.1.1 Global Recombinant Human Serum Albumin Production by Type (2017-2022)
- 6.1.2 Global Recombinant Human Serum Albumin Revenue by Type (2017-2022)
- 6.2 Global Recombinant Human Serum Albumin Market Size by Type (2023-2028)
- 6.2.1 Global Recombinant Human Serum Albumin Production by Type (2023-2028)
- 6.2.2 Global Recombinant Human Serum Albumin Revenue by Type (2023-2028)
- 6.3 Recombinant Human Serum Albumin Price by Type
7 Recombinant Human Serum Albumin Segment Market Analysis (by Application)
- 7.1 Overview
- 7.2 Global Recombinant Human Serum Albumin Consumption Market Share by Application (2017-2022)
- 7.3 Global Recombinant Human Serum Albumin Consumption Market Share by Application (2023-2028)
8 Key Company Profiles
- 8.1 Albumedix
- 8.1.1 Albumedix Corporation Information
- 8.1.2 Albumedix Recombinant Human Serum Albumin Products Offered
- 8.1.3 Albumedix Recombinant Human Serum Albumin Consumption, Revenue and Gross Margin (2017-2022)
- 8.1.4 Albumedix Recent Developments
- 8.2 Merck
- 8.2.1 Merck Corporation Information
- 8.2.2 Merck Recombinant Human Serum Albumin Products Offered
- 8.2.3 Merck Recombinant Human Serum Albumin Consumption, Revenue and Gross Margin (2017-2022)
- 8.2.4 Merck Recent Developments
- 8.3 Ventria (InVitria)
- 8.3.1 Ventria (InVitria) Corporation Information
- 8.3.2 Ventria (InVitria) Recombinant Human Serum Albumin Products Offered
- 8.3.3 Ventria (InVitria) Recombinant Human Serum Albumin Consumption, Revenue and Gross Margin (2017-2022)
- 8.3.4 Ventria (InVitria) Recent Developments
- 8.4 NCPC
- 8.4.1 NCPC Corporation Information
- 8.4.2 NCPC Recombinant Human Serum Albumin Products Offered
- 8.4.3 NCPC Recombinant Human Serum Albumin Consumption, Revenue and Gross Margin (2017-2022)
- 8.5 Oryzogen
- 8.5.1 Oryzogen Corporation Information
- 8.5.2 Oryzogen Recombinant Human Serum Albumin Products Offered
- 8.5.3 Oryzogen Recombinant Human Serum Albumin Consumption, Revenue and Gross Margin (2017-2022)
- 8.6 HiMedia
- 8.6.1 HiMedia Corporation Information
- 8.6.2 HiMedia Recombinant Human Serum Albumin Products Offered
- 8.6.3 HiMedia Recombinant Human Serum Albumin Consumption, Revenue and Gross Margin (2017-2022)
9 Marketing Channel, Distributors and Customers
- 9.1 Marketing Channel
- 9.1.1 Direct Channels
- 9.1.2 Indirect Channels
- 9.2 Recombinant Human Serum Albumin Distributors List
- 9.3 Recombinant Human Serum Albumin Customers
- 9.3.1 Thermo Fisher
- 9.3.2 STEMCELL Technologies
- 9.3.3 Merck Millipore
- 9.3.4 Lonza
- 9.3.5 Miltenyi Biotec
- 9.3.6 GSK
- 9.3.7 Merck
- 9.3.8 Sanofi
- 9.3.9 Changchun Institute of Biological
10 Recombinant Human Serum Albumin Market Dynamics
- 10.1 Recombinant Human Serum Albumin Industry Trends
- 10.2 Recombinant Human Serum Albumin Market Drivers
- 10.3 Recombinant Human Serum Albumin Market Challenges
- 10.4 Recombinant Human Serum Albumin Market Restraints
- 10.5 Porter's Five Forces Analysis
11 Conclusion
12 Appendix
- 12.1 Methodology/Research Approach
- 12.1.1 Research Programs/Design
- 12.1.2 Market Size Estimation
- 12.1.3 Market Breakdown and Data Triangulation
- 12.2 Data Source
- 12.2.1 Secondary Sources
- 12.2.2 Primary Sources
- 12.3 Author Details
- 12.4 Disclaimer