|
|
市場調査レポート
商品コード
1081995
スペクトラムアナライザの世界市場(2022年)Global Spectrum Analyzer Market Research Report 2022 |
||||||
|
|
|||||||
|
● お客様のご希望に応じて、既存データの加工や未掲載情報(例:国別セグメント)の追加などの対応が可能です。 詳細はお問い合わせください。 |
|||||||


| スペクトラムアナライザの世界市場(2022年) |
|
出版日: 2022年06月15日
発行: QYResearch
ページ情報: 英文 125 Pages
納期: 2~3営業日
|
- 全表示
- 概要
- 図表
- 目次
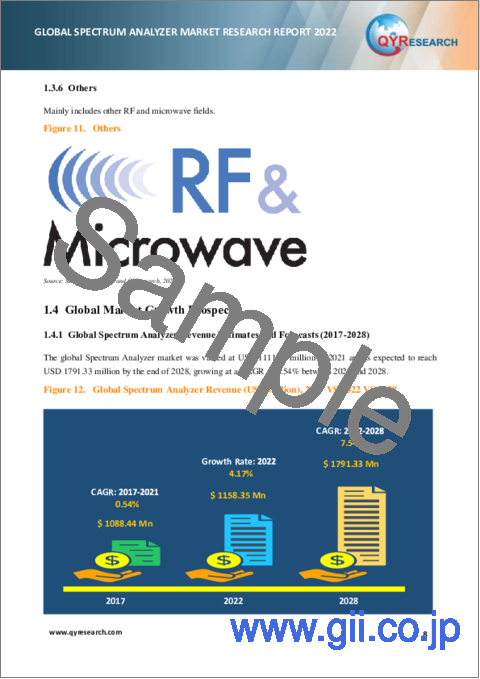
世界のスペクトラムアナライザの市場規模は、2022年の11億5,835万米ドルから、予測期間(2022年~2028年)に7.54%のCAGRで推移し、2028年までに17億9,133万米ドルに達すると予測されています。
世界の主要メーカーには、Keysight Technologies、Rohde & Schwarz GmbH & Co., Kg.、Fortive Corporation、Anritsu Corporation、Advantest Corporation、Cobham PLC、Giga-Tronics Incorporated、Yokogawa Electric Corporation、National Instruments Corporationなどが挙げられ、2021年には、主要企業3社で33%の収益シェアを占めています。
当レポートでは、世界のスペクトラムアナライザ市場について調査し、市場規模や予測、セグメント・地域別の市場分析、市場力学、競合情勢、主要企業のプロファイルなどの情報を提供しています。
目次
第1章 スペクトラムアナライザ市場概要
- スペクトラムアナライザの製品概要と範囲
- タイプ別:セグメント
- 世界市場規模の成長率分析(2017-2028)
- ポータブル
- デスクトップ
- 埋め込み
- 用途別:セグメント
- 世界市場規模の成長率分析(2017-2028)
- 通信機器
- 自動車
- 家電
- 航空宇宙・防衛
- その他
- 世界市場の成長見通し
- 世界の収益推計・予測(2017-2028)
- 世界の生産推計・予測(2017-2028)
- 地域別:世界市場規模
- 地域別:世界市場規模推計・予測(2017 VS 2022 VS 2028)
第2章 メーカー別:市場競争
- メーカー別:世界の生産(2017-2022)
- メーカー別:世界の収益市場シェア(2017-2022)
- 企業タイプ別:市場シェア(TIER 1、TIER 2、TIER 3)
- メーカー別:世界の平均価格(2017-2022)
- 市場の競合情勢と動向
第3章 地域別の生産
- 地域別:世界の生産(2017-2022)
- 地域別:世界の生産市場シェア(2017-2022)
- 世界の生産、収益、価格、粗利益(2017-2022)
第4章 地域別:スペクトラムアナライザの消費
- 地域別:世界の消費
- 北米
- 国別:消費
- 米国
- カナダ
- メキシコ
- 欧州
- 国別:消費
- ドイツ
- フランス
- 英国
- イタリア
- ロシア
- アジア太平洋
- 地域別:消費
- 中国
- 日本
- 韓国
- 東南アジア
- インド
- 南米
- 国別:消費
- ブラジル
第5章 タイプ別:セグメント
- タイプ別:世界の生産市場シェア(2017-2022)
- タイプ別:世界の収益市場シェア(2017-2022)
- タイプ別:世界の価格(2017-2022)
第6章 用途別:セグメント
- 用途別:世界の生産市場シェア(2017-2022)
- 用途別:世界の収益市場シェア(2017-2022)
- 用途別:世界の価格(2017-2022)
第7章 主要企業のプロファイル
- KEYSIGHT TECHNOLOGIES
- YOKOGAWA ELECTRIC CORPORATION
- ANRITSU CORPORATION
- ROHDE & SCHWARZ GMBH & CO., KG
- II-VI INCORPORATED
- VIAVI SOLUTIONS
- ADVANTEST CORPORATION
- TELEDYNE LECROY, INC.
- NATIONAL INSTRUMENTS CORPORATION
- B&K PRECISION CORPORATION
- STANFORD RESEARCH SYSTEMS, INC
- EXFO
- AVCOM OF VIRGINIA. INC
- OPTOPLEX
- LP TECHNOLOGIES INC
第8章 スペクトラムアナライザの製造コスト分析
- 主要原材料分析
- 製造コスト構造比
- 産業チェーン分析
第9章 マーケティングチャネル、ディストリビューター、顧客
- マーケティングチャネル
- ディストリビュータリスト
- 顧客
第10章 スペクトラムアナライザの市場力学
- 業界の動向
- 市場の促進要因
- 市場の課題
- 市場の抑制要因
第11章 生産と供給予測
- 地域別:世界の生産予測(2023-2028)
- 地域別:世界の生産市場シェア(2023-2028)
第12章 消費と需要予測
- 世界の需要予測分析
- 北米:国別消費予測
- 欧州:国別消費予測
- アジア太平洋:地域別消費予測
- 南米:国別消費予測
第13章 タイプ・用途別:予測
- タイプ別:世界の生産、収益、価格予測(2023-2028)
- 用途別:世界の生産、収益、価格予測(2023-2028)
第14章 調査結果と結論
第15章 調査手法と情報源
LIST OF TABLES
- Table 1. Global Spectrum Analyzer Market Size by Type (US$ Million) & (2017-2028)
- Table 2. Global Spectrum Analyzer Market Size by Application (US$ Million) & (2017- 2028)
- Table 3. Spectrum Analyzer Market Size Comparison by Region: 2017 VS 2022 VS 2028
- Table 4. Global Spectrum Analyzer Production by Manufacturers (2017-2022) & (Units)
- Table 5. Global Spectrum Analyzer Production Market Share by Manufacturers (2017-2022)
- Table 6. Global Spectrum Analyzer Revenue by Manufacturers (2017-2022) & (US$ Million)
- Table 7. Global Spectrum Analyzer Revenue Share by Manufacturers (2017-2022)
- Table 8. Company Type (Tier 1, Tier 2, and Tier 3) & (based on the Revenue in Spectrum Analyzer as of 2021)
- Table 9. Global Market Spectrum Analyzer Average Price (K USD/ Unit) of Key Manufacturers (2017-2022)
- Table 10. Global Spectrum Analyzer Manufacturers Market Concentration Ratio (CR5 and HHI)
- Table 11. Mergers & Acquisitions, Expansion Plans
- Table 12. Global Spectrum Analyzer Production (Units) by Region (2017-2022)
- Table 13. Global Spectrum Analyzer Output Value (US$ Million) by Region (2017-2022)
- Table 14. Global Spectrum Analyzer Production (Units), Revenue (US$ Million), Price(K USD/Unit) and Gross Margin (2017-2022)
- Table 15. Global Spectrum Analyzer Consumption by Region (2017-2022) & (Units)
- Table 16. Global Spectrum Analyzer Consumption Market Share by Region (2017-2022)
- Table 17. North America Spectrum Analyzer Consumption by Country (2017-2022) & (Units)
- Table 18. Europe Spectrum Analyzer Consumption by Country (2017-2022) & (Units)
- Table 19. Asia Pacific Spectrum Analyzer Consumption by Region (2017-2022) & (Units)
- Table 20. South America Spectrum Analyzer Consumption by Country (2017-2022) & (Units)
- Table 21. Global Spectrum Analyzer Production (Units) by Type (2017-2022)
- Table 22. Global Spectrum Analyzer Production Market Share by Type (2017-2022)
- Table 23. Global Spectrum Analyzer Revenue (US$ Million) by Type (2017-2022)
- Table 24. Global Spectrum Analyzer Revenue Share by Type (2017-2022)
- Table 25. Global Spectrum Analyzer Price (K USD/Unit) by Type (2017-2022)
- Table 26. Global Spectrum Analyzer Production (Units) by Application (2017-2022)
- Table 27. Global Spectrum Analyzer Production Market Share by Application (2017-2022)
- Table 28. Global Spectrum Analyzer Revenue (US$ Million) by Application (2017-2022)
- Table 29. Global Spectrum Analyzer Revenue Share by Application (2017-2022)
- Table 30. Global Spectrum Analyzer Price (K USD/Unit) by Application (2017-2022)
- Table 31. Keysight Technologies Spectrum Analyzer Corporation Information
- Table 32. Keysight Technologies Spectrum Analyzer Specification and Application
- Table 33. Keysight Technologies Spectrum Analyzer Production (Units), Revenue (US$ Million), Price(K USD/Unit) and Gross Margin (2017-2022)
- Table 34. Yokogawa Electric Corporation Spectrum Analyzer Corporation Information
- Table 35. Yokogawa Electric Corporation Spectrum Analyzer Specification and Application
- Table 36. Yokogawa Electric Corporation Spectrum Analyzer Production (Units), Revenue (US$ Million), Price(K USD/Unit) and Gross Margin (2017-2022)
- Table 37. Yokogawa Electric Corporation Recent Developments/Updates
- Table 38. Anritsu Corporation Spectrum Analyzer Corporation Information
- Table 39. Anritsu Corporation Spectrum Analyzer Specification and Application
- Table 40. Anritsu Corporation Spectrum Analyzer Production (Units), Revenue (US$ Million), Price(K USD/Unit) and Gross Margin (2017-2022)
- Table 41. Anritsu Corporation Recent Developments/Updates
- Table 42. Rohde & Schwarz GmbH & Co., Kg Spectrum Analyzer Corporation Information
- Table 43. Rohde & Schwarz GmbH & Co., Kg Spectrum Analyzer Specification and Application
- Table 44. Rohde & Schwarz GmbH & Co., Kg Spectrum Analyzer Production (Units), Revenue (US$ Million), Price(K USD/Unit) and Gross Margin (2017-2022)
- Table 45. Rohde & Schwarz GmbH & Co., Kg Recent Developments/Updates
- Table 46. II-VI Incorporated Spectrum Analyzer Corporation Information
- Table 47. II-VI Incorporated Spectrum Analyzer Specification and Application
- Table 48. II-VI Incorporated Spectrum Analyzer Production (Units), Revenue (US$ Million), Price(K USD/Unit) and Gross Margin (2017-2022)
- Table 49. II-VI Incorporated Recent Developments/Updates
- Table 50. Viavi Solutions Spectrum Analyzer Corporation Information
- Table 51. Viavi Solutions Spectrum Analyzer Specification and Application
- Table 52. Viavi Solutions Spectrum Analyzer Production (Units), Revenue (US$ Million), Price(K USD/Unit) and Gross Margin (2017-2022)
- Table 53. Viavi Solutions Recent Developments/Updates
- Table 54. Advantest Corporation Spectrum Analyzer Corporation Information
- Table 55. Advantest Corporation Spectrum Analyzer Specification and Application
- Table 56. Advantest Corporation Spectrum Analyzer Production (Units), Revenue (US$ Million), Price(K USD/Unit) and Gross Margin (2017-2022)
- Table 57. Advantest Corporation Recent Developments/Updates
- Table 58. Teledyne Lecroy, Inc. Spectrum Analyzer Corporation Information
- Table 59. Teledyne Lecroy, Inc. Spectrum Analyzer Specification and Application
- Table 60. Teledyne Lecroy, Inc. Spectrum Analyzer Production (Units), Revenue (US$ Million), Price(K USD/Unit) and Gross Margin (2017-2022)
- Table 61. Teledyne Lecroy, Inc. Recent Developments/Updates
- Table 62. National Instruments Corporation Spectrum Analyzer Corporation Information
- Table 63. National Instruments Corporation Spectrum Analyzer Specification and Application
- Table 64. National Instruments Corporation Spectrum Analyzer Production (Units), Revenue (US$ Million), Price(K USD/Unit) and Gross Margin (2017-2022)
- Table 65. National Instruments Corporation Recent Developments/Updates
- Table 66. B&K Precision Corporation Spectrum Analyzer Corporation Information
- Table 67. B&K Precision Corporation Spectrum Analyzer Specification and Application
- Table 68. B&K Precision Corporation Spectrum Analyzer Production (Units), Revenue (US$ Million), Price(K USD/Unit) and Gross Margin (2017-2022)
- Table 69. B&K Precision Corporation Recent Developments/Updates
- Table 70. Stanford Research Systems, Inc Spectrum Analyzer Corporation Information
- Table 71. Stanford Research Systems, Inc Spectrum Analyzer Specification and Application
- Table 72. Stanford Research Systems, Inc Spectrum Analyzer Production (Units), Revenue (US$ Million), Price(K USD/Unit) and Gross Margin (2017-2022)
- Table 73. Exfo Spectrum Analyzer Corporation Information
- Table 74. Exfo Spectrum Analyzer Specification and Application
- Table 75. Exfo Spectrum Analyzer Production (Units), Revenue (US$ Million), Price(K USD/Unit) and Gross Margin (2017-2022)
- Table 76. Exfo Recent Developments/Updates
- Table 77. Avcom of Virginia. Inc Spectrum Analyzer Corporation Information
- Table 78. Avcom of Virginia. Inc Spectrum Analyzer Specification and Application
- Table 79. Avcom of Virginia. Inc Spectrum Analyzer Production (Units), Revenue (US$ Million), Price(K USD/Unit) and Gross Margin (2017-2022)
- Table 80. Optoplex Spectrum Analyzer Corporation Information
- Table 81. Optoplex Spectrum Analyzer Specification and Application
- Table 82. Optoplex Spectrum Analyzer Production (Units), Revenue (US$ Million), Price(K USD/Unit) and Gross Margin (2017-2022)
- Table 83. Optoplex Recent Developments/Updates
- Table 84. LP Technologies Inc Spectrum Analyzer Corporation Information
- Table 85. LP Technologies Inc Spectrum Analyzer Specification and Application
- Table 86. LP Technologies Inc Spectrum Analyzer Production (Units), Revenue (US$ Million), Price(K USD/Unit) and Gross Margin (2017-2022)
- Table 87. Production Base and Market Concentration Rate of Raw Material
- Table 88. Key Suppliers of Raw Materials
- Table 89. Spectrum Analyzer Distributors List
- Table 90. Spectrum Analyzer Customers List
- Table 91. Spectrum Analyzer Market Trends
- Table 92. Spectrum Analyzer Market Drivers
- Table 93. Spectrum Analyzer Market Challenges
- Table 94. Spectrum Analyzer Market Restraints
- Table 95. Global Spectrum Analyzer Production (Units) Forecast by Region (2023-2028)
- Table 96. Global Spectrum Analyzer Output Value (US$ Million) by Region (2023-2028)
- Table 97. North America Spectrum Analyzer Consumption Forecast by Country (2023-2028) & (Units)
- Table 98. Europe Spectrum Analyzer Consumption Forecast by Country (2023-2028) & (Units)
- Table 99. Asia Pacific Spectrum Analyzer Consumption Forecast by Region (2023-2028) & (Units)
- Table 100. South America Spectrum Analyzer Consumption Forecast by Country (2023-2028) & (Units)
- Table 101. Global Spectrum Analyzer Production Forecast by Type (2023-2028) & (Units)
- Table 102. Global Spectrum Analyzer Revenue Forecast by Type (2023-2028) & (US$ Million)
- Table 103. Global Spectrum Analyzer Price Forecast by Type (2023-2028) & (K USD/Unit)
- Table 104. Global Spectrum Analyzer Production Forecast by Application (2023-2028) & (Units)
- Table 105. Global Spectrum Analyzer Revenue Forecast by Application (2023-2028) & (US$ Million)
- Table 106. Global Spectrum Analyzer Price Forecast by Application (2023-2028) & (K USD/Unit)
- Table 107. Research Programs/Design for This Report
- Table 108. Key Data Information from Secondary Sources
- Table 109. Key Data Information from Primary Sources
List of Figures
- Figure 1. Product Picture of Spectrum Analyzer
- Figure 2. Global Spectrum Analyzer Market Share by Type: 2022 VS 2028
- Figure 3. Portable Spectrum Analyzers Product Picture
- Figure 4. Desktop Spectrum Analyzer Product Picture
- Figure 5. Embedded Spectrum Analyzer Product Picture
- Figure 6. Global Spectrum Analyzer Market Share by Application: 2022 VS 2028
- Figure 7. Communication Equipments
- Figure 8. Automotive
- Figure 9. Consumer Electronics
- Figure 10. Aerospace & Defense
- Figure 11. Others
- Figure 12. Global Spectrum Analyzer Revenue (US$ Million), 2017 VS 2022 VS 2028
- Figure 13. Global Spectrum Analyzer Revenue (US$ Million) (2017-2028)
- Figure 14. Global Spectrum Analyzer Production (Units) & (2017-2028)
- Figure 15. Spectrum Analyzer Market Size Comparison by Region: 2017 VS 2022 VS 2028
- Figure 16. Spectrum Analyzer Production Share by Manufacturers in 2021
- Figure 17. Global Spectrum Analyzer Revenue Share by Manufacturers in 2021
- Figure 18. Spectrum Analyzer Market Share by Company Type (Tier 1, Tier 2, and Tier 3): 2021
- Figure 19. Global Market Spectrum Analyzer Average Price (K USD/ Unit) of Key Manufacturers in 2021
- Figure 20. The Global 5 and 10 Largest Players: Market Share by Spectrum Analyzer Revenue in 2021
- Figure 21. Global Spectrum Analyzer Production Market Share by Region (2017-2022)
- Figure 22. Global Spectrum Analyzer Output Value Market Share by Region (2017-2022)
- Figure 23. Global Spectrum Analyzer Consumption Market Share by Region (2017-2022)
- Figure 24. North America Spectrum Analyzer Consumption and Growth Rate (2017-2022) & (Units)
- Figure 25. North America Spectrum Analyzer Consumption Market Share by Country in 2021
- Figure 26. U.S. Spectrum Analyzer Consumption and Growth Rate (2017-2022) & (Units)
- Figure 27. Canada Spectrum Analyzer Consumption (Units) and Growth Rate (2017-2022)
- Figure 28. Mexico Spectrum Analyzer Consumption (Units) and Growth Rate (2017-2022)
- Figure 29. Europe Spectrum Analyzer Consumption and Growth Rate (2017-2022) & (Units)
- Figure 30. Europe Spectrum Analyzer Consumption Market Share by Country in 2021
- Figure 31. Germany Spectrum Analyzer Consumption and Growth Rate (2017-2022) & (Units)
- Figure 32. France Spectrum Analyzer Consumption and Growth Rate (2017-2022) & (Units)
- Figure 33. U.K. Spectrum Analyzer Consumption and Growth Rate (2017-2022) & (Units)
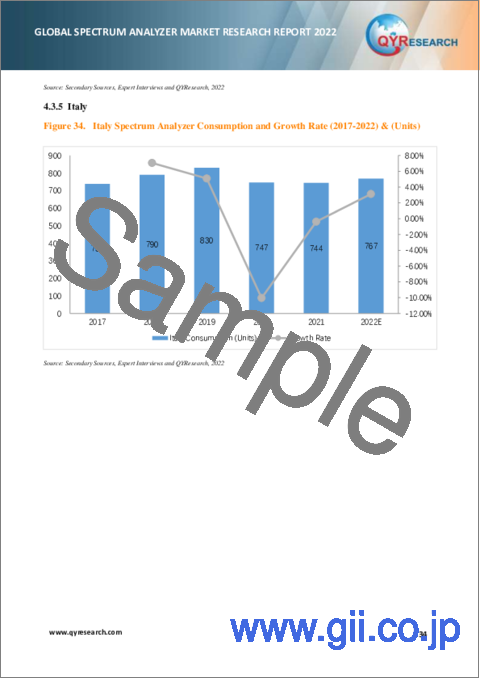
- Figure 34. Italy Spectrum Analyzer Consumption and Growth Rate (2017-2022) & (Units)
- Figure 35. Russia Spectrum Analyzer Consumption and Growth Rate (2017-2022) & (Units)
- Figure 36. Asia Pacific Spectrum Analyzer Consumption and Growth Rate (Units)
- Figure 37. Asia Pacific Spectrum Analyzer Consumption Market Share by Region in 2021
- Figure 38. China Spectrum Analyzer Consumption and Growth Rate (2017-2022) & (Units)
- Figure 39. Japan Spectrum Analyzer Consumption and Growth Rate (2017-2022) & (Units)
- Figure 40. South Korea Spectrum Analyzer Consumption and Growth Rate (2017-2022) & (Units)
- Figure 41. Southeast Asia Spectrum Analyzer Consumption and Growth Rate (2017-2022) & (Units)
- Figure 42. India Spectrum Analyzer Consumption and Growth Rate (2017-2022) & (Units)
- Figure 43. South America Spectrum Analyzer Consumption and Growth Rate (Units)
- Figure 44. South America Spectrum Analyzer Consumption Market Share by Country in 2021
- Figure 45. Brazil Spectrum Analyzer Consumption and Growth Rate (2017-2022) & (Units)
- Figure 46. Revenue Share of Spectrum Analyzer by Type (2017-2022)
- Figure 47. Revenue Market Share of Spectrum Analyzer by Type in 2021
- Figure 48. Revenue Share of Spectrum Analyzer by Application (2017-2022)
- Figure 49. Revenue Market Share of Spectrum Analyzer by Application in 2021
- Figure 50. Spectrum Analyzer Industrial Chain Analysis
- Figure 51. Channels of Distribution
- Figure 52. Distributors Profiles
- Figure 53. Global Spectrum Analyzer Production Market Share Forecast by Region (2023-2028)
- Figure 54. Global Spectrum Analyzer Output Value Market Share by Region (2023-2028)
- Figure 55. Global Forecasted Demand Analysis of Spectrum Analyzer (2017-2028) & (Units)
- Figure 56. Global Spectrum Analyzer Production Market Share Forecast by Type (2023-2028)
- Figure 57. Global Spectrum Analyzer Revenue Market Share Forecast by Type (2023-2028)
- Figure 58. Global Spectrum Analyzer Production Market Share Forecast by Application (2023-2028)
- Figure 59. Global Spectrum Analyzer Revenue Market Share Forecast by Application (2023-2028)
- Figure 60. Bottom-up and Top-down Approaches for This Report
- Figure 61. Data Triangulation
Market Analysis and Insights:
Due to the COVID-19 pandemic, the global Spectrum Analyzer market size is estimated to be worth US$ 1158.35 million in 2022 and is forecast to a readjusted size of US$ 1791.33 million by 2028 with a CAGR of 7.54% during the forecast period 2022-2028. Fully considering the economic change by this health crisis, Portable Spectrum Analyzers accounting for 15.10% of the Spectrum Analyzer global market in 2021, is projected to value US$ 252.90 million by 2028, growing at a revised 6.40% CAGR from 2022 to 2028.
The global major manufacturers of Spectrum Analyzer include Keysight Technologies, Rohde & Schwarz GmbH & Co., Kg., Fortive Corporation, Anritsu Corporation, Advantest Corporation, Cobham PLC, Giga-Tronics Incorporated, Yokogawa Electric Corporation, and National Instruments Corporation, etc. In terms of revenue, the global three largest players hold a 33% market share of Spectrum Analyzer in 2021.
Drivers and Restrains:
The research report has incorporated the analysis of different factors that augment the market's growth. It constitutes trends, restraints, and drivers that transform the market in either a positive or negative manner. This section also provides the scope of different segments and applications that can potentially influence the market in the future. The detailed information is based on current trends and historic milestones. This section also provides an analysis of the volume of production about the global market and about each type from 2017 to 2028. This section mentions the volume of production by region from 2017 to 2028. Pricing analysis is included in the report according to each type from the year 2017 to 2028, manufacturer from 2017 to 2022, region from 2017 to 2022, and global price from 2017 to 2028.
A thorough evaluation of the restrains included in the report portrays the contrast to drivers and gives room for strategic planning. Factors that overshadow the market growth are pivotal as they can be understood to devise different bends for getting hold of the lucrative opportunities that are present in the ever-growing market. Additionally, insights into market expert's opinions have been taken to understand the market better.
Segment Analysis:
The research report includes specific segments by region (country), by manufacturers, by Type and by Application. Each type provides information about the production during the forecast period of 2017 to 2028. by Application segment also provides consumption during the forecast period of 2017 to 2028. Understanding the segments helps in identifying the importance of different factors that aid the market growth.
By Company
- Keysight Technologies
- Rohde & Schwarz GmbH & Co., Kg.
- Fortive Corporation
- Anritsu Corporation
- Advantest Corporation
- Cobham PLC
- Giga-Tronics Incorporated
- Yokogawa Electric Corporation
- National Instruments Corporation
- LP Technologies Inc
- Teledyne Lecroy, Inc.
- Avcom of Virginia. Inc
- B&K Precision Corporation
- Stanford Research Systems, Inc
Segment by Type
- Portable Spectrum Analyzers
- Desktop Spectrum Analyzer
- Embedded Spectrum Analyzer
Segment by Application
- Communication Equipments
- Automotive
- Consumer Electronics
- Aerospace & Defense
- Others
Production by Region
- North America
- Europe
- Japan
- China
- Other
Consumption by Region
- North America
- U.S.
- Canada
- Mexico
- Asia-Pacific
- China
- Japan
- South Korea
- Southeast Asia
- India
- Europe
- Germany
- France
- U.K.
- Italy
- Russia
- Rest of Europe
- South America
- Brazil
- Rest of South America
TABLE OF CONTENTS
1 SPECTRUM ANALYZER MARKET OVERVIEW
- 1.1 PRODUCT OVERVIEW AND SCOPE OF SPECTRUM ANALYZER
- 1.2 SPECTRUM ANALYZER SEGMENT BY TYPE
- 1.2.1 GLOBAL SPECTRUM ANALYZER MARKET SIZE GROWTH RATE ANALYSIS BY TYPE: 2017-2028
- 1.2.2 PORTABLE SPECTRUM ANALYZERS
- 1.2.3 DESKTOP SPECTRUM ANALYZER
- 1.2.4 EMBEDDED SPECTRUM ANALYZER
- 1.3 SPECTRUM ANALYZER SEGMENT BY APPLICATION
- 1.3.1 GLOBAL SPECTRUM ANALYZER MARKET SIZE GROWTH RATE ANALYSIS BY APPLICATION: 2017- 2028
- 1.3.2 COMMUNICATION EQUIPMENTS
- 1.3.3 AUTOMOTIVE
- 1.3.4 CONSUMER ELECTRONICS
- 1.3.5 AEROSPACE & DEFENSE
- 1.3.6 OTHERS
- 1.4 GLOBAL MARKET GROWTH PROSPECTS
- 1.4.1 GLOBAL SPECTRUM ANALYZER REVENUE ESTIMATES AND FORECASTS (2017-2028)
- 1.4.2 GLOBAL SPECTRUM ANALYZER PRODUCTION ESTIMATES AND FORECASTS (2017-2028)
- 1.5 GLOBAL MARKET SIZE BY REGION
- 1.5.1 GLOBAL SPECTRUM ANALYZER MARKET SIZE ESTIMATES AND FORECASTS BY REGION: 2017 VS 2022 VS 2028
2 MARKET COMPETITION BY MANUFACTURERS
- 2.1 GLOBAL SPECTRUM ANALYZER PRODUCTION BY MANUFACTURERS (2017-2022)
- 2.2 GLOBAL SPECTRUM ANALYZER REVENUE MARKET SHARE BY MANUFACTURERS (2017-2022)
- 2.3 SPECTRUM ANALYZER MARKET SHARE BY COMPANY TYPE (TIER 1, TIER 2, AND TIER 3)
- 2.4 GLOBAL SPECTRUM ANALYZER AVERAGE PRICE BY MANUFACTURERS (2017-2022)
- 2.5 SPECTRUM ANALYZER MARKET COMPETITIVE SITUATION AND TRENDS
- 2.5.1 SPECTRUM ANALYZER MARKET CONCENTRATION RATE
- 2.5.2 GLOBAL 5 AND 10 LARGEST SPECTRUM ANALYZER PLAYERS MARKET SHARE BY REVENUE
- 2.5.3 MERGERS & ACQUISITIONS, EXPANSION
3 PRODUCTION BY REGION
- 3.1 GLOBAL PRODUCTION OF SPECTRUM ANALYZER BY REGION (2017-2022)
- 3.2 GLOBAL SPECTRUM ANALYZER OUTPUT VALUE MARKET SHARE BY REGION (2017-2022)
- 3.3 GLOBAL SPECTRUM ANALYZER PRODUCTION, REVENUE, PRICE AND GROSS MARGIN (2017-2022)
4 SPECTRUM ANALYZER CONSUMPTION BY REGION
- 4.1 GLOBAL SPECTRUM ANALYZER CONSUMPTION BY REGION
- 4.1.1 GLOBAL SPECTRUM ANALYZER CONSUMPTION BY REGION
- 4.1.2 GLOBAL SPECTRUM ANALYZER CONSUMPTION MARKET SHARE BY REGION
- 4.2 NORTH AMERICA
- 4.2.1 NORTH AMERICA SPECTRUM ANALYZER CONSUMPTION BY COUNTRY
- 4.2.2 U.S.
- 4.2.3 CANADA
- 4.2.4 MEXICO
- 4.3 EUROPE
- 4.3.1 EUROPE SPECTRUM ANALYZER CONSUMPTION BY COUNTRY
- 4.3.2 GERMANY
- 4.3.3 FRANCE
- 4.3.4 U.K.
- 4.3.5 ITALY
- 4.3.6 RUSSIA
- 4.4 ASIA PACIFIC
- 4.4.1 ASIA PACIFIC SPECTRUM ANALYZER CONSUMPTION BY REGION
- 4.4.2 CHINA
- 4.4.3 JAPAN
- 4.4.4 SOUTH KOREA
- 4.4.5 SOUTHEAST ASIA
- 4.4.6 INDIA
- 4.5 SOUTH AMERICA
- 4.5.1 SOUTH AMERICA SPECTRUM ANALYZER CONSUMPTION BY COUNTRY
- 4.5.2 BRAZIL
5 SEGMENT BY TYPE
- 5.1 GLOBAL SPECTRUM ANALYZER PRODUCTION MARKET SHARE BY TYPE (2017-2022)
- 5.2 GLOBAL SPECTRUM ANALYZER REVENUE MARKET SHARE BY TYPE (2017-2022)
- 5.3 GLOBAL SPECTRUM ANALYZER PRICE BY TYPE (2017-2022)
6 SEGMENT BY APPLICATION
- 6.1 GLOBAL SPECTRUM ANALYZER PRODUCTION MARKET SHARE BY APPLICATION (2017-2022)
- 6.2 GLOBAL SPECTRUM ANALYZER REVENUE MARKET SHARE BY APPLICATION (2017-2022)
- 6.3 GLOBAL SPECTRUM ANALYZER PRICE BY APPLICATION (2017-2022)
7 KEY COMPANIES PROFILED
- 7.1 KEYSIGHT TECHNOLOGIES
- 7.1.1 KEYSIGHT TECHNOLOGIES SPECTRUM ANALYZER CORPORATION INFORMATION
- 7.1.2 KEYSIGHT TECHNOLOGIES SPECTRUM ANALYZER PRODUCT PORTFOLIO
- 7.1.3 KEYSIGHT TECHNOLOGIES SPECTRUM ANALYZER PRODUCTION, REVENUE, PRICE AND GROSS MARGIN (2017-2022)
- 7.1.4 KEYSIGHT TECHNOLOGIES MAIN BUSINESS AND MARKETS SERVED
- 7.2 YOKOGAWA ELECTRIC CORPORATION
- 7.2.1 YOKOGAWA ELECTRIC CORPORATION SPECTRUM ANALYZER CORPORATION INFORMATION
- 7.2.2 YOKOGAWA ELECTRIC CORPORATION SPECTRUM ANALYZER PRODUCT PORTFOLIO
- 7.2.3 YOKOGAWA ELECTRIC CORPORATION SPECTRUM ANALYZER PRODUCTION, REVENUE, PRICE AND GROSS MARGIN (2017-2022)
- 7.2.4 YOKOGAWA ELECTRIC CORPORATION MAIN BUSINESS AND MARKETS SERVED
- 7.2.5 YOKOGAWA ELECTRIC CORPORATION RECENT DEVELOPMENTS/UPDATES
- 7.3 ANRITSU CORPORATION
- 7.3.1 ANRITSU CORPORATION SPECTRUM ANALYZER CORPORATION INFORMATION
- 7.3.2 ANRITSU CORPORATION SPECTRUM ANALYZER PRODUCT PORTFOLIO
- 7.3.3 ANRITSU CORPORATION SPECTRUM ANALYZER PRODUCTION, REVENUE, PRICE AND GROSS MARGIN (2017-2022)
- 7.3.4 ANRITSU CORPORATION MAIN BUSINESS AND MARKETS SERVED
- 7.3.5 ANRITSU CORPORATION RECENT DEVELOPMENTS/UPDATES
- 7.4 ROHDE & SCHWARZ GMBH & CO., KG
- 7.4.1 ROHDE & SCHWARZ GMBH & CO., KG SPECTRUM ANALYZER CORPORATION INFORMATION
- 7.4.2 ROHDE & SCHWARZ GMBH & CO., KG SPECTRUM ANALYZER PRODUCT PORTFOLIO
- 7.4.3 ROHDE & SCHWARZ GMBH & CO., KG SPECTRUM ANALYZER PRODUCTION, REVENUE, PRICE AND GROSS MARGIN (2017-2022)
- 7.4.4 ROHDE & SCHWARZ GMBH & CO., KG MAIN BUSINESS AND MARKETS SERVED
- 7.4.5 ROHDE & SCHWARZ GMBH & CO., KG RECENT DEVELOPMENTS/UPDATES
- 7.5 II-VI INCORPORATED
- 7.5.1 II-VI INCORPORATED SPECTRUM ANALYZER CORPORATION INFORMATION
- 7.5.2 II-VI INCORPORATED SPECTRUM ANALYZER PRODUCT PORTFOLIO
- 7.5.3 II-VI INCORPORATED SPECTRUM ANALYZER PRODUCTION, REVENUE, PRICE AND GROSS MARGIN (2017-2022)
- 7.5.4 II-VI INCORPORATED MAIN BUSINESS AND MARKETS SERVED
- 7.5.5 II-VI INCORPORATED RECENT DEVELOPMENTS/UPDATES
- 7.6 VIAVI SOLUTIONS
- 7.6.1 VIAVI SOLUTIONS SPECTRUM ANALYZER CORPORATION INFORMATION
- 7.6.2 VIAVI SOLUTIONS SPECTRUM ANALYZER PRODUCT PORTFOLIO
- 7.6.3 VIAVI SOLUTIONS SPECTRUM ANALYZER PRODUCTION, REVENUE, PRICE AND GROSS MARGIN (2017-2022)
- 7.6.4 VIAVI SOLUTIONS MAIN BUSINESS AND MARKETS SERVED
- 7.6.5 VIAVI SOLUTIONS RECENT DEVELOPMENTS/UPDATES
- 7.7 ADVANTEST CORPORATION
- 7.7.1 ADVANTEST CORPORATION SPECTRUM ANALYZER CORPORATION INFORMATION
- 7.7.2 ADVANTEST CORPORATION SPECTRUM ANALYZER PRODUCT PORTFOLIO
- 7.7.3 ADVANTEST CORPORATION SPECTRUM ANALYZER PRODUCTION, REVENUE, PRICE AND GROSS MARGIN (2017-2022)
- 7.7.4 ADVANTEST CORPORATION MAIN BUSINESS AND MARKETS SERVED
- 7.7.5 ADVANTEST CORPORATION RECENT DEVELOPMENTS/UPDATES
- 7.8 TELEDYNE LECROY, INC.
- 7.8.1 TELEDYNE LECROY, INC. SPECTRUM ANALYZER CORPORATION INFORMATION
- 7.8.2 TELEDYNE LECROY, INC. SPECTRUM ANALYZER PRODUCT PORTFOLIO
- 7.8.3 TELEDYNE LECROY, INC. SPECTRUM ANALYZER PRODUCTION, REVENUE, PRICE AND GROSS MARGIN (2017-2022)
- 7.8.4 TELEDYNE LECROY, INC. MAIN BUSINESS AND MARKETS SERVED
- 7.8.5 TELEDYNE LECROY, INC. RECENT DEVELOPMENTS/UPDATES
- 7.9 NATIONAL INSTRUMENTS CORPORATION
- 7.9.1 NATIONAL INSTRUMENTS CORPORATION SPECTRUM ANALYZER CORPORATION INFORMATION
- 7.9.2 NATIONAL INSTRUMENTS CORPORATION SPECTRUM ANALYZER PRODUCT PORTFOLIO
- 7.9.3 NATIONAL INSTRUMENTS CORPORATION SPECTRUM ANALYZER PRODUCTION, REVENUE, PRICE AND GROSS MARGIN (2017-2022)
- 7.9.4 NATIONAL INSTRUMENTS CORPORATION MAIN BUSINESS AND MARKETS SERVED
- 7.9.5 NATIONAL INSTRUMENTS CORPORATION RECENT DEVELOPMENTS/UPDATES
- 7.10 B&K PRECISION CORPORATION
- 7.10.1 B&K PRECISION CORPORATION SPECTRUM ANALYZER CORPORATION INFORMATION
- 7.10.2 B&K PRECISION CORPORATION SPECTRUM ANALYZER PRODUCT PORTFOLIO
- 7.10.3 B&K PRECISION CORPORATION SPECTRUM ANALYZER PRODUCTION, REVENUE, PRICE AND GROSS MARGIN (2017-2022)
- 7.10.4 B&K PRECISION CORPORATION MAIN BUSINESS AND MARKETS SERVED
- 7.10.5 B&K PRECISION CORPORATION RECENT DEVELOPMENTS/UPDATES
- 7.11 STANFORD RESEARCH SYSTEMS, INC
- 7.11.1 STANFORD RESEARCH SYSTEMS, INC SPECTRUM ANALYZER CORPORATION INFORMATION
- 7.11.2 STANFORD RESEARCH SYSTEMS, INC SPECTRUM ANALYZER PRODUCT PORTFOLIO
- 7.11.3 STANFORD RESEARCH SYSTEMS, INC SPECTRUM ANALYZER PRODUCTION, REVENUE, PRICE AND GROSS MARGIN (2017-2022)
- 7.11.4 STANFORD RESEARCH SYSTEMS, INC MAIN BUSINESS AND MARKETS SERVED
- 7.12 EXFO
- 7.12.1 EXFO SPECTRUM ANALYZER CORPORATION INFORMATION
- 7.12.2 EXFO SPECTRUM ANALYZER PRODUCT PORTFOLIO
- 7.12.3 EXFO SPECTRUM ANALYZER PRODUCTION, REVENUE, PRICE AND GROSS MARGIN (2017-2022)
- 7.12.4 EXFO MAIN BUSINESS AND MARKETS SERVED
- 7.12.5 EXFO RECENT DEVELOPMENTS/UPDATES
- 7.13 AVCOM OF VIRGINIA. INC
- 7.13.1 AVCOM OF VIRGINIA. INC SPECTRUM ANALYZER CORPORATION INFORMATION
- 7.13.2 AVCOM OF VIRGINIA. INC SPECTRUM ANALYZER PRODUCT PORTFOLIO
- 7.13.3 AVCOM OF VIRGINIA. INC SPECTRUM ANALYZER PRODUCTION, REVENUE, PRICE AND GROSS MARGIN (2017-2022)
- 7.13.4 AVCOM OF VIRGINIA. INC MAIN BUSINESS AND MARKETS SERVED
- 7.14 OPTOPLEX
- 7.14.1 OPTOPLEX SPECTRUM ANALYZER CORPORATION INFORMATION
- 7.14.2 OPTOPLEX SPECTRUM ANALYZER PRODUCT PORTFOLIO
- 7.14.3 OPTOPLEX SPECTRUM ANALYZER PRODUCTION, REVENUE, PRICE AND GROSS MARGIN (2017-2022)
- 7.14.4 OPTOPLEX MAIN BUSINESS AND MARKETS SERVED
- 7.14.5 OPTOPLEX RECENT DEVELOPMENTS/UPDATES
- 7.15 LP TECHNOLOGIES INC
- 7.15.1 LP TECHNOLOGIES INC SPECTRUM ANALYZER CORPORATION INFORMATION
- 7.15.2 LP TECHNOLOGIES INC SPECTRUM ANALYZER PRODUCT PORTFOLIO
- 7.15.3 LP TECHNOLOGIES INC SPECTRUM ANALYZER PRODUCTION, REVENUE, PRICE AND GROSS MARGIN (2017-2022)
- 7.15.4 LP TECHNOLOGIES INC MAIN BUSINESS AND MARKETS SERVED
8 SPECTRUM ANALYZER MANUFACTURING COST ANALYSIS
- 8.1 SPECTRUM ANALYZER KEY RAW MATERIALS ANALYSIS
- 8.1.1 KEY RAW MATERIALS
- 8.1.2 KEY SUPPLIERS OF RAW MATERIALS
- 8.2 PROPORTION OF MANUFACTURING COST STRUCTURE
- 8.3 SPECTRUM ANALYZER INDUSTRIAL CHAIN ANALYSIS
9 MARKETING CHANNEL, DISTRIBUTORS AND CUSTOMERS
- 9.1 MARKETING CHANNEL
- 9.2 SPECTRUM ANALYZER DISTRIBUTORS LIST
- 9.3 SPECTRUM ANALYZER CUSTOMERS
10 SPECTRUM ANALYZER MARKET DYNAMICS
- 10.1 SPECTRUM ANALYZER INDUSTRY TRENDS
- 10.2 SPECTRUM ANALYZER MARKET DRIVERS
- 10.3 SPECTRUM ANALYZER MARKET CHALLENGES
- 10.4 SPECTRUM ANALYZER MARKET RESTRAINTS
11 PRODUCTION AND SUPPLY FORECAST
- 11.1 GLOBAL FORECASTED PRODUCTION OF SPECTRUM ANALYZER BY REGION (2023-2028)
- 11.2 GLOBAL SPECTRUM ANALYZER OUTPUT VALUE MARKET SHARE BY REGION (2023-2028)
12 CONSUMPTION AND DEMAND FORECAST
- 12.1 GLOBAL FORECASTED DEMAND ANALYSIS OF SPECTRUM ANALYZER
- 12.2 NORTH AMERICA FORECASTED CONSUMPTION OF SPECTRUM ANALYZER BY COUNTRY
- 12.3 EUROPE MARKET FORECASTED CONSUMPTION OF SPECTRUM ANALYZER BY COUNTRY
- 12.4 ASIA PACIFIC MARKET FORECASTED CONSUMPTION OF SPECTRUM ANALYZER BY REGION
- 12.5 SOUTH AMERICA FORECASTED CONSUMPTION OF SPECTRUM ANALYZER BY COUNTRY
13 FORECAST BY TYPE AND BY APPLICATION
- 13.1 GLOBAL PRODUCTION, REVENUE AND PRICE FORECAST BY TYPE (2023-2028)
- 13.1.1 GLOBAL FORECASTED PRODUCTION OF SPECTRUM ANALYZER BY TYPE (2023-2028)
- 13.1.2 GLOBAL FORECASTED REVENUE OF SPECTRUM ANALYZER BY TYPE (2023-2028)
- 13.1.3 GLOBAL FORECASTED PRICE OF SPECTRUM ANALYZER BY TYPE (2023-2028)
- 13.2 GLOBAL PRODUCTION, REVENUE AND PRICE FORECAST BY APPLICATION (2023-2028)
- 13.2.1 GLOBAL FORECASTED PRODUCTION OF SPECTRUM ANALYZER BY APPLICATION (2023-2028)
- 13.2.2 GLOBAL FORECASTED REVENUE OF SPECTRUM ANALYZER BY APPLICATION (2023-2028)
- 13.2.3 GLOBAL FORECASTED PRICE OF SPECTRUM ANALYZER BY APPLICATION (2023-2028)
14 RESEARCH FINDINGS AND CONCLUSION
15 METHODOLOGY AND DATA SOURCE
- 15.1 METHODOLOGY/RESEARCH APPROACH
- 15.1.1 RESEARCH PROGRAMS/DESIGN
- 15.1.2 MARKET SIZE ESTIMATION
- 15.1.3 MARKET BREAKDOWN AND DATA TRIANGULATION
- 15.2 DATA SOURCE
- 15.2.1 SECONDARY SOURCES
- 15.2.2 PRIMARY SOURCES
- 15.3 AUTHOR LIST
- 15.4 DISCLAIMER 110