|
|
市場調査レポート
商品コード
1241276
仮想発電所 (VPP) の世界市場:規模・現状・予測 (2023年~2029年)Global Virtual Power Plant (VPP) Market Size, Status and Forecast 2023-2029 |
||||||
|
|
|||||||
|
● お客様のご希望に応じて、既存データの加工や未掲載情報(例:国別セグメント)の追加などの対応が可能です。 詳細はお問い合わせください。 |
|||||||


| 仮想発電所 (VPP) の世界市場:規模・現状・予測 (2023年~2029年) |
|
出版日: 2023年03月22日
発行: QYResearch
ページ情報: 英文 140 Pages
納期: 2~3営業日
|
- 全表示
- 概要
- 図表
- 目次
世界の仮想発電所 (VPP) 市場は、予測期間中に24.16%のCAGRで成長し、2023年には10億6,164万米ドル、2029年までに38億8,976万米ドルに達する、と予測されます。
当レポートでは、世界の仮想発電所の市場について分析し、種類別・用途別・地域別 (国別) の市場動向の見通し (2018年~2029年)、主要企業のプロファイルなどについて調査しております。
目次
第1章 調査概要
- 調査範囲
- 種類別の市場分析
- 市場規模・成長率:種類別 (2018年・2022年・2029年)
- OC (運用能力) モデル
- FM (機能管理) モデル
- 用途別の市場
- 市場シェア:用途別 (2018年・2022年・2029年)
- 商業用
- 工業用
- 家庭用
- 前提・制約条件
- 分析対象
- 分析期間
第2章 世界の成長動向
- 世界の仮想発電所市場の展望 (2018年~2029年)
- 仮想発電所の成長動向:地域別
- 仮想発電所の市場力学
第3章 主要企業別の競合情勢
- 世界の仮想発電所の収益:企業別
- 市場シェア:企業の種類別 (ティア1、ティア2、ティア3)
- 分析対象企業:仮想発電所の収益別のランキング (2021年・2022年・2023年)
- 世界の仮想発電所市場の集中度
- 仮想発電所の主要企業:本社・提供エリア
- 仮想発電所の主要企業:設立時期
- 企業合併・買収 (M&A)、拡張計画
第4章 仮想発電所:種類別の内訳データ
- 過去の市場規模:種類別 (2018年~2023年)
- 市場規模の予測:種類別 (2024年~2029年)
第5章 仮想発電所:用途別の内訳データ
- 過去の市場規模:用途別 (2018年~2023年)
- 市場規模の予測:用途別 (2024年~2029年)
第6章 北米
- 北米の仮想発電所の市場規模 (2018年~2029年)
- 北米の仮想発電所の市場規模:種類別
- 北米の仮想発電所の市場規模:用途別
- 北米の仮想発電所の市場規模:国別
- 米国
- カナダ
第7章 欧州
- 欧州の仮想発電所の市場規模 (2018年~2029年)
- 欧州の仮想発電所の市場規模:種類別
- 欧州の仮想発電所の市場規模:用途別
- 欧州の仮想発電所の市場規模:国別
- ドイツ
- フランス
- 英国
- イタリア
- フィンランド
第8章 中国
- 中国の仮想発電所の市場規模 (2018年~2029年)
- 中国の仮想発電所の市場規模:種類別
- 中国の仮想発電所の市場規模:用途別
第9章 アジア(中国以外)
- アジアの仮想発電所の市場規模 (2018年~2029年)
- アジアの仮想発電所の市場規模:種類別
- アジアの仮想発電所の市場規模:用途別
- アジアの仮想発電所の市場規模:地域別
- 日本
- 韓国
- 東南アジア
- インド
- オーストラリア
第10章 中東・アフリカ・ラテンアメリカ
- 中東・アフリカ・ラテンアメリカの仮想発電所の市場規模 (2018年~2029年)
- 中東・アフリカ・ラテンアメリカの仮想発電所の市場規模:種類別
- 中東・アフリカ・ラテンアメリカの仮想発電所の市場規模:用途別
- 中東・アフリカ・ラテンアメリカの仮想発電所の市場規模:国別
- ブラジル
- メキシコ
- 中東
- アフリカ
第11章 主要企業のプロファイル
- rsted
- Duke Energy
- RWE
- Generac(Enbala)
- Bosch
- GE Digital Energy
- Enel X
- Schneider Electric(AutoGrid)
- Siemens
- Viridity Energy
- ABB
第12章 アナリストの見解/結論
第13章 付録
List of Tables
- Table 1. Global Virtual Power Plant (VPP) Market Size Growth Rate by Type (US$ Million): 2018 VS 2022 VS 2029
- Table 2. Global Virtual Power Plant (VPP) Market Size Growth by Application (US$ Million): 2018 VS 2022 VS 2029
- Table 3. Global Virtual Power Plant (VPP) Market Size Growth Rate (CAGR) by Region (US$ Million): 2018 VS 2022 VS 2029
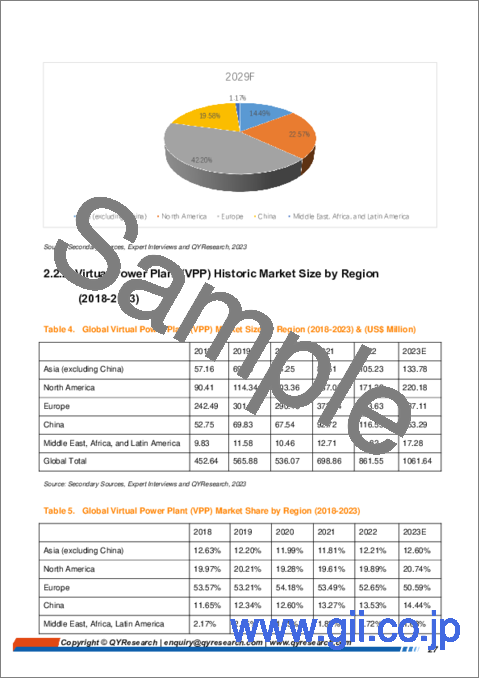
- Table 4. Global Virtual Power Plant (VPP) Market Size by Region (2018-2023) & (US$ Million)
- Table 5. Global Virtual Power Plant (VPP) Market Share by Region (2018-2023)
- Table 6. Global Virtual Power Plant (VPP) Forecasted Market Size by Region (2024-2029) & (US$ Million)
- Table 7. Global Virtual Power Plant (VPP) Market Share by Region (2024-2029)
- Table 8. Virtual Power Plant (VPP) Market Trends
- Table 9. Virtual Power Plant (VPP) Market Drivers
- Table 10. Virtual Power Plant (VPP) Market Challenges
- Table 11. Virtual Power Plant (VPP) Market Restraints
- Table 12. Global Virtual Power Plant (VPP) Revenue by Players (2018-2023) & (US$ Million)
- Table 13. Global Virtual Power Plant (VPP) Market Share by Players (2018-2023)
- Table 14. Global Top Virtual Power Plant (VPP) Players by Company Type (Tier 1, Tier 2, and Tier 3) & (based on the Revenue in Virtual Power Plant (VPP) as of 2021)
- Table 15. Global Virtual Power Plant (VPP) Industry Ranking 2021 VS 2022
- Table 16. Global 5 Largest Players Market Share by Virtual Power Plant (VPP) Revenue (CR5 and HHI) & (2018-2023)
- Table 17. Global Key Players of Virtual Power Plant (VPP), Headquarters and Area Served
- Table 18. Established Date of Virtual Power Plant Market
- Table 19. Mergers & Acquisitions, Expansion Plans
- Table 20. Global Virtual Power Plant (VPP) Market Size by Type (2018-2023) & (US$ Million)
- Table 21. Global Virtual Power Plant (VPP) Revenue Market Share by Type (2018-2023)
- Table 22. Global Virtual Power Plant (VPP) Forecasted Market Size by Type (2024-2029) & (US$ Million)
- Table 23. Global Virtual Power Plant (VPP) Revenue Market Share by Type (2024-2029)
- Table 24. Global Virtual Power Plant (VPP) Market Size by Application (2018-2023) & (US$ Million)
- Table 25. Global Virtual Power Plant (VPP) Revenue Market Share by Application (2018-2023)
- Table 26. Global Virtual Power Plant (VPP) Forecasted Market Size by Application (2024-2029) & (US$ Million)
- Table 27. Global Virtual Power Plant (VPP) Revenue Market Share by Application (2024-2029)
- Table 28. North America Virtual Power Plant (VPP) Market Size by Type (2018-2023) & (US$ Million)
- Table 29. North America Virtual Power Plant (VPP) Market Size by Type (2024-2029) & (US$ Million)
- Table 30. North America Virtual Power Plant (VPP) Market Size by Application (2018-2023) & (US$ Million)
- Table 31. North America Virtual Power Plant (VPP) Market Size by Application (2024-2029) & (US$ Million)
- Table 32. North America Virtual Power Plant (VPP) Growth Rate (CAGR) by Country (US$ Million): 2018 VS 2022 VS 2029
- Table 33. North America Virtual Power Plant (VPP) Market Size by Country (2018-2023) & (US$ Million)
- Table 34. North America Virtual Power Plant (VPP) Market Size by Country (2024-2029) & (US$ Million)
- Table 35. Europe Virtual Power Plant (VPP) Market Size by Type (2018-2023) & (US$ Million)
- Table 36. Europe Virtual Power Plant (VPP) Market Size by Type (2024-2029) & (US$ Million)
- Table 37. Europe Virtual Power Plant (VPP) Market Size by Application (2018-2023) & (US$ Million)
- Table 38. Europe Virtual Power Plant (VPP) Market Size by Application (2024-2029) & (US$ Million)
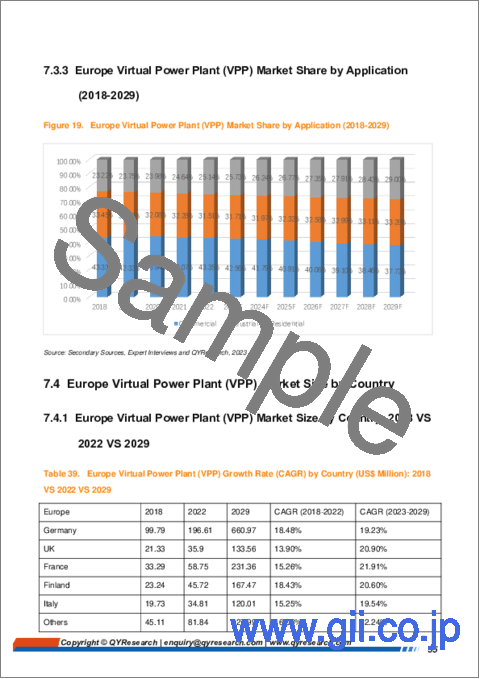
- Table 39. Europe Virtual Power Plant (VPP) Growth Rate (CAGR) by Country (US$ Million): 2018 VS 2022 VS 2029
- Table 40. Europe Virtual Power Plant (VPP) Market Size by Country (2018-2023) & (US$ Million)
- Table 41. Europe Virtual Power Plant (VPP) Market Size by Country (2024-2029) & (US$ Million)
- Table 42. China Virtual Power Plant (VPP) Market Size by Type (2018-2023) & (US$ Million)
- Table 43. China Virtual Power Plant (VPP) Market Size by Type (2024-2029) & (US$ Million)
- Table 44. China Virtual Power Plant (VPP) Market Size by Application (2018-2023) & (US$ Million)
- Table 45. China Virtual Power Plant (VPP) Market Size by Application (2024-2029) & (US$ Million)
- Table 46. Asia Virtual Power Plant (VPP) Market Size by Type (2018-2023) & (US$ Million)
- Table 47. Asia Virtual Power Plant (VPP) Market Size by Type (2024-2029) & (US$ Million)
- Table 48. Asia Virtual Power Plant (VPP) Market Size by Application (2018-2023) & (US$ Million)
- Table 49. Asia Virtual Power Plant (VPP) Market Size by Application (2024-2029) & (US$ Million)
- Table 50. Asia Virtual Power Plant (VPP) Growth Rate (CAGR) by Region (US$ Million): 2018 VS 2022 VS 2029
- Table 51. Asia Virtual Power Plant (VPP) Market Size by Region (2018-2023) & (US$ Million)
- Table 52. Asia Virtual Power Plant (VPP) Market Size by Region (2024-2029) & (US$ Million)
- Table 53. Latin America Virtual Power Plant (VPP) Market Size by Type (2018-2023) & (US$ Million)
- Table 54. Middle East, Africa, and Latin America Virtual Power Plant (VPP) Market Size by Type (2024-2029) & (US$ Million)
- Table 55. Middle East, Africa, and Latin America Virtual Power Plant (VPP) Market Size by Application (2018-2023) & (US$ Million)
- Table 56. Middle East, Africa, and Latin America Virtual Power Plant (VPP) Market Size by Application (2024-2029) & (US$ Million)
- Table 57. Middle East, Africa, and Latin America Virtual Power Plant (VPP) Growth Rate (CAGR) by Country (US$ Million): 2018 VS 2022 VS 2029
- Table 58. Middle East, Africa, and Latin America Virtual Power Plant (VPP) Market Size by Country (2018-2023) & (US$ Million)
- Table 59. Middle East, Africa, and Latin America Virtual Power Plant (VPP) Market Size by Country (2024-2029) & (US$ Million)
- Table 60. Ørsted Company Details
- Table 61. Ørsted Business Overview
- Table 62. Ørsted Virtual Power Plant (VPP) Product
- Table 63. Ørsted Revenue in Virtual Power Plant (VPP) Business (2018-2023) & (US$ Million)
- Table 64. Ørsted Recent Development
- Table 65. Duke Energy Company Details
- Table 66. Duke Energy Business Overview
- Table 67. Duke Energy Virtual Power Plant (VPP) Product
- Table 68. Duke Energy Revenue in Virtual Power Plant (VPP) Business (2018-2023) & (US$ Million)
- Table 69. Duke Energy Recent Development
- Table 70. RWE Company Details
- Table 71. RWE Business Overview
- Table 72. RWE Virtual Power Plant (VPP) Product
- Table 73. RWE Revenue in Virtual Power Plant (VPP) Business (2018-2023) & (US$ Million)
- Table 74. RWE Recent Development
- Table 75. Generac (Enbala) Company Details
- Table 76. Generac (Enbala) Business Overview
- Table 77. Generac (Enbala) Virtual Power Plant (VPP) Product
- Table 78. Generac (Enbala) Revenue in Virtual Power Plant (VPP) Business (2018-2023) & (US$ Million)
- Table 79. Generac (Enbala) Recent Development
- Table 80. Bosch Company Details
- Table 81. Bosch Business Overview
- Table 82. Bosch Virtual Power Plant (VPP) Product
- Table 83. Bosch Revenue in Virtual Power Plant (VPP) Business (2018-2023) & (US$ Million)
- Table 84. Bosch Recent Development
- Table 85. GE Digital Energy Company Details
- Table 86. GE Digital Energy Business Overview
- Table 87. GE Digital Energy Virtual Power Plant (VPP) Product
- Table 88. GE Digital Energy Revenue in Virtual Power Plant (VPP) Business (2018-2023) & (US$ Million)
- Table 89. Enel X Company Details
- Table 90. Enel X Business Overview
- Table 91. Enel X Virtual Power Plant (VPP) Product
- Table 92. Enel X Revenue in Virtual Power Plant (VPP) Business (2018-2023) & (US$ Million)
- Table 93. Enel X Recent Development
- Table 94. Schneider Electric (AutoGrid) Company Details
- Table 95. Schneider Electric (AutoGrid) Business Overview
- Table 96. Schneider Electric (AutoGrid) Virtual Power Plant (VPP) Product
- Table 97. Schneider Electric (AutoGrid) Revenue in Virtual Power Plant (VPP) Business (2018-2023) & (US$ Million)
- Table 98. Siemens Company Details
- Table 99. Siemens Business Overview
- Table 100. Siemens Virtual Power Plant (VPP) Product
- Table 101. Siemens Revenue in Virtual Power Plant (VPP) Business (2018-2023) & (US$ Million)
- Table 102. Siemens Recent Development
- Table 103. Viridity Energy Company Details
- Table 104. Viridity Energy Business Overview
- Table 105. Viridity Energy Virtual Power Plant (VPP) Product
- Table 106. Viridity Energy Revenue in Virtual Power Plant (VPP) Business (2018-2023) & (US$ Million)
- Table 107. Viridity Energy Recent Development
- Table 108. ABB Company Details
- Table 109. ABB Business Overview
- Table 110. ABB Virtual Power Plant (VPP) Product
- Table 111. ABB Revenue in Virtual Power Plant (VPP) Business (2018-2023) & (US$ Million)
- Table 112. ABB Recent Development
- Table 113. Research Programs/Design for This Report
- Table 114. Key Data Information from Secondary Sources
- Table 115. Key Data Information from Primary Sources
- Table 116. QYR Business Unit and Senior & Team Lead Analysts
List of Figures
- Figure 1. Global Virtual Power Plant (VPP) Market Size Growth Rate by Type, 2018 VS 2022 VS 2029 (US$ Million)
- Figure 2. Global Virtual Power Plant (VPP) Market Share by Type: 2022 VS 2029
- Figure 3. Global Virtual Power Plant (VPP) Market Size Growth Rate by Application, 2018 VS 2022 VS 2029 (US$ Million)
- Figure 4. Global Virtual Power Plant (VPP) Market Share by Application: 2022 VS 2029
- Figure 5. Virtual Power Plant (VPP) Report Years Considered
- Figure 6. Global Virtual Power Plant (VPP) Market Size (US$ Million), Year-over-Year: 2018-2029
- Figure 7. Global Virtual Power Plant (VPP) Market Size, (US$ Million), 2018 VS 2022 VS 2029
- Figure 8. Global Virtual Power Plant (VPP) Market Share by Region: 2022 VS 2029
- Figure 9. Global Virtual Power Plant (VPP) Market Share by Players in 2022
- Figure 10. The Top 10 and 5 Players Market Share by Virtual Power Plant (VPP) Revenue in 2022
- Figure 11. North America Virtual Power Plant (VPP) Market Size YoY Growth (2018-2029) & (US$ Million)
- Figure 12. North America Virtual Power Plant (VPP) Market Share by Type (2018-2029)
- Figure 13. North America Virtual Power Plant (VPP) Market Share by Application (2018-2029)
- Figure 14. North America Virtual Power Plant (VPP) Market Share by Country (2018-2029)
- Figure 15. United States Virtual Power Plant (VPP) Market Size YoY Growth (2018-2029) & (US$ Million)
- Figure 16. Canada Virtual Power Plant (VPP) Market Size YoY Growth (2018-2029) & (US$ Million)
- Figure 17. Europe Virtual Power Plant (VPP) Market Size YoY Growth (2018-2029) & (US$ Million)
- Figure 18. Europe Virtual Power Plant (VPP) Market Share by Type (2018-2029)
- Figure 19. Europe Virtual Power Plant (VPP) Market Share by Application (2018-2029)
- Figure 20. Europe Virtual Power Plant (VPP) Market Share by Country (2018-2029)
- Figure 21. Germany Virtual Power Plant (VPP) Market Size YoY Growth (2018-2029) & (US$ Million)
- Figure 22. France Virtual Power Plant (VPP) Market Size YoY Growth (2018-2029) & (US$ Million)
- Figure 23. U.K. Virtual Power Plant (VPP) Market Size YoY Growth (2018-2029) & (US$ Million)
- Figure 24. Italy Virtual Power Plant (VPP) Market Size YoY Growth (2018-2029) & (US$ Million)
- Figure 25. Finland Virtual Power Plant (VPP) Market Size YoY Growth (2018-2029) & (US$ Million)
- Figure 26. China Virtual Power Plant (VPP) Market Size YoY Growth (2018-2029) & (US$ Million)
- Figure 27. China Virtual Power Plant (VPP) Market Share by Type (2018-2029)
- Figure 28. China Virtual Power Plant (VPP) Market Share by Application (2018-2029)
- Figure 29. Asia Virtual Power Plant (VPP) Market Size YoY Growth (2018-2029) & (US$ Million)
- Figure 30. Asia Virtual Power Plant (VPP) Market Share by Type (2018-2029)
- Figure 31. Asia Virtual Power Plant (VPP) Market Share by Application (2018-2029)
- Figure 32. Asia Virtual Power Plant (VPP) Market Share by Region (2018-2029)
- Figure 33. Japan Virtual Power Plant (VPP) Market Size YoY Growth (2018-2029) & (US$ Million)
- Figure 34. Korea Virtual Power Plant (VPP) Market Size YoY Growth (2018-2029) & (US$ Million)
- Figure 35. Southeast Asia Virtual Power Plant (VPP) Market Size YoY Growth (2018-2029) & (US$ Million)
- Figure 36. India Virtual Power Plant (VPP) Market Size YoY Growth (2018-2029) & (US$ Million)
- Figure 37. Australia Virtual Power Plant (VPP) Market Size YoY Growth (2018-2029) & (US$ Million)
- Figure 38. Middle East, Africa, and Latin America Virtual Power Plant (VPP) Market Size YoY Growth (2018-2029) & (US$ Million)
- Figure 39. Middle East, Africa, and Latin America Virtual Power Plant (VPP) Market Share by Type (2018-2029)
- Figure 40. Middle East, Africa, and Latin America Virtual Power Plant (VPP) Market Share by Application (2018-2029)
- Figure 41. Middle East, Africa, and Latin America Virtual Power Plant (VPP) Market Share by Country (2018-2029)
- Figure 42. Brazil Virtual Power Plant (VPP) Market Size YoY Growth (2018-2029) & (US$ Million)
- Figure 43. Mexico Virtual Power Plant (VPP) Market Size YoY Growth (2018-2029) & (US$ Million)
- Figure 44. Middle East Virtual Power Plant (VPP) Market Size YoY Growth (2018-2029) & (US$ Million)
- Figure 45. Africa Virtual Power Plant (VPP) Market Size YoY Growth (2018-2029) & (US$ Million)
- Figure 46. Ørsted Revenue Growth Rate in Virtual Power Plant (VPP) Business (2018-2023)
- Figure 47. Duke Energy Revenue Growth Rate in Virtual Power Plant (VPP) Business (2018-2023)
- Figure 48. RWE Revenue Growth Rate in Virtual Power Plant (VPP) Business (2018-2023)
- Figure 49. Generac (Enbala) Revenue Growth Rate in Virtual Power Plant (VPP) Business (2018-2023)
- Figure 50. Bosch Revenue Growth Rate in Virtual Power Plant (VPP) Business (2018-2023)
- Figure 51. GE Digital Energy Revenue Growth Rate in Virtual Power Plant (VPP) Business (2018-2023)
- Figure 52. Enel X Revenue Growth Rate in Virtual Power Plant (VPP) Business (2018-2023)
- Figure 53. Schneider Electric (AutoGrid) Revenue Growth Rate in Virtual Power Plant (VPP) Business (2018-2023)
- Figure 54. Siemens Revenue Growth Rate in Virtual Power Plant (VPP) Business (2018-2023)
- Figure 55. Viridity Energy Revenue Growth Rate in Virtual Power Plant (VPP) Business (2018-2023)
- Figure 56. ABB Revenue Growth Rate in Virtual Power Plant (VPP) Business (2018-2023)
- Figure 57. Bottom-up and Top-down Approaches for This Report
- Figure 58. Data Triangulation
- Figure 59. Key Executives Interviewed
Market Analysis and Insights:
The global Virtual Power Plant (VPP) market is projected to grow from US$ 1061.64 million in 2023 to US$ 3889.76 million by 2029, at a Compound Annual Growth Rate (CAGR) of 24.16% during the forecast period.
Report Includes
This report presents an overview of global market for Virtual Power Plant (VPP) market size. Analyses of the global market trends, with historic market revenue data for 2018 - 2022, estimates for 2023, and projections of CAGR through 2029.
This report researches the key producers of Virtual Power Plant (VPP), also provides the revenue of main regions and countries. Highlights of the upcoming market potential for Virtual Power Plant (VPP), and key regions/countries of focus to forecast this market into various segments and sub-segments. Country specific data and market value analysis for the U.S., Canada, Mexico, Brazil, China, Japan, South Korea, Southeast Asia, India, Germany, the U.K., Italy, Middle East, Africa, and Other Countries.
This report focuses on the Virtual Power Plant (VPP)revenue, market share and industry ranking of main companies, data from 2018 to 2023. Identification of the major stakeholders in the global Virtual Power Plant (VPP) market, and analysis of their competitive landscape and market positioning based on recent developments and segmental revenues. This report will help stakeholders to understand the competitive landscape and gain more insights and position their businesses and market strategies in a better way.
This report analyzes the segments data by Type and by Application, revenue, and growth rate, from 2018 to 2029. Evaluation and forecast the market size for Virtual Power Plant (VPP) revenue, projected growth trends, production technology, application and end-user industry.
Descriptive company profiles of the major global players, including Ørsted, Duke Energy, RWE, Generac (Enbala), Bosch, GE Digital Energy, Enel X, Schneider Electric (AutoGrid), and Siemens, etc.
By Company
- Ørsted
- Duke Energy
- RWE
- Generac (Enbala)
- Bosch
- GE Digital Energy
- Enel X
- Schneider Electric (AutoGrid)
- Siemens
- Viridity Energy
- ABB
Segment by Type
- OC Model
- FM Model
Segment by Application
- Commercial
- Industrial
- Residential
By Region
- North America
- United States
- Canada
- Asia (excluding China)
- Japan
- Korea
- Southeast Asia
- India
- Australia
- Europe
- Germany
- France
- U.K.
- Italy
- Finland
- Middle East, Africa, and Latin America
- Brazil
- Mexico
- Middle East
- Africa
- China
Chapter Outline
- Chapter 1: Introduces the report scope of the report, executive summary of different market segments (product type, application, etc), including the market size of each market segment, future development potential, and so on. It offers a high-level view of the current state of the market and its likely evolution in the short to mid-term, and long term.
- Chapter 2: Revenue of Virtual Power Plant (VPP) in global and regional level. It provides a quantitative analysis of the market size and development potential of each region and its main countries and introduces the market development, future development prospects, market space, and capacity of each country in the world. This section also introduces the market dynamics, latest developments of the market, the driving factors and restrictive factors of the market, the challenges and risks faced by companies in the industry, and the analysis of relevant policies in the industry.
- Chapter 3: Detailed analysis of Virtual Power Plant (VPP) companies competitive landscape, revenue, market share and industry ranking, latest development plan, merger, and acquisition information, etc.
- Chapter 4: Provides the analysis of various market segments by Type, covering the revenue, and development potential of each market segment, to help readers find the blue ocean market in different market segments.
- Chapter 5: Provides the analysis of various market segments by Application, covering the revenue, and development potential of each market segment, to help readers find the blue ocean market in different downstream markets.
- Chapter 6: North America (US & Canada) by Type, by Application and by country, revenue for each segment.
- Chapter 7: Europe by Type, by Application and by country, revenue for each segment.
- Chapter 8: China by Type, and by Application, revenue for each segment.
- Chapter 9: Asia (excluding China) by Type, by Application and by region, revenue for each segment.
- Chapter 10: Middle East, Africa, and Latin America by Type, by Application and by country, revenue for each segment.
- Chapter 11: Provides profiles of key companies, introducing the basic situation of the main companies in the market in detail, including product descriptions and specifications, Virtual Power Plant (VPP)revenue, gross margin, and recent development, etc.
- Chapter 12: Analyst's Viewpoints/Conclusions
Table of Contents
1 Report Overview
- 1.1 Study Scope
- 1.2 Market Analysis by Type
- 1.2.1 Global Virtual Power Plant (VPP) Market Size Growth Rate by Type: 2018 VS 2022 VS 2029
- 1.2.2 OC Model
- 1.2.3 FM Model
- 1.3 Market by Application
- 1.3.1 Global Virtual Power Plant (VPP) Market Share by Application: 2018 VS 2022 VS 2029
- 1.3.2 Commercial
- 1.3.3 Industrial
- 1.3.4 Residential
- 1.4 Assumptions and Limitations
- 1.5 Study Objectives
- 1.6 Years Considered
2 Global Growth Trends
- 2.1 Global Virtual Power Plant (VPP) Market Perspective (2018-2029)
- 2.2 Global Virtual Power Plant (VPP) Growth Trends by Region
- 2.2.1 Global Virtual Power Plant (VPP) Market Size by Region: 2018 VS 2022 VS 2029
- 2.2.2 Virtual Power Plant (VPP) Historic Market Size by Region (2018-2023)
- 2.2.3 Virtual Power Plant (VPP) Forecasted Market Size by Region (2024-2029)
- 2.3 Virtual Power Plant (VPP) Market Dynamics
- 2.3.1 Virtual Power Plant (VPP) Industry Trends
- 2.3.2 Virtual Power Plant (VPP) Market Drivers
- 2.3.3 Virtual Power Plant (VPP) Market Challenges
- 2.3.4 Virtual Power Plant (VPP) Market Restraints
3 Competition Landscape by Key Players
- 3.1 Global Revenue Virtual Power Plant (VPP) by Players
- 3.1.1 Global Virtual Power Plant (VPP) Revenue by Players (2018-2023)
- 3.1.2 Global Virtual Power Plant (VPP) Revenue Market Share by Players (2018-2023)
- 3.2 Global Virtual Power Plant (VPP) Market Share by Company Type (Tier 1, Tier 2, and Tier 3)
- 3.3 Global Key Players of Virtual Power Plant (VPP), Ranking by Revenue, 2021 VS 2022 VS 2023
- 3.4 Global Virtual Power Plant (VPP) Market Concentration Ratio
- 3.4.1 Global Virtual Power Plant (VPP) Market Concentration Ratio (CR5 and HHI)
- 3.4.2 Global Top 10 and Top 5 Companies by Virtual Power Plant (VPP) Revenue in 2022
- 3.5 Global Key Players of Virtual Power Plant (VPP) Head office and Area Served
- 3.6 Established Date of Virtual Power Plant Market
- 3.7 Mergers & Acquisitions, Expansion Plans
4 Virtual Power Plant (VPP) Breakdown Data by Type
- 4.1 Global Virtual Power Plant (VPP) Historic Market Size by Type (2018-2023)
- 4.2 Global Virtual Power Plant (VPP) Forecasted Market Size by Type (2024-2029)
5 Virtual Power Plant (VPP) Breakdown Data by Application
- 5.1 Global Virtual Power Plant (VPP) Historic Market Size by Application (2018-2023)
- 5.2 Global Virtual Power Plant (VPP) Forecasted Market Size by Application (2024-2029)
6 North America
- 6.1 North America Virtual Power Plant (VPP) Market Size (2018-2029)
- 6.2 North America Virtual Power Plant (VPP) Market Size by Type
- 6.2.1 North America Virtual Power Plant (VPP) Market Size by Type (2018-2023)
- 6.2.2 North America Virtual Power Plant (VPP) Market Size by Type (2024-2029)
- 6.2.3 North America Virtual Power Plant (VPP) Market Share by Type (2018-2029)
- 6.3 North America Virtual Power Plant (VPP) Market Size by Application
- 6.3.1 North America Virtual Power Plant (VPP) Market Size by Application (2018-2023)
- 6.3.2 North America Virtual Power Plant (VPP) Market Size by Application (2024-2029)
- 6.3.3 North America Virtual Power Plant (VPP) Market Share by Application (2018-2029)
- 6.4 North America Virtual Power Plant (VPP) Market Size by Country
- 6.4.1 North America Virtual Power Plant (VPP) Market Size by Country: 2018 VS 2022 VS 2029
- 6.4.2 North America Virtual Power Plant (VPP) Market Size by Country (2018-2023)
- 6.4.3 North America Virtual Power Plant (VPP) Market Share by Country (2024-2029)
- 6.4.4 United States
- 6.4.5 Canada
7 Europe
- 7.1 Europe Virtual Power Plant (VPP) Market Size (2018-2029)
- 7.2 Europe Virtual Power Plant (VPP) Market Size by Type
- 7.2.1 Europe Virtual Power Plant (VPP) Market Size by Type (2018-2023)
- 7.2.2 Europe Virtual Power Plant (VPP) Market Size by Type (2024-2029)
- 7.2.3 Europe Virtual Power Plant (VPP) Market Share by Type (2018-2029)
- 7.3 Europe Virtual Power Plant (VPP) Market Size by Application
- 7.3.1 Europe Virtual Power Plant (VPP) Market Size by Application (2018-2023)
- 7.3.2 Europe Virtual Power Plant (VPP) Market Size by Application (2024-2029)
- 7.3.3 Europe Virtual Power Plant (VPP) Market Share by Application (2018-2029)
- 7.4 Europe Virtual Power Plant (VPP) Market Size by Country
- 7.4.1 Europe Virtual Power Plant (VPP) Market Size by Country: 2018 VS 2022 VS 2029
- 7.4.2 Europe Virtual Power Plant (VPP) Market Size by Country (2018-2023)
- 7.4.3 Europe Virtual Power Plant (VPP) Market Size by Country (2024-2029)
- 7.4.4 Germany
- 7.4.5 France
- 7.4.6 U.K.
- 7.4.7 Italy
- 7.4.8 Finland
8 China
- 8.1 China Virtual Power Plant (VPP) Market Size (2018-2029)
- 8.2 China Virtual Power Plant (VPP) Market Size by Type
- 8.2.1 China Virtual Power Plant (VPP) Market Size by Type (2018-2023)
- 8.2.2 China Virtual Power Plant (VPP) Market Size by Type (2024-2029)
- 8.2.3 China Virtual Power Plant (VPP) Market Share by Type (2018-2029)
- 8.3 China Virtual Power Plant (VPP) Market Size by Application
- 8.3.1 China Virtual Power Plant (VPP) Market Size by Application (2018-2023)
- 8.3.2 China Virtual Power Plant (VPP) Market Size by Application (2024-2029)
- 8.3.3 China Virtual Power Plant (VPP) Market Share by Application (2018-2029)
9 Asia (excluding China)
- 9.1 Asia Virtual Power Plant (VPP) Market Size (2018-2029)
- 9.2 Asia Virtual Power Plant (VPP) Market Size by Type
- 9.2.1 Asia Virtual Power Plant (VPP) Market Size by Type (2018-2023)
- 9.2.2 Asia Virtual Power Plant (VPP) Market Size by Type (2024-2029)
- 9.2.3 Asia Virtual Power Plant (VPP) Market Share by Type (2018-2029)
- 9.3 Asia Virtual Power Plant (VPP) Market Size by Application
- 9.3.1 Asia Virtual Power Plant (VPP) Market Size by Application (2018-2023)
- 9.3.2 Asia Virtual Power Plant (VPP) Market Size by Application (2024-2029)
- 9.3.3 Asia Virtual Power Plant (VPP) Market Share by Application (2018-2029)
- 9.4 Asia Virtual Power Plant (VPP) Market Size by Region
- 9.4.1 Asia Virtual Power Plant (VPP) Market Size by Region: 2018 VS 2022 VS 2029
- 9.4.2 Asia Virtual Power Plant (VPP) Market Size by Region (2018-2023)
- 9.4.3 Asia Virtual Power Plant (VPP) Market Size by Region (2024-2029)
- 9.4.4 Japan
- 9.4.5 Korea
- 9.4.6 Southeast Asia
- 9.4.7 India
- 9.4.8 Australia
10 Middle East, Africa, and Latin America
- 10.1 Middle East, Africa, and Latin America Virtual Power Plant (VPP) Market Size (2018-2029)
- 10.2 Middle East, Africa, and Latin America Virtual Power Plant (VPP) Market Size by Type
- 10.2.1 Middle East, Africa, and Latin America Virtual Power Plant (VPP) Market Size by Type (2018-2023)
- 10.2.2 Middle East, Africa, and Latin America Virtual Power Plant (VPP) Market Size by Type (2024-2029)
- 10.2.3 Middle East, Africa, and Latin America Virtual Power Plant (VPP) Market Share by Type (2018-2029)
- 10.3 Middle East, Africa, and Latin America Virtual Power Plant (VPP) Market Size by Application
- 10.3.1 Middle East, Africa, and Latin America Virtual Power Plant (VPP) Market Size by Application (2018-2023)
- 10.3.2 Middle East, Africa, and Latin America Virtual Power Plant (VPP) Market Size by Application (2024-2029)
- 10.3.3 Middle East, Africa, and Latin America Virtual Power Plant (VPP) Market Share by Application (2018-2029)
- 10.4 Middle East, Africa, and Latin America Virtual Power Plant (VPP) Market Size by Country
- 10.4.1 Middle East, Africa, and Latin America Virtual Power Plant (VPP) Market Size by Country: 2018 VS 2022 VS 2029
- 10.4.2 Middle East, Africa, and Latin America Virtual Power Plant (VPP) Market Size by Country (2018-2023)
- 10.4.3 Middle East, Africa, and Latin America Virtual Power Plant (VPP) Market Size by Country (2024-2029)
- 10.4.4 Brazil
- 10.4.5 Mexico
- 10.4.6 Middle East
- 10.4.7 Africa
11 Key Players Profiles
- 11.1 Ørsted
- 11.1.1 Ørsted Company Details
- 11.1.2 Ørsted Business Overview
- 11.1.3 Ørsted Virtual Power Plant (VPP) Introduction
- 11.1.4 Ørsted Revenue in Virtual Power Plant (VPP) Business (2018-2023)
- 11.1.5 Ørsted Recent Development
- 11.2 Duke Energy
- 11.2.1 Duke Energy Company Details
- 11.2.2 Duke Energy Business Overview
- 11.2.3 Duke Energy Virtual Power Plant (VPP) Introduction
- 11.2.4 Duke Energy Revenue in Virtual Power Plant (VPP) Business (2018-2023)
- 11.2.5 Duke Energy Recent Development
- 11.3 RWE
- 11.3.1 RWE Company Details
- 11.3.2 RWE Business Overview
- 11.3.3 RWE Virtual Power Plant (VPP) Introduction
- 11.3.4 RWE Revenue in Virtual Power Plant (VPP) Business (2018-2023)
- 11.3.5 RWE Recent Development
- 11.4 Generac (Enbala)
- 11.4.1 Generac (Enbala) Company Details
- 11.4.2 Generac (Enbala) Business Overview
- 11.4.3 Generac (Enbala) Virtual Power Plant (VPP) Introduction
- 11.4.4 Generac (Enbala) Revenue in Virtual Power Plant (VPP) Business (2018-2023)
- 11.4.5 Generac (Enbala) Recent Development
- 11.5 Bosch
- 11.5.1 Bosch Company Details
- 11.5.2 Bosch Business Overview
- 11.5.3 Bosch Virtual Power Plant (VPP) Introduction
- 11.5.4 Bosch Revenue in Virtual Power Plant (VPP) Business (2018-2023)
- 11.5.5 Bosch Recent Development
- 11.6 GE Digital Energy
- 11.6.1 GE Digital Energy Company Details
- 11.6.2 GE Digital Energy Business Overview
- 11.6.3 GE Digital Energy Virtual Power Plant (VPP) Introduction
- 11.6.4 GE Digital Energy Revenue in Virtual Power Plant (VPP) Business (2018-2023)
- 11.7 Enel X
- 11.7.1 Enel X Company Details
- 11.7.2 Enel X Business Overview
- 11.7.3 Enel X Virtual Power Plant (VPP) Introduction
- 11.7.4 Enel X Revenue in Virtual Power Plant (VPP) Business (2018-2023)
- 11.7.5 Enel X Recent Development
- 11.8 Schneider Electric (AutoGrid)
- 11.8.1 Schneider Electric (AutoGrid) Company Details
- 11.8.2 Schneider Electric (AutoGrid) Business Overview
- 11.8.3 Schneider Electric (AutoGrid) Virtual Power Plant (VPP) Introduction
- 11.8.4 Schneider Electric (AutoGrid) Revenue in Virtual Power Plant (VPP) Business (2018-2023)
- 11.9 Siemens
- 11.9.1 Siemens Company Details
- 11.9.2 Siemens Business Overview
- 11.9.3 Siemens Virtual Power Plant (VPP) Introduction
- 11.9.4 Siemens Revenue in Virtual Power Plant (VPP) Business (2018-2023)
- 11.9.5 Siemens Recent Development
- 11.10 Viridity Energy
- 11.10.1 Viridity Energy Company Details
- 11.10.2 Viridity Energy Business Overview
- 11.10.3 Viridity Energy Virtual Power Plant (VPP) Introduction
- 11.10.4 Viridity Energy Revenue in Virtual Power Plant (VPP) Business (2018-2023)
- 11.10.5 Viridity Energy Recent Development
- 11.11 ABB
- 11.11.1 ABB Company Details
- 11.11.2 ABB Business Overview
- 11.11.3 ABB Virtual Power Plant (VPP) Introduction
- 11.11.4 ABB Revenue in Virtual Power Plant (VPP) Business (2018-2023)
- 11.11.5 ABB Recent Development
12 Analyst's Viewpoints/Conclusions
13 Appendix
- 13.1 Research Methodology
- 13.1.1 Methodology/Research Approach
- 13.1.2 Data Source
- 13.2 Author Details
- 13.3 Disclaimer