|
|
市場調査レポート
商品コード
1062766
熱伝導材料の世界市場(2022年)Global Thermal Interface Materials Market Research Report 2022 |
||||||
|
|
|||||||
|
● お客様のご希望に応じて、既存データの加工や未掲載情報(例:国別セグメント)の追加などの対応が可能です。 詳細はお問い合わせください。 |
|||||||


| 熱伝導材料の世界市場(2022年) |
|
出版日: 2022年08月01日
発行: QYResearch
ページ情報: 英文 120 Pages
納期: 2~3営業日
|
- 全表示
- 概要
- 図表
- 目次
世界の熱伝導材料の市場規模は、2020年に10億317万米ドルとなりました。
同市場は、2027年までの間に5.47%のCAGRで推移し、15億2,491万米ドルに達すると予測されています。
当レポートでは、世界の熱伝導材料市場について調査し、市場規模や予測、タイプ・アプリケーション・企業・地域別の市場分析、市場力学、競合情勢、主要企業のプロファイルなどの情報を提供しています。
目次
第1章 熱伝導材料の市場概要
- 熱伝導材料の製品概要と範囲
- タイプ別セグメント
- 市場規模の成長率分析:2021 VS 2027
- 熱伝導性パッド
- 熱伝導性グリース
- 熱伝導性ペースト
- 熱伝導性接着剤
- ギャップフィラー
- その他
- アプリケーション別セグメント
- 消費比較:2016 VS 2021 VS 2027
- 家電
- LED
- 自動車
- 電気通信
- その他
- 世界市場の成長見通し
- 収益推計・予測(2016-2027)
- 生産能力推計・予測(2016-2027)
- 生産推計・予測(2016-2027)
- 地域別:市場規模
- 地域別:市場規模推計・予測(2016 VS 2021 VS 2027)
- 北米の推計・予測(2016-2027)
- 欧州の推計・予測(2016-2027)
- 中国の推計・予測(2016-2027)
- 日本の推計・予測(2016-2027)
- 東南アジアの推計・予測(2016-2027)
- インドの推計・予測(2016-2027)
第2章 メーカー別:市場競争
- メーカー別:生産能力市場シェア(2016-2021)
- メーカー別:収益市場シェア(2016-2021)
- 企業タイプ別:市場シェア(Tier 1、Tier 2、Tier 3)
- メーカー別:平均価格(2016-2021)
- メーカーの生産拠点、提供エリア
- 市場の競争状況と動向
第3章 地域別:生産能力
- 生産能力市場シェア(2016-2021)
- 収益市場シェア(2016-2021)
- 生産能力、収益、価格、粗利益(2016-2021)
- 北米
- 欧州
- 中国
- 日本
- 東南アジア
- インド
第4章 地域別:熱伝導材料の消費
- 地域別:消費
- 北米
- 国別:消費
- 米国
- カナダ
- 欧州
- 国別:消費
- ドイツ
- フランス
- 英国
- イタリア
- ロシア
- アジア太平洋
- 地域別:消費
- 中国
- 日本
- 韓国
- 東南アジア
- インド
- ラテンアメリカ
- 国別:消費
- メキシコ
- ブラジル
第5章 タイプ別:生産、収益、価格動向
- 生産市場シェア(2016-2021)
- 収益市場シェア(2016-2021)
- 価格(2016-2021)
第6章 アプリケーション別:消費分析
- 消費市場シェア(2016-2021)
- 消費成長率(2016-2021)
第7章 主要企業のプロファイル
- Dow
- Panasonic
- Parker Hannifin
- Shin-Etsu Chemical
- Laird
- Henkel
- Fujipoly
- DuPont
- Aavid (Boyd Corporation)
- 3M
- Wacker
- H.B. Fuller Company
- Denka Company Limited
- Dexerials Corporation
- Tanyuan Technology
- Jones Tech PLC
- Shenzhen FRD Science & Technology
第8章 熱伝導材料の製造コスト分析
- 主要原材料分析
- 製造コスト構造比
- 製造プロセス分析
- 産業チェーン分析
第9章 マーケティングチャネル、ディストリビューター、および顧客
- マーケティングチャネル
- ディストリビューターリスト
- 顧客
第10章 熱伝導材料市場力学
- 熱伝導材料業界の動向
- 熱伝導材料の成長要因
- EV
- 5Gステーション
- 熱伝導材料市場の課題
- 熱伝導材料市場の抑制要因
第11章 生産と供給予測
- 地域別:生産予測(2022-2027)
- 北米の生産、収益予測(2022-2027)
- 欧州の生産、収益予測(2022-2027)
- 中国の生産、収益予測(2022-2027)
- 日本の生産、収益予測(2022-2027)
- 東南アジアの生産、収益予測(2022-2027)
- インドの生産、収益予測(2022-2027)
第12章 消費と需要予測
- 世界の需要予測分析
- 北米:国別消費予測
- 欧州:国別消費予測
- アジア太平洋:地域別消費予測
- ラテンアメリカ:国別消費予測
第13章 タイプ・アプリケーション別:予測(2022-2027)
- タイプ別:世界の生産、収益および価格予測(2022-2027)
- アプリケーション別:世界の消費予測(2022-2027)
第14章 調査結果と結論
第15章 調査手法と情報源
LIST OF TABLES
- Table 1. Global Thermal Interface Materials Market Size by Type (MT) & (US$ Million) & (2022 VS 2028)
- Table 2. Thermal Interface Materials Application
- Table 3. Global Thermal Interface Materials Market Size by Application (MT) & (US$ Million) & (2022 VS 2028)
- Table 4. Demand relating Electronic Material in EV Market
- Table 5. Opportunity of TIM in EV Market
- Table 6. Global Thermal Interface Materials Production Capacity (MT) by Manufacturers in 2021
- Table 7. Global Thermal Interface Materials Production by Manufacturers (2017-2022) & (MT)
- Table 8. Global Thermal Interface Materials Production Market Share by Manufacturers (2017-2022)
- Table 9. Global Thermal Interface Materials Revenue by Manufacturers (2017-2022) & (US$ Million)
- Table 10. Global Thermal Interface Materials Revenue Share by Manufacturers (2017-2022)
- Table 11. Company Type (Tier 1, Tier 2, and Tier 3) & (based on the Revenue in Thermal Interface Materials as of 2021)
- Table 12. Global Market Thermal Interface Materials Average Price (US$/Kg) of Key Manufacturers (2017-2022)
- Table 13. Manufacturers Thermal Interface Materials Production Sites and Area Served
- Table 14. Global Thermal Interface Materials Manufacturers Market Concentration Ratio (CR5 and HHI)
- Table 15. Global Thermal Interface Materials Production (MT) by Type (2017-2022)
- Table 16. Global Thermal Interface Materials Production Market Share by Type (2017-2022)
- Table 17. Global Thermal Interface Materials Revenue (US$ Million) by Type (2017-2022)
- Table 18. Global Thermal Interface Materials Revenue Share by Type (2017-2022)
- Table 19. Global Thermal Interface Materials Price (US$/Kg) by Type (2017-2022)
- Table 20. Global Thermal Interface Materials Production (MT) by Application (2017-2022)
- Table 21. Global Thermal Interface Materials Production Market Share by Application (2017-2022)
- Table 22. Global Thermal Interface Materials Revenue (US$ Million) by Application (2017-2022)
- Table 23. Global Thermal Interface Materials Revenue Share by Application (2017-2022)
- Table 24. Global Thermal Interface Materials Price (US$/Kg) by Application (2017-2022)
- Table 25. Dow Thermal Interface Materials Corporation Information
- Table 26. Dow Thermal Interface Materials Specification and Application
- Table 27. Dow Thermal Interface Materials Production Capacity (MT), Revenue (US$ Million), Price (US$/Kg) and Gross Margin (2017-2022)
- Table 28. Dow Main Business and Markets Served
- Table 29. Panasonic Thermal Interface Materials Corporation Information
- Table 30. Panasonic Thermal Interface Materials Specification and Application
- Table 31. Panasonic Thermal Interface Materials Production Capacity (MT), Revenue (US$ Million), Price (US$/Kg) and Gross Margin (2017-2022)
- Table 32. Panasonic Main Business and Markets Served
- Table 33. Parker Hannifin Thermal Interface Materials Corporation Information
- Table 34. Parker Hannifin Thermal Interface Materials Specification and Application
- Table 35. Parker Hannifin Thermal Interface Materials Production Capacity (MT), Revenue (US$ Million), Price (US$/Kg) and Gross Margin (2017-2022)
- Table 36. Parker Hannifin Main Business and Markets Served
- Table 37. Parker Hannifin Recent Developments/Updates
- Table 38. Shin-Etsu Chemical Thermal Interface Materials Corporation Information
- Table 39. Shin-Etsu Chemical Thermal Interface Materials Specification and Application
- Table 40. Shin-Etsu Chemical Thermal Interface Materials Production Capacity (MT), Revenue (US$ Million), Price (US$/Kg) and Gross Margin (2017-2022)
- Table 41. Shin-Etsu Chemical Main Business and Markets Served
- Table 42. Henkel Thermal Interface Materials Corporation Information
- Table 43. Henkel Thermal Interface Materials Specification and Application
- Table 44. Henkel Thermal Interface Materials Production Capacity (MT), Revenue (US$ Million), Price (US$/Kg) and Gross Margin (2017-2022)
- Table 45. Henkel Main Business and Markets Served
- Table 46. Fujipoly Thermal Interface Materials Corporation Information
- Table 47. Fujipoly Thermal Interface Materials Specification and Application
- Table 48. Fujipoly Thermal Interface Materials Production Capacity (MT), Revenue (US$ Million), Price (US$/Kg) and Gross Margin (2017-2022)
- Table 49. Fujipoly Main Business and Markets Served
- Table 50. DuPont Thermal Interface Materials Corporation Information
- Table 51. DuPont Kapton Thermal Interface Material Product Overview
- Table 52. DuPont Thermal Interface Material Product Overview
- Table 53. DuPont BETASEAL Thermal Interface Material Product Overview
- Table 54. DuPont Thermal Interface Materials Production Capacity (MT), Revenue (US$ Million), Price (US$/Kg) and Gross Margin (2017-2022)
- Table 55. DuPont Main Business and Markets Served
- Table 56. Pros/Cons of Thermal Interface Material Product
- Table 57. Aavid (Boyd Corporation) Thermal Interface Materials Corporation Information
- Table 58. Aavid (Boyd Corporation) Thermal Interface Materials Specification and Application
- Table 59. Aavid (Boyd Corporation) Thermal Interface Materials Production Capacity (MT), Revenue (US$ Million), Price (US$/Kg) and Gross Margin (2017-2022)
- Table 60. Aavid (Boyd Corporation) Main Business and Markets Served
- Table 61. 3M Thermal Interface Materials Corporation Information
- Table 62. 3M Thermal Interface Materials Specification and Application
- Table 63. 3M Thermal Interface Materials Production Capacity (MT), Revenue (US$ Million), Price (US$/Kg) and Gross Margin (2017-2022)
- Table 64. 3M Main Business and Markets Served
- Table 65. Wacker Thermal Interface Materials Corporation Information
- Table 66. Wacker Thermal Interface Materials Specification and Application
- Table 67. Wacker Thermal Interface Materials Production Capacity (MT), Revenue (US$ Million), Price (US$/Kg) and Gross Margin (2017-2022)
- Table 68. Wacker Main Business and Markets Served
- Table 69. H.B. Fuller Company Thermal Interface Materials Corporation Information
- Table 70. H.B. Fuller Company Thermal Interface Materials Specification and Application
- Table 71. H.B. Fuller Company Thermal Interface Materials Production Capacity (MT), Revenue (US$ Million), Price (US$/Kg) and Gross Margin (2017-2022)
- Table 72. Denka Company Limited Thermal Interface Materials Corporation Information
- Table 73. Denka Company Limited Thermal Interface Materials Specification and Application
- Table 74. Denka Company Limited Thermal Interface Materials Production Capacity (MT), Revenue (US$ Million), Price (US$/Kg) and Gross Margin (2017-2022)
- Table 75. Denka Company Limited Main Business and Markets Served
- Table 76. Dexerials Corporation Thermal Interface Materials Corporation Information
- Table 77. Dexerials Corporation Thermal Interface Materials Specification and Application
- Table 78. Dexerials Corporation Thermal Interface Materials Production Capacity (MT), Revenue (US$ Million), Price (US$/Kg) and Gross Margin (2017-2022)
- Table 79. Dexerials Corporation Main Business and Markets Served
- Table 80. Tanyuan Technology Thermal Interface Materials Corporation Information
- Table 81. Tanyuan Technology Thermal Interface Materials Production Capacity (MT), Revenue (US$ Million), Price (US$/Kg) and Gross Margin (2017-2022)
- Table 82. Tanyuan Technology Main Business and Markets Served
- Table 83. Jones Tech PLC Thermal Interface Materials Corporation Information
- Table 84. Jones Tech PLC Thermal Interface Materials Specification and Application
- Table 85. Jones Tech PLC Thermal Interface Materials Production Capacity (MT), Revenue (US$ Million), Price (US$/Kg) and Gross Margin (2017-2022)
- Table 86. Jones Tech PLC Main Business and Markets Served
- Table 87. Shenzhen FRD Science & Technology Thermal Interface Materials Corporation Information
- Table 88. Shenzhen FRD Science & Technology Thermal Interface Materials Specification and Application
- Table 89. Shenzhen FRD Science & Technology Thermal Interface Materials Production Capacity (MT), Revenue (US$ Million), Price (US$/Kg) and Gross Margin (2017-2022)
- Table 90. Shenzhen FRD Science & Technology Main Business and Markets Served
- Table 91. Production Base and Market Concentration Rate of Raw Material
- Table 92. Key Suppliers of Raw Materials
- Table 93. BOM Analysis of TIM
- Table 94. Operation profit of TIM with comparison of filler maker's OP
- Table 95. Global Thermal Interface Materials Production Forecast by Type (2023-2028) & (MT)
- Table 96. Global Thermal Interface Materials Revenue Forecast by Type (2023-2028) & (US$ Million)
- Table 97. Global Thermal Interface Materials Price Forecast by Type (2023-2028) & (US$/Kg)
- Table 98. Global Thermal Interface Materials Production Forecast by Application (2023-2028) & (MT)
- Table 99. Global Thermal Interface Materials Revenue Forecast by Application (2023-2028) & (US$ Million)
- Table 100. Global Thermal Interface Materials Price Forecast by Application (2023-2028) & (US$/Kg)
- Table 101. Research Programs/Design for This Report
- Table 102. Key Data Information from Secondary Sources
- Table 103. Key Data Information from Primary Sources
List of Figures
- Figure 1. Product Picture of Thermal Interface Materials
- Figure 2. Global Thermal Interface Materials Market Share by Type: 2022 VS 2028
- Figure 3. HD Sheet Product Picture
- Figure 4. HD Paste Product Picture
- Figure 5. HD Gap Filler Product Picture
- Figure 6. Product Picture of Graphite Thermal Interface Material
- Figure 7. Global Thermal Interface Materials Market Share by Application: 2022 VS 2028
- Figure 8. LED
- Figure 9. Semiconductor
- Figure 10. Automotive Electronics
- Figure 11. Others
- Figure 12. Global Thermal Interface Materials Revenue (US$ Million), 2017 VS 2022 VS 2028
- Figure 13. Global Thermal Interface Materials Revenue (US$ Million) (2017-2028)
- Figure 14. Global Thermal Interface Materials Production Capacity (MT) & (2017-2028)
- Figure 15. Global Thermal Interface Materials Production (MT) & (2017-2028)
- Figure 16. Thermal Interface Materials Production Share by Manufacturers in 2021
- Figure 17. Global Thermal Interface Materials Revenue Share by Manufacturers in 2021
- Figure 18. The Global 5 and 10 Largest Players: Market Share by Thermal Interface Materials Revenue in 2021
- Figure 19. Production Market Share of Thermal Interface Materials by Type (2017-2022)
- Figure 20. Production Market Share of Thermal Interface Materials by Type in 2021
- Figure 21. Revenue Share of Thermal Interface Materials by Type (2017-2022)
- Figure 22. Revenue Market Share of Thermal Interface Materials by Type in 2021
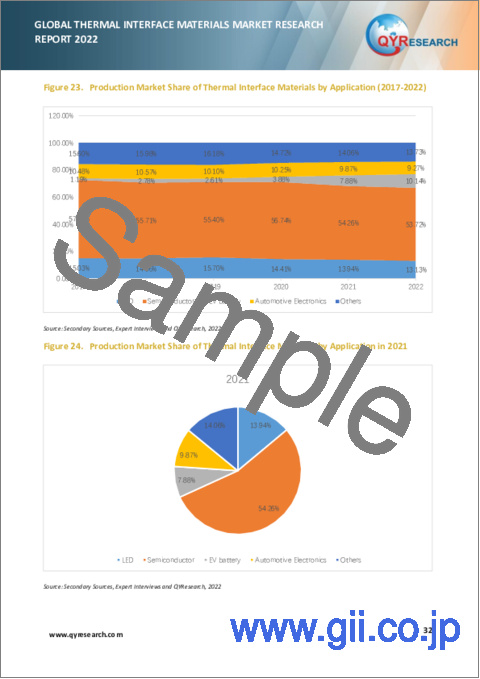
- Figure 23. Production Market Share of Thermal Interface Materials by Application (2017-2022)
- Figure 24. Production Market Share of Thermal Interface Materials by Application in 2021
- Figure 25. Revenue Share of Thermal Interface Materials by Application (2017-2022)
- Figure 26. Revenue Market Share of Thermal Interface Materials by Application in 2021
- Figure 27. Kapton® RS Film Section
- Figure 28. Kapton® RS Component Heating Connection Diagram
- Figure 29. Manufacturing Cost Structure of Thermal Interface Materials
- Figure 30. Cost Analysis of Alumina Filler in TIM Raw Material in 2021
- Figure 31. Manufacturing Process Analysis of Polymer Based Thermal Pad
- Figure 32. Manufacturing Process Analysis of Polymer Based Thermal Grease
- Figure 33. Thermal Interface Materials Industrial Chain Analysis
- Figure 34. Global Thermal Interface Materials Production Market Share Forecast by Type (2023-2028)
- Figure 35. Global Thermal Interface Materials Revenue Market Share Forecast by Type (2023-2028)
- Figure 36. Global Thermal Interface Materials Production Market Share Forecast by Application (2023-2028)
- Figure 37. Global Thermal Interface Materials Revenue Market Share Forecast by Application (2023-2028)
- Figure 38. Bottom-up and Top-down Approaches for This Report
- Figure 39. Data Triangulation
The global Thermal Interface Materials market was valued at USD 1,349.49 million in 2021 and is expected to reach USD 2,324.18 million by the end of 2028, growing at a CAGR of 7.42% between 2022 and 2028.
Drivers and Restrains:
The research report has incorporated the analysis of different factors that augment the market's growth. It constitutes trends, restraints, and drivers that transform the market in either a positive or negative manner. This section also provides the scope of different segments and applications that can potentially influence the market in the future. The detailed information is based on current trends and historic milestones. This section also provides an analysis of the volume of production about the global market and about each type from 2017 to 2028. This section mentions the volume of production by region from 2017 to 2028. Pricing analysis is included in the report according to each type from the year 2017 to 2028, manufacturer from 2017 to 2022, region from 2017 to 2022, and global price from 2017 to 2028.
A thorough evaluation of the restrains included in the report portrays the contrast to drivers and gives room for strategic planning. Factors that overshadow the market growth are pivotal as they can be understood to devise different bends for getting hold of the lucrative opportunities that are present in the ever-growing market. Additionally, insights into market expert's opinions have been taken to understand the market better.
Segment Analysis:
The research report includes specific segments by region (country), by manufacturers, by Type and by Application. Each type provides information about the production during the forecast period of 2017 to 2028. by Application segment also provides consumption during the forecast period of 2017 to 2028. Understanding the segments helps in identifying the importance of different factors that aid the market growth.
By Company
- Dow
- Panasonic
- Parker Hannifin
- Shin-Etsu Chemical
- Henkel
- Fujipoly
- DuPont
- Aavid (Boyd Corporation)
- 3M
- Wacker
- H.B. Fuller Company
- Denka Company Limited
- Dexerials Corporation
- Tanyuan Technology
- Jones Tech PLC
- Shenzhen FRD Science & Technology
Segment by Type
- HD Sheet
- HD Grease
- HD Paste
- HD Adhesive
- HD Gap Filler
- Others
Segment by Application
- LED
- Semiconductor
- Solar Energy
- EV battery
- Automotive Electronics
- Others
Production by Region
- North America
- Europe
- China
- Japan
- Southeast Asia
- India
Consumption by Region
- North America
- U.S.
- Canada
- Asia-Pacific
- China
- Japan
- South Korea
- China Taiwan
- Southeast Asia
- India
- Australia
- Europe
- Germany
- France
- U.K.
- Italy
- Russia
- Rest of Europe
- South America
- Mexico
- Brazil
- Rest of South America
TABLE OF CONTENTS
1 THERMAL INTERFACE MATERIALS MARKET OVERVIEW
- 1.1 PRODUCT OVERVIEW AND SCOPE OF THERMAL INTERFACE MATERIALS
- 1.2 THERMAL INTERFACE MATERIALS SEGMENT BY TYPE
- 1.2.1 GLOBAL THERMAL INTERFACE MATERIALS MARKET SIZE GROWTH RATE ANALYSIS BY TYPE: 2022 VS 2028
- 1.2.2 HD SHEET
- 1.2.3 HD GREASE
- 1.2.4 HD PASTE
- 1.2.5 HD ADHESIVE
- 1.2.6 HD GAP FILLER
- 1.2.7 OTHERS
- 1.3 THERMAL INTERFACE MATERIALS SEGMENT BY APPLICATION
- 1.3.1 GLOBAL THERMAL INTERFACE MATERIALS MARKET SIZE GROWTH RATE ANALYSIS BY APPLICATION: 2022 VS 2028
- 1.3.2 LED
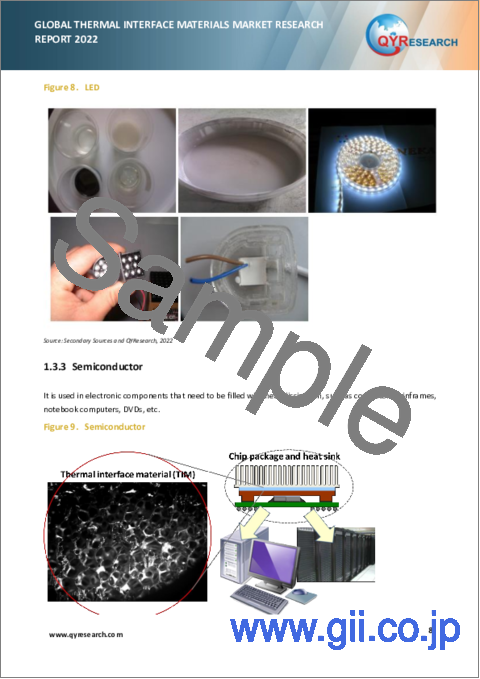
- 1.3.3 SEMICONDUCTOR
- 1.3.4 EV BATTERY
- 1.3.5 AUTOMOTIVE ELECTRONICS
- 1.3.6 OTHERS
- 1.4 GLOBAL MARKET GROWTH PROSPECTS
- 1.4.1 GLOBAL THERMAL INTERFACE MATERIALS REVENUE ESTIMATES AND FORECASTS (2017-2028)
- 1.4.2 GLOBAL THERMAL INTERFACE MATERIALS PRODUCTION CAPACITY ESTIMATES AND FORECASTS (2017-2028)
- 1.4.3 GLOBAL THERMAL INTERFACE MATERIALS PRODUCTION ESTIMATES AND FORECASTS (2017-2028)
2 MARKET COMPETITION BY MANUFACTURERS
- 2.1 GLOBAL THERMAL INTERFACE MATERIALS PRODUCTION CAPACITY MARKET SHARE BY MANUFACTURERS (2017-2022)
- 2.2 GLOBAL THERMAL INTERFACE MATERIALS REVENUE MARKET SHARE BY MANUFACTURERS (2017-2022)
- 2.3 THERMAL INTERFACE MATERIALS MARKET SHARE BY COMPANY TYPE (TIER 1, TIER 2, AND TIER 3)
- 2.4 GLOBAL THERMAL INTERFACE MATERIALS AVERAGE PRICE BY MANUFACTURERS (2017-2022)
- 2.5 MANUFACTURERS THERMAL INTERFACE MATERIALS PRODUCTION SITES, AREA SERVED, PRODUCT TYPE
- 2.6 THERMAL INTERFACE MATERIALS MARKET COMPETITIVE SITUATION AND TRENDS
- 2.6.1 THERMAL INTERFACE MATERIALS MARKET CONCENTRATION RATE
- 2.6.2 GLOBAL 5 AND 10 LARGEST THERMAL INTERFACE MATERIALS PLAYERS MARKET SHARE BY REVENUE
- 2.6.3 MERGE & ACQUISITION
3 SEGMENT BY TYPE
- 3.1 GLOBAL THERMAL INTERFACE MATERIALS PRODUCTION MARKET SHARE BY TYPE (2017-2022)
- 3.2 GLOBAL THERMAL INTERFACE MATERIALS REVENUE MARKET SHARE BY TYPE (2017-2022)
- 3.3 GLOBAL THERMAL INTERFACE MATERIALS PRICE BY TYPE (2017-2022)
4 SEGMENT BY APPLICATION
- 4.1 GLOBAL THERMAL INTERFACE MATERIALS PRODUCTION MARKET SHARE BY APPLICATION (2017-2022)
- 4.2 GLOBAL THERMAL INTERFACE MATERIALS REVENUE MARKET SHARE BY APPLICATION (2017-2022)
- 4.3 GLOBAL THERMAL INTERFACE MATERIALS PRICE BY APPLICATION (2017-2022)
5 KEY COMPANIES PROFILED
- 5.1 DOW
- 5.1.1 DOW THERMAL INTERFACE MATERIALS CORPORATION INFORMATION
- 5.1.2 DOW THERMAL INTERFACE MATERIALS PRODUCT PORTFOLIO
- 5.1.3 DOW THERMAL INTERFACE MATERIALS PRODUCTION CAPACITY, REVENUE, PRICE AND GROSS MARGIN (2017-2022)
- 5.1.4 DOW MAIN BUSINESS AND MARKETS SERVED
- 5.2 PANASONIC
- 5.2.1 PANASONIC THERMAL INTERFACE MATERIALS CORPORATION INFORMATION
- 5.2.2 PANASONIC THERMAL INTERFACE MATERIALS PRODUCT PORTFOLIO
- 5.2.3 PANASONIC THERMAL INTERFACE MATERIALS PRODUCTION CAPACITY, REVENUE, PRICE AND GROSS MARGIN (2017-2022)
- 5.2.4 PANASONIC MAIN BUSINESS AND MARKETS SERVED
- 5.3 PARKER HANNIFIN
- 5.3.1 PARKER HANNIFIN THERMAL INTERFACE MATERIALS CORPORATION INFORMATION
- 5.3.2 PARKER HANNIFIN THERMAL INTERFACE MATERIALS PRODUCT PORTFOLIO
- 5.3.3 PARKER HANNIFIN THERMAL INTERFACE MATERIALS PRODUCTION CAPACITY, REVENUE, PRICE AND GROSS MARGIN (2017-2022)
- 5.3.4 PARKER HANNIFIN MAIN BUSINESS AND MARKETS SERVED
- 5.3.5 PARKER HANNIFIN RECENT DEVELOPMENTS/UPDATES
- 5.4 SHIN-ETSU CHEMICAL
- 5.4.1 SHIN-ETSU CHEMICAL THERMAL INTERFACE MATERIALS CORPORATION INFORMATION
- 5.4.2 SHIN-ETSU CHEMICAL THERMAL INTERFACE MATERIALS PRODUCT PORTFOLIO
- 5.4.3 SHIN-ETSU CHEMICAL THERMAL INTERFACE MATERIALS PRODUCTION CAPACITY, REVENUE, PRICE AND GROSS MARGIN (2017-2022)
- 5.4.4 SHIN-ETSU CHEMICAL MAIN BUSINESS AND MARKETS SERVED
- 5.5 HENKEL
- 5.5.1 HENKEL THERMAL INTERFACE MATERIALS CORPORATION INFORMATION
- 5.5.2 HENKEL THERMAL INTERFACE MATERIALS PRODUCT PORTFOLIO
- 5.5.3 HENKEL THERMAL INTERFACE MATERIALS PRODUCTION CAPACITY, REVENUE, PRICE AND GROSS MARGIN (2017-2022)
- 5.5.4 HENKEL MAIN BUSINESS AND MARKETS SERVED
- 5.6 FUJIPOLY
- 5.6.1 FUJIPOLY THERMAL INTERFACE MATERIALS CORPORATION INFORMATION
- 5.6.2 FUJIPOLY THERMAL INTERFACE MATERIALS PRODUCT PORTFOLIO
- 5.6.3 FUJIPOLY THERMAL INTERFACE MATERIALS PRODUCTION CAPACITY, REVENUE, PRICE AND GROSS MARGIN (2017-2022)
- 5.6.4 FUJIPOLY MAIN BUSINESS AND MARKETS SERVED
- 5.7 DUPONT
- 5.7.1 DUPONT THERMAL INTERFACE MATERIALS CORPORATION INFORMATION
- 5.7.2 DUPONT THERMAL INTERFACE MATERIALS PRODUCT PORTFOLIO
- 5.7.2.1 DuPont Kapton Thermal Interface Kapton
- 5.7.2.2 DuPont Temprion Thermal Interface Material
- 5.7.2.3 DuPont BETASEAL Thermal Interface Material
- 5.7.3 DUPONT THERMAL INTERFACE MATERIALS PRODUCTION CAPACITY, REVENUE, PRICE AND GROSS MARGIN (2017-2022)
- 5.7.4 DUPONT MAIN BUSINESS AND MARKETS SERVED
- 5.7.5 PROS/CONS OF THERMAL INTERFACE MATERIAL PRODUCT
- 5.7.6 ANALYSIS OF LEADING TECHNOLOGY OF DUPONT IN THE THERMAL INTERFACE MATERIAL MARKET
- 5.7.6.1 BETASEAL
- 5.7.6.2 Kapton
- 5.8 AAVID (BOYD CORPORATION)
- 5.8.1 AAVID (BOYD CORPORATION) THERMAL INTERFACE MATERIALS CORPORATION INFORMATION
- 5.8.2 AAVID (BOYD CORPORATION) THERMAL INTERFACE MATERIALS PRODUCT PORTFOLIO
- 5.8.3 AAVID (BOYD CORPORATION) THERMAL INTERFACE MATERIALS PRODUCTION CAPACITY, REVENUE, PRICE AND GROSS MARGIN (2017-2022)
- 5.8.4 AAVID (BOYD CORPORATION) MAIN BUSINESS AND MARKETS SERVED
- 5.9 3M
- 5.9.1 3M THERMAL INTERFACE MATERIALS CORPORATION INFORMATION
- 5.9.2 3M THERMAL INTERFACE MATERIALS PRODUCT PORTFOLIO
- 5.9.3 3M THERMAL INTERFACE MATERIALS PRODUCTION CAPACITY, REVENUE, PRICE AND GROSS MARGIN (2017-2022)
- 5.9.4 3M MAIN BUSINESS AND MARKETS SERVED
- 5.10 WACKER
- 5.10.1 WACKER THERMAL INTERFACE MATERIALS CORPORATION INFORMATION
- 5.10.2 WACKER THERMAL INTERFACE MATERIALS PRODUCT PORTFOLIO
- 5.10.3 WACKER THERMAL INTERFACE MATERIALS PRODUCTION CAPACITY, REVENUE, PRICE AND GROSS MARGIN (2017-2022)
- 5.10.4 WACKER MAIN BUSINESS AND MARKETS SERVED
- 5.11 H.B. FULLER COMPANY
- 5.11.1 H.B. FULLER COMPANY THERMAL INTERFACE MATERIALS CORPORATION INFORMATION
- 5.11.2 H.B. FULLER COMPANY THERMAL INTERFACE MATERIALS PRODUCT PORTFOLIO
- 5.11.3 H.B. FULLER COMPANY THERMAL INTERFACE MATERIALS PRODUCTION CAPACITY, REVENUE, PRICE AND GROSS MARGIN (2017-2022)
- 5.11.4 H.B. FULLER COMPANY MAIN BUSINESS AND MARKETS SERVED
- 5.12 DENKA COMPANY LIMITED
- 5.12.1 DENKA COMPANY LIMITED THERMAL INTERFACE MATERIALS CORPORATION INFORMATION
- 5.12.2 DENKA COMPANY LIMITED THERMAL INTERFACE MATERIALS PRODUCT PORTFOLIO
- 5.12.3 DENKA COMPANY LIMITED THERMAL INTERFACE MATERIALS PRODUCTION CAPACITY, REVENUE, PRICE AND GROSS MARGIN (2017-2022)
- 5.12.4 DENKA COMPANY LIMITED MAIN BUSINESS AND MARKETS SERVED
- 5.13 DEXERIALS CORPORATION
- 5.13.1 DEXERIALS CORPORATION THERMAL INTERFACE MATERIALS CORPORATION INFORMATION
- 5.13.2 DEXERIALS CORPORATION THERMAL INTERFACE MATERIALS PRODUCT PORTFOLIO
- 5.13.3 DEXERIALS CORPORATION THERMAL INTERFACE MATERIALS PRODUCTION CAPACITY, REVENUE, PRICE AND GROSS MARGIN (2017-2022)
- 5.13.4 DEXERIALS CORPORATION MAIN BUSINESS AND MARKETS SERVED
- 5.14 TANYUAN TECHNOLOGY
- 5.14.1 TANYUAN TECHNOLOGY THERMAL INTERFACE MATERIALS CORPORATION INFORMATION
- 5.14.2 TANYUAN TECHNOLOGY THERMAL INTERFACE MATERIALS PRODUCT PORTFOLIO
- 5.14.3 TANYUAN TECHNOLOGY THERMAL INTERFACE MATERIALS PRODUCTION CAPACITY, REVENUE, PRICE AND GROSS MARGIN (2017-2022)
- 5.14.4 TANYUAN TECHNOLOGY MAIN BUSINESS AND MARKETS SERVED
- 5.15 JONES TECH PLC
- 5.15.1 JONES TECH PLC THERMAL INTERFACE MATERIALS CORPORATION INFORMATION
- 5.15.2 JONES TECH PLC THERMAL INTERFACE MATERIALS PRODUCT PORTFOLIO
- 5.15.3 JONES TECH PLC THERMAL INTERFACE MATERIALS PRODUCTION CAPACITY, REVENUE, PRICE AND GROSS MARGIN (2017-2022)
- 5.15.4 JONES TECH PLC MAIN BUSINESS AND MARKETS SERVED
- 5.16 SHENZHEN FRD SCIENCE & TECHNOLOGY
- 5.16.1 SHENZHEN FRD SCIENCE & TECHNOLOGY THERMAL INTERFACE MATERIALS CORPORATION INFORMATION
- 5.16.2 SHENZHEN FRD SCIENCE & TECHNOLOGY THERMAL INTERFACE MATERIALS PRODUCT PORTFOLIO
- 5.16.3 SHENZHEN FRD SCIENCE & TECHNOLOGY THERMAL INTERFACE MATERIALS PRODUCTION CAPACITY, REVENUE, PRICE AND GROSS MARGIN (2017-2022)
- 5.16.4 SHENZHEN FRD SCIENCE & TECHNOLOGY MAIN BUSINESS AND MARKETS SERVED
6 THERMAL INTERFACE MATERIALS MANUFACTURING COST ANALYSIS
- 6.1 THERMAL INTERFACE MATERIALS KEY RAW MATERIALS ANALYSIS
- 6.1.1 KEY RAW MATERIALS
- 6.1.2 KEY SUPPLIERS OF RAW MATERIALS
- 6.2 PROPORTION OF MANUFACTURING COST STRUCTURE
- 6.3 MANUFACTURING PROCESS ANALYSIS OF THERMAL INTERFACE MATERIALS
- 6.4 THERMAL INTERFACE MATERIALS INDUSTRIAL CHAIN ANALYSIS
7 FORECAST BY TYPE AND BY APPLICATION
- 7.1 GLOBAL PRODUCTION, REVENUE AND PRICE FORECAST BY TYPE (2023-2028)
- 7.1.1 GLOBAL FORECASTED PRODUCTION OF THERMAL INTERFACE MATERIALS BY TYPE (2023-2028)
- 7.1.2 GLOBAL FORECASTED REVENUE OF THERMAL INTERFACE MATERIALS BY TYPE (2023-2028)
- 7.1.3 GLOBAL FORECASTED PRICE OF THERMAL INTERFACE MATERIALS BY TYPE (2023-2028)
- 7.2 GLOBAL PRODUCTION, REVENUE AND PRICE FORECAST BY APPLICATION (2023-2028)
- 7.2.1 GLOBAL FORECASTED PRODUCTION OF THERMAL INTERFACE MATERIALS BY APPLICATION (2023-2028)
- 7.2.2 GLOBAL FORECASTED REVENUE OF THERMAL INTERFACE MATERIALS BY APPLICATION (2023-2028)
- 7.2.3 GLOBAL FORECASTED PRICE OF THERMAL INTERFACE MATERIALS BY APPLICATION (2023-2028)
8 RESEARCH FINDINGS AND CONCLUSION
9 METHODOLOGY AND DATA SOURCE
- 9.1 METHODOLOGY/RESEARCH APPROACH
- 9.1.1 RESEARCH PROGRAMS/DESIGN
- 9.1.2 MARKET SIZE ESTIMATION
- 9.1.3 MARKET BREAKDOWN AND DATA TRIANGULATION
- 9.2 DATA SOURCE
- 9.2.1 SECONDARY SOURCES
- 9.2.2 PRIMARY SOURCES
- 9.3 AUTHOR LIST
- 9.4 DISCLAIMER