|
|
市場調査レポート
商品コード
1068403
微細藻類の世界市場の洞察、2028年までの予測Global Microalgae Market Insights, Forecast to 2028 |
||||||
|
|
|||||||
|
● お客様のご希望に応じて、既存データの加工や未掲載情報(例:国別セグメント)の追加などの対応が可能です。 詳細はお問い合わせください。 |
|||||||


| 微細藻類の世界市場の洞察、2028年までの予測 |
|
出版日: 2022年04月05日
発行: QYResearch
ページ情報: 英文 205 Pages
納期: 2~3営業日
|
- 全表示
- 概要
- 図表
- 目次
世界の微細藻類の市場規模は、2022年から2028年の予測期間中に5.80%のCAGRで推移し、2022年の3億25万米ドルから、2028年までに4億2,108万米ドルに達すると予測されています。
世界の微細藻類の主要メーカーには、DIC Corporation、Cyanotech Corporation、Algaetech Group、TAAU Australia、Fuqing King Dnarmsa Spirulina、Shengbada Biology、Green A Biological、Dongtai City Spirulina Bio-Engineering, and Alltechなどが挙げられ、2021年には、主要企業5社で約47.34%の収益シェアを占めています。
当レポートでは、世界の微細藻類市場について調査し、市場規模や予測、タイプ・用途・企業・地域別の市場分析、市場力学、競合情勢、主要企業のプロファイルなどの情報を提供しています。
目次
第1章 調査範囲
- 微細藻類の製品イントロダクション
- タイプ別市場
- 市場規模の成長率(2017 VS 2021 VS 2028)
- スピルリナ
- ドナリエラサリナ
- クロレラ
- アファノカプサ
- その他
- 用途別市場
- 市場規模の成長率(2017 VS 2021 VS 2028)
- 健康
- 食品
- 飼料
- エネルギー
- その他
- 調査目的
- 考察年
第2章 エグゼクティブサマリー
- 販売推計・予測(2017-2028)
- 収益推計・予測(2017-2028)
- 地域別:収益(2017 VS 2021 VS 2028)
- 地域別:販売
- 地域別:収益
- 北米
- 欧州
- アジア太平洋
- ラテンアメリカ
- 中東・アフリカ
第3章 メーカー別:競争
- メーカー別:販売
- メーカー別:収益
- メーカー別:販売価格(2017-2022)
- 競合情勢の分析
- 合併と買収、拡張計画
第4章 タイプ別:市場規模
- タイプ別:販売
- タイプ別:収益
- タイプ別:価格
第5章 用途別:市場規模
- 用途別:販売
- 用途別:収益
- 用途別:価格
第6章 北米
- タイプ別:市場規模
- 用途別:市場規模
- 国別:販売
- 販売(2017-2028)
- 収益(2017-2028)
- 米国
- カナダ
第7章 欧州
- タイプ別:市場規模
- 用途別:市場規模
- 国別:市場規模
- 販売(2017-2028)
- 収益(2017-2028)
- ドイツ
- フランス
- 英国
- イタリア
- ロシア
第8章 アジア太平洋
- タイプ別:市場規模
- 用途別:市場規模
- 地域別:市場規模
- 販売(2017-2028)
- 収益(2017-2028)
- 中国
- 日本
- 韓国
- インド
- オーストラリア
- 東南アジア
第9章 ラテンアメリカ
- タイプ別:市場規模
- 用途別:市場規模
- 国別:市場規模
- 販売(2017-2028)
- 収益(2017-2028)
- メキシコ
- ブラジル
- アルゼンチン
第10章 中東とアフリカ
- タイプ別:市場規模
- 用途別:市場規模
- 国別:市場規模
- 販売(2017-2028)
- 収益(2017-2028)
- トルコ
- サウジアラビア
- アラブ首長国連邦
第11章 企業概要
- DIC Corporation
- Cyanotech Corporation
- Algaetech Group
- TAAU Australia
- Fuqing King Dnarmsa Spirulina
- Shengbada Biology
- Green A Biological
- Dongtai City Spirulina Bio-Engineering
- Alltech
- Parry Nutraceuticals
- BlueBioTech
- Roquette
- Allma(Allmicroalgae)
- Global EcoPower(Cyane)
- Archimede Ricerche
- AlgaEnergy
- Phycom
- Necton
- Chenghai Bao ER
- Dongying Haifu Biological
第12章 産業チェーンと販売チャネルの分析
- 産業チェーン分析
- 主要原材料
- 生産モードとプロセス
- 販売とマーケティング
- 顧客
第13章 微細藻類の市場力学
- 業界の動向
- 市場の促進要因
- 市場の課題
- 市場の抑制要因
第14章 世界の微細藻類の主な調査結果
第15章 付録
LIST OF TABLES
- Table 1. Global Microalgae Market Size Growth Rate by Type, 2017 VS 2021 VS 2028 (US$ Million)
- Table 2. Global Microalgae Market Size Growth Rate by Application, 2017 VS 2021 VS 2028 (US$ Million)
- Table 3. Table Applications of Microalgae
- Table 4. Global Microalgae Revenue by Region: 2017 VS 2021 VS 2028 (US$ Million)
- Table 5. Global Microalgae Sales by Region (2017-2022) & (MT)
- Table 6. Global Microalgae Sales Market Share by Region (2017-2022)
- Table 7. Global Microalgae Sales by Region (2023-2028) & (MT)
- Table 8. Global Microalgae Sales Market Share by Region (2023-2028)
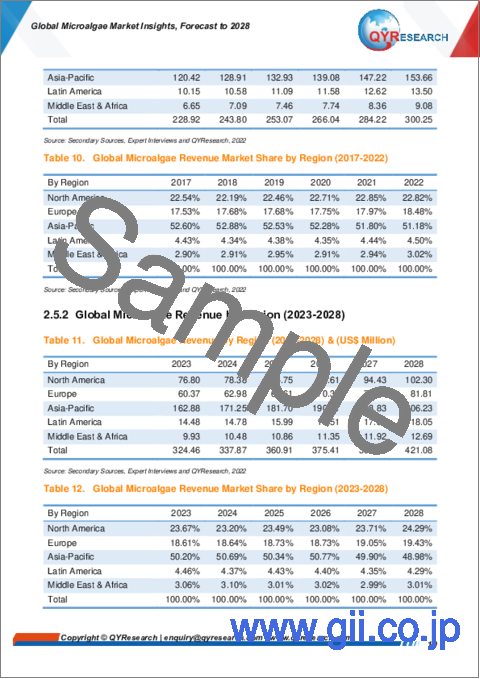
- Table 9. Global Microalgae Revenue by Region (2017-2022) & (US$ Million)
- Table 10. Global Microalgae Revenue Market Share by Region (2017-2022)
- Table 11. Global Microalgae Revenue by Region (2023-2028) & (US$ Million)
- Table 12. Global Microalgae Revenue Market Share by Region (2023-2028)
- Table 13. Global Microalgae Sales by Manufacturers (2017-2022) & (MT)
- Table 14. Global Microalgae Sales Share by Manufacturers (2017-2022)
- Table 15. Global Microalgae Revenue by Manufacturers (2017-2022) & (US$ Million)
- Table 16. Global Microalgae Revenue Market Share by Manufacturers (2017-2022)
- Table 17. Microalgae Price by Manufacturers (2017-2022) & (US$/Kg)
- Table 18. Global Microalgae Manufacturers Market Concentration Ratio (CR5 and HHI)
- Table 19. Global Microalgae by Company Type (Tier 1, Tier 2, and Tier 3) & (based on the Revenue in Microalgae as of 2021)
- Table 20. Microalgae Manufacturers Headquarters and Area Served
- Table 21. Manufacturers Microalgae Product Offered
- Table 22. Establish Date of Microalgae Manufacturers
- Table 23. Mergers & Acquisitions, Expansion Plans
- Table 24. Global Microalgae Sales by Type (2017-2022) & (MT)
- Table 25. Global Microalgae Sales by Type (2023-2028) & (MT)
- Table 26. Global Microalgae Sales Share by Type (2017-2022)
- Table 27. Global Microalgae Sales Share by Type (2023-2028)
- Table 28. Global Microalgae Revenue by Type (2017-2022) & (US$ Million)
- Table 29. Global Microalgae Revenue by Type (2023-2028) & (US$ Million)
- Table 30. Global Microalgae Revenue Share by Type (2017-2022)
- Table 31. Global Microalgae Revenue Share by Type (2023-2028)
- Table 32. Microalgae Price by Type (2017-2022) & (US$/Kg)
- Table 33. Global Microalgae Price Forecast by Type (2023-2028) & (US$/Kg)
- Table 34. Global Microalgae Sales by Application (2017-2022) & (MT)
- Table 35. Global Microalgae Sales by Application (2023-2028) & (MT)
- Table 36. Global Microalgae Sales Share by Application (2017-2022)
- Table 37. Global Microalgae Sales Share by Application (2023-2028)
- Table 38. Global Microalgae Revenue by Application (2017-2022) & (US$ Million)
- Table 39. Global Microalgae Revenue by Application (2023-2028) & (US$ Million)
- Table 40. Global Microalgae Revenue Share by Application (2017-2022)
- Table 41. Global Microalgae Revenue Share by Application (2023-2028)
- Table 42. Microalgae Price by Application (2017-2022) & (US$/Kg)
- Table 43. Global Microalgae Price Forecast by Application (2023-2028) & (US$/Kg)
- Table 44. North America Microalgae Sales by Type (2017-2022) & (MT)
- Table 45. North America Microalgae Sales by Type (2023-2028) & (MT)
- Table 46. North America Microalgae Revenue by Type (2017-2022) & (US$ Million)
- Table 47. North America Microalgae Revenue by Type (2023-2028) & (US$ Million)
- Table 48. North America Microalgae Sales by Application (2017-2022) & (MT)
- Table 49. North America Microalgae Sales by Application (2023-2028) & (MT)
- Table 50. North America Microalgae Revenue by Application (2017-2022) & (US$ Million)
- Table 51. North America Microalgae Revenue by Application (2023-2028) & (US$ Million)
- Table 52. North America Microalgae Sales by Country (2017-2022) & (MT)
- Table 53. North America Microalgae Sales by Country (2023-2028) & (MT)
- Table 54. North America Microalgae Revenue by Country (2017-2022) & (US$ Million)
- Table 55. North America Microalgae Revenue by Country (2023-2028) & (US$ Million)
- Table 56. Europe Microalgae Sales by Type (2017-2022) & (MT)
- Table 57. Europe Microalgae Sales by Type (2023-2028) & (MT)
- Table 58. Europe Microalgae Revenue by Type (2017-2022) & (US$ Million)
- Table 59. Europe Microalgae Revenue by Type (2023-2028) & (US$ Million)
- Table 60. Europe Microalgae Sales by Application (2017-2022) & (MT)
- Table 61. Europe Microalgae Sales by Application (2023-2028) & (MT)
- Table 62. Europe Microalgae Revenue by Application (2017-2022) & (US$ Million)
- Table 63. Europe Microalgae Revenue by Application (2023-2028) & (US$ Million)
- Table 64. Europe Microalgae Sales by Country (2017-2022) & (MT)
- Table 65. Europe Microalgae Sales by Country (2023-2028) & (MT)
- Table 66. Europe Microalgae Revenue by Country (2017-2022) & (US$ Million)
- Table 67. Europe Microalgae Revenue by Country (2023-2028) & (US$ Million)
- Table 68. Asia Pacific Microalgae Sales by Type (2017-2022) & (MT)
- Table 69. Asia Pacific Microalgae Sales by Type (2023-2028) & (MT)
- Table 70. Asia Pacific Microalgae Revenue by Type (2017-2022) & (US$ Million)
- Table 71. Asia Pacific Microalgae Revenue by Type (2023-2028) & (US$ Million)
- Table 72. Asia Pacific Microalgae Sales by Application (2017-2022) & (MT)
- Table 73. Asia Pacific Microalgae Sales by Application (2023-2028) & (MT)
- Table 74. Asia Pacific Microalgae Revenue by Application (2017-2022) & (US$ Million)
- Table 75. Asia Pacific Microalgae Revenue by Application (2023-2028) & (US$ Million)
- Table 76. Asia Pacific Microalgae Sales by Region (2017-2022) & (MT)
- Table 77. Asia Pacific Microalgae Sales by Region (2023-2028) & (MT)
- Table 78. Asia Pacific Microalgae Revenue by Region (2017-2022) & (US$ Million)
- Table 79. Asia Pacific Microalgae Revenue by Region (2023-2028) & (US$ Million)
- Table 80. Latin America Microalgae Sales by Type (2017-2022) & (MT)
- Table 81. Latin America Microalgae Sales by Type (2023-2028) & (MT)
- Table 82. Latin America Microalgae Revenue by Type (2017-2022) & (US$ Million)
- Table 83. Latin America Microalgae Revenue by Type (2023-2028) & (US$ Million)
- Table 84. Latin America Microalgae Sales by Application (2017-2022) & (MT)
- Table 85. Latin America Microalgae Sales by Application (2023-2028) & (MT)
- Table 86. Latin America Microalgae Revenue by Application (2017-2022) & (US$ Million)
- Table 87. Latin America Microalgae Revenue by Application (2023-2028) & (US$ Million)
- Table 88. Latin America Microalgae Sales by Country (2017-2022) & (MT)
- Table 89. Latin America Microalgae Sales by Country (2023-2028) & (MT)
- Table 90. Latin America Microalgae Revenue by Country (2017-2022) & (US$ Million)
- Table 91. Latin America Microalgae Revenue by Country (2023-2028) & (US$ Million)
- Table 92. Middle East and Africa Microalgae Sales by Type (2017-2022) & (MT)
- Table 93. Middle East and Africa Microalgae Sales by Type (2023-2028) & (MT)
- Table 94. Middle East and Africa Microalgae Revenue by Type (2017-2022) & (US$ Million)
- Table 95. Middle East and Africa Microalgae Revenue by Type (2023-2028) & (US$ Million)
- Table 96. Middle East and Africa Microalgae Sales by Application (2017-2022) & (MT)
- Table 97. Middle East and Africa Microalgae Sales by Application (2023-2028) & (MT)
- Table 98. Middle East and Africa Microalgae Revenue by Application (2017-2022) & (US$ Million)
- Table 99. Middle East and Africa Microalgae Revenue by Application (2023-2028) & (US$ Million)
- Table 100. Middle East and Africa Microalgae Sales by Country (2017-2022) & (MT)
- Table 101. Middle East and Africa Microalgae Sales by Country (2023-2028) & (MT)
- Table 102. Middle East and Africa Microalgae Revenue by Country (2017-2022) & (US$ Million)
- Table 103. Middle East and Africa Microalgae Revenue by Country (2023-2028) & (US$ Million)
- Table 104. DIC Corporation Information
- Table 105. DIC Corporation Microalgae Sales (MT), Revenue (US$ Million), Price (US$/Kg) and Gross Margin (2017-2022)
- Table 106. DIC Corporation Microalgae Product Model Numbers, Pictures, Descriptions and Specifications
- Table 107. DIC Corporation Recent Developments
- Table 108. Cyanotech Corporation Information
- Table 109. Cyanotech Corporation Microalgae Sales (MT), Revenue (US$ Million), Price (US$/Kg) and Gross Margin (2017-2022)
- Table 110. Cyanotech Corporation Microalgae Product Model Numbers, Pictures, Descriptions and Specifications
- Table 111. Cyanotech Corporation Recent Developments
- Table 112. Algaetech Group Corporation Information
- Table 113. Algaetech Group Microalgae Sales (MT), Revenue (US$ Million), Price (US$/Kg) and Gross Margin (2017-2022)
- Table 114. Algaetech Group Microalgae Product Model Numbers, Pictures, Descriptions and Specifications
- Table 115. Algaetech Group Recent Developments
- Table 116. TAAU Australia Corporation Information
- Table 117. TAAU Australia Microalgae Sales (MT), Revenue (US$ Million), Price (US$/Kg) and Gross Margin (2017-2022)
- Table 118. TAAU Australia Microalgae Product Model Numbers, Pictures, Descriptions and Specifications
- Table 119. Fuqing King Dnarmsa Spirulina Corporation Information
- Table 120. Fuqing King Dnarmsa Spirulina Microalgae Sales (MT), Revenue (US$ Million), Price (US$/Kg) and Gross Margin (2017-2022)
- Table 121. Fuqing King Dnarmsa Spirulina Microalgae Product Model Numbers, Pictures, Descriptions and Specifications
- Table 122. Shengbada Biology Corporation Information
- Table 123. Shengbada Biology Microalgae Sales (MT), Revenue (US$ Million), Price (US$/Kg) and Gross Margin (2017-2022)
- Table 124. Shengbada Biology Microalgae Product Model Numbers, Pictures, Descriptions and Specifications
- Table 125. Green A Biological Corporation Information
- Table 126. Green A Biological Microalgae Sales (MT), Revenue (US$ Million), Price (US$/Kg) and Gross Margin (2017-2022)
- Table 127. Green A Biological Microalgae Product Model Numbers, Pictures, Descriptions and Specifications
- Table 128. Dongtai City Spirulina Bio-Engineering Corporation Information
- Table 129. Dongtai City Spirulina Bio-Engineering Microalgae Sales (MT), Revenue (US$ Million), Price (US$/Kg) and Gross Margin (2017-2022)
- Table 130. Dongtai City Spirulina Bio-Engineering Microalgae Product Model Numbers, Pictures, Descriptions and Specifications
- Table 131. Alltech Corporation Information
- Table 132. Alltech Microalgae Sales (MT), Revenue (US$ Million), Price (US$/Kg) and Gross Margin (2017-2022)
- Table 133. Alltech Microalgae Product Model Numbers, Pictures, Descriptions and Specifications
- Table 134. Alltech Recent Developments
- Table 135. Parry Nutraceuticals Corporation Information
- Table 136. Parry Nutraceuticals Microalgae Sales (MT), Revenue (US$ Million), Price (US$/Kg) and Gross Margin (2017-2022)
- Table 137. Parry Nutraceuticals Microalgae Product Model Numbers, Pictures, Descriptions and Specifications
- Table 138. Parry Nutraceuticals Recent Developments
- Table 139. BlueBioTech Corporation Information
- Table 140. BlueBioTech Microalgae Sales (MT), Revenue (US$ Million), Price (US$/Kg) and Gross Margin (2017-2022)
- Table 141. BlueBioTech Microalgae Product Model Numbers, Pictures, Descriptions and Specifications
- Table 142. Roquette Corporation Information
- Table 143. Roquette Microalgae Sales (MT), Revenue (US$ Million), Price (US$/Kg) and Gross Margin (2017-2022)
- Table 144. Roquette Microalgae Product Model Numbers, Pictures, Descriptions and Specifications
- Table 145. Allma (Allmicroalgae) Corporation Information
- Table 146. Allma (Allmicroalgae) Microalgae Sales (MT), Revenue (US$ Million), Price (US$/Kg) and Gross Margin (2017-2022)
- Table 147. Allma (Allmicroalgae) Microalgae Product Model Numbers, Pictures, Descriptions and Specifications
- Table 148. Allma (Allmicroalgae) Recent Developments
- Table 149. Global EcoPower (Cyane) Corporation Information
- Table 150. Global EcoPower (Cyane) Microalgae Sales (MT), Revenue (US$ Million), Price (US$/Kg) and Gross Margin (2017-2022)
- Table 151. Global EcoPower (Cyane) Microalgae Product Model Numbers, Pictures, Descriptions and Specifications
- Table 152. Global EcoPower (Cyane) Recent Developments
- Table 153. Archimede Ricerche Corporation Information
- Table 154. Archimede Ricerche Microalgae Sales (MT), Revenue (US$ Million), Price (US$/Kg) and Gross Margin (2017-2022)
- Table 155. Archimede Ricerche Microalgae Product Model Numbers, Pictures, Descriptions and Specifications
- Table 156. AlgaEnergy Corporation Information
- Table 157. AlgaEnergy Microalgae Sales (MT), Revenue (US$ Million), Price (US$/Kg) and Gross Margin (2017-2022)
- Table 158. AlgaEnergy Microalgae Product Model Numbers, Pictures, Descriptions and Specifications
- Table 159. AlgaEnergy Recent Developments
- Table 160. Phycom Corporation Information
- Table 161. Phycom Microalgae Sales (MT), Revenue (US$ Million), Price (US$/Kg) and Gross Margin (2017-2022)
- Table 162. Phycom Microalgae Product Model Numbers, Pictures, Descriptions and Specifications
- Table 163. Necton Corporation Information
- Table 164. Necton Microalgae Sales (MT), Revenue (US$ Million), Price (US$/Kg) and Gross Margin (2017-2022)
- Table 165. Necton Microalgae Product Model Numbers, Pictures, Descriptions and Specifications
- Table 166. Chenghai Bao ER Corporation Information
- Table 167. Chenghai Bao ER Microalgae Sales (MT), Revenue (US$ Million), Price (US$/Kg) and Gross Margin (2017-2022)
- Table 168. Chenghai Bao ER Microalgae Product Model Numbers, Pictures, Descriptions and Specifications
- Table 169. Dongying Haifu Biological Corporation Information
- Table 170. Dongying Haifu Biological Microalgae Sales (MT), Revenue (US$ Million), Price (US$/Kg) and Gross Margin (2017-2022)
- Table 171. Dongying Haifu Biological Microalgae Product Model Numbers, Pictures, Descriptions and Specifications
- Table 172. Key Raw Materials Lists
- Table 173. Ideal Growing Conditions for Microalgae
- Table 174. Key Suppliers of Raw Materials
- Table 175. Table Raw Materials Sources of Microalgae Major Manufacturers in 2018
- Table 176. Microalgae Distributors List
- Table 177. Microalgae Customers List
- Table 178. Microalgae Market Trends
- Table 179. Microalgae Market Drivers
- Table 180. Microalgae Market Challenges
- Table 181. Microalgae Market Restraints
- Table 182. Research Programs/Design for This Report
- Table 183. Key Data Information from Secondary Sources
- Table 184. Key Data Information from Primary Sources
List of Figures
- Figure 1. Microalgae Product Picture
- Figure 2. Global Microalgae Market Size Growth Rate by Type, 2017 VS 2021 VS 2028 (US$ Million)
- Figure 3. Global Microalgae Market Value Share by Type: 2021
- Figure 4. Spirulina Product Picture
- Figure 5. Dunaliella Salina Product Picture
- Figure 6. Chlorella Product Picture
- Figure 7. Aphanocapsa Product Picture
- Figure 8. Other Product Picture
- Figure 9. Global Microalgae Market Size Growth Rate by Application, 2017 VS 2021 VS 2028 (US$ Million)
- Figure 10. Global Microalgae Market Share by Application: 2021
- Figure 11. Health
- Figure 12. Food
- Figure 13. Feed
- Figure 14. Energy
- Figure 15. Other
- Figure 16. Microalgae Report Years Considered
- Figure 17. Global Microalgae Sales 2017-2028 (MT)
- Figure 18. Global Microalgae Revenue 2017-2028 (US$ Million)
- Figure 19. Global Microalgae Revenue Market Share by Region in Percentage: 2021
- Figure 20. Global Microalgae Sales Market Share by Region (2017-2022)
- Figure 21. Global Microalgae Sales Market Share by Region (2023-2028)
- Figure 22. North America Microalgae Sales YoY (2017-2028) & (MT)
- Figure 23. North America Microalgae Revenue YoY (2017-2028) & (US$ Million)
- Figure 24. Europe Microalgae Sales YoY (2017-2028) & (MT)
- Figure 25. Europe Microalgae Revenue YoY (2017-2028) & (US$ Million)
- Figure 26. Asia-Pacific Microalgae Sales YoY (2017-2028) & (MT)
- Figure 27. Asia-Pacific Microalgae Revenue YoY (2017-2028) & (US$ Million)
- Figure 28. Latin America Microalgae Sales YoY (2017-2028) & (MT)
- Figure 29. Latin America Microalgae Revenue YoY (2017-2028) & (US$ Million)
- Figure 30. Middle East & Africa Microalgae Sales YoY (2017-2028) & (MT)
- Figure 31. Middle East & Africa Microalgae Revenue YoY (2017-2028) & (US$ Million)
- Figure 32. The Microalgae Market Share of Top 5 Largest Manufacturers Around the World in 2021
- Figure 33. The Microalgae Market Share of Top 10 Largest Manufacturers Around the World in 2021
- Figure 34. The Top 5 Largest Manufacturers of Microalgae in the World: Market Share by Microalgae Revenue in 2021
- Figure 35. The Top 10 Largest Manufacturers of Microalgae in the World: Market Share by Microalgae Revenue in 2021
- Figure 36. Global Microalgae Sales Market Share by Type (2017-2028)
- Figure 37. Global Microalgae Revenue Market Share by Type (2017-2028)
- Figure 38. Global Microalgae Sales Market Share by Application (2017-2028)
- Figure 39. Global Microalgae Revenue Market Share by Application (2017-2028)
- Figure 40. North America Microalgae Sales Market Share by Type (2017-2028)
- Figure 41. North America Microalgae Revenue Market Share by Type (2017-2028)
- Figure 42. North America Microalgae Sales Market Share by Application (2017-2028)
- Figure 43. North America Microalgae Revenue Market Share by Application (2017-2028)
- Figure 44. North America Microalgae Sales Share by Country (2017-2028)
- Figure 45. North America Microalgae Revenue Share by Country (2017-2028)
- Figure 46. United States Microalgae Revenue (2017-2028) & (US$ Million)
- Figure 47. Canada Microalgae Revenue (2017-2028) & (US$ Million)
- Figure 48. Europe Microalgae Sales Market Share by Type (2017-2028)
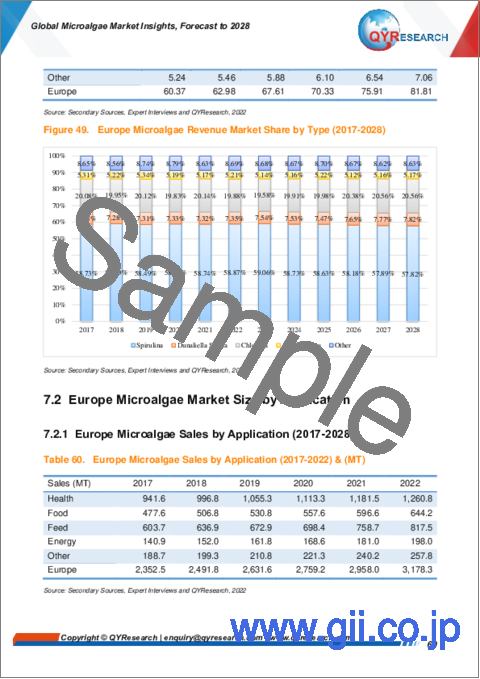
- Figure 49. Europe Microalgae Revenue Market Share by Type (2017-2028)
- Figure 50. Europe Microalgae Sales Market Share by Application (2017-2028)
- Figure 51. Europe Microalgae Revenue Market Share by Application (2017-2028)
- Figure 52. Europe Microalgae Sales Share by Country (2017-2028)
- Figure 53. Europe Microalgae Revenue Share by Country (2017-2028)
- Figure 54. Germany Microalgae Revenue (2017-2028) & (US$ Million)
- Figure 55. France Microalgae Revenue (2017-2028) & (US$ Million)
- Figure 56. U.K. Microalgae Revenue (2017-2028) & (US$ Million)
- Figure 57. Italy Microalgae Revenue (2017-2028) & (US$ Million)
- Figure 58. Russia Microalgae Revenue (2017-2028) & (US$ Million)
- Figure 59. Asia Pacific Microalgae Sales Market Share by Type (2017-2028)
- Figure 60. Asia Pacific Microalgae Revenue Market Share by Type (2017-2028)
- Figure 61. Asia Pacific Microalgae Sales Market Share by Application (2017-2028)
- Figure 62. Asia Pacific Microalgae Revenue Market Share by Application (2017-2028)
- Figure 63. Asia Pacific Microalgae Sales Share by Region (2017-2028)
- Figure 64. Asia Pacific Microalgae Revenue Share by Region (2017-2028)
- Figure 65. China Microalgae Revenue (2017-2028) & (US$ Million)
- Figure 66. Japan Microalgae Revenue (2017-2028) & (US$ Million)
- Figure 67. South Korea Microalgae Revenue (2017-2028) & (US$ Million)
- Figure 68. India Microalgae Revenue (2017-2028) & (US$ Million)
- Figure 69. Australia Microalgae Revenue (2017-2028) & (US$ Million)
- Figure 70. Southeast Asia Microalgae Revenue (2017-2028) & (US$ Million)
- Figure 71. Latin America Microalgae Sales Market Share by Type (2017-2028)
- Figure 72. Latin America Microalgae Revenue Market Share by Type (2017-2028)
- Figure 73. Latin America Microalgae Sales Market Share by Application (2017-2028)
- Figure 74. Latin America Microalgae Revenue Market Share by Application (2017-2028)
- Figure 75. Latin America Microalgae Sales Share by Country (2017-2028)
- Figure 76. Latin America Microalgae Revenue Share by Country (2017-2028)
- Figure 77. Mexico Microalgae Revenue (2017-2028) & (US$ Million)
- Figure 78. Brazil Microalgae Revenue (2017-2028) & (US$ Million)
- Figure 79. Argentina Microalgae Revenue (2017-2028) & (US$ Million)
- Figure 80. Middle East and Africa Microalgae Sales Market Share by Type (2017-2028)
- Figure 81. Middle East and Africa Microalgae Revenue Market Share by Type (2017-2028)
- Figure 82. Middle East and Africa Microalgae Sales Market Share by Application (2017-2028)
- Figure 83. Middle East and Africa Microalgae Revenue Market Share by Application (2017-2028)
- Figure 84. Middle East and Africa Microalgae Sales Share by Country (2017-2028)
- Figure 85. Middle East and Africa Microalgae Revenue Share by Country (2017-2028)
- Figure 86. Turkey Microalgae Revenue (2017-2028) & (US$ Million)
- Figure 87. Saudi Arabia Microalgae Revenue (2017-2028) & (US$ Million)
- Figure 88. UAE Microalgae Revenue (2017-2028) & (US$ Million)
- Figure 89. Microalgae Value Chain
- Figure 90. Key Equipment for Microalgae
- Figure 91. Microalgae Production Process
- Figure 92. Distributors Profiles
- Figure 93. Bottom-up and Top-down Approaches for This Report
- Figure 94. Data Triangulation
- Figure 95. Key Executives Interviewed 180
Market Analysis and Insights:
Due to the COVID-19 pandemic, the global Microalgae market size is estimated to be worth US$ 300.25 million in 2022 and is forecast to a readjusted size of US$ 421.08 million by 2028 with a CAGR of 5.80% during the forecast period 2022-2028. Fully considering the economic change by this health crisis, Spirulina accounting for 61.32% of the Microalgae global market in 2021, is projected to value US$ 257.48 million by 2028, growing at a revised 5.79% CAGR from 2022 to 2028. While Health segment is altered to a 5.45% CAGR throughout this forecast period (2022-2028).
China Microalgae market size was US$ 90.84 million in 2021, while the US and Europe Microalgae were US$ 59.24 million and US$ 51.08 million, severally. The proportion of the US was 20.84% in 2021, while China and Europe are 31.96% and 17.97% respectively, and it is predicted that China proportion will reach 30.74% in 2028, trailing a CAGR of 5.20% through the analysis period (2022-2028). As for the Europe Microalgae landscape, Germany is projected to reach US$ 21.41 million by 2028 trailing a CAGR of 6.64% over the forecast period (2022-2028).
The global key manufacturers of Microalgae include DIC Corporation, Cyanotech Corporation, Algaetech Group, TAAU Australia, Fuqing King Dnarmsa Spirulina, Shengbada Biology, Green A Biological, Dongtai City Spirulina Bio-Engineering, and Alltech, etc. In 2021, the global top five players hold a share approximately 47.34% in terms of revenue.
Scope and Segment:
Microalgae market is segmented by Type, and by Application. Players, stakeholders, and other participants in the global Microalgae market will be able to gain the upper hand as they use the report as a powerful resource. The segmental analysis focuses on sales, revenue and forecast by Type, and by Application for the period 2017-2028.
By Company
- DIC Corporation
- Cyanotech Corporation
- Algaetech Group
- TAAU Australia
- Fuqing King Dnarmsa Spirulina
- Shengbada Biology
- Green A Biological
- Dongtai City Spirulina Bio-Engineering
- Alltech
- Parry Nutraceuticals
- BlueBioTech
- Roquette
- Allma (Allmicroalgae)
- Global EcoPower (Cyane)
- Archimede Ricerche
- AlgaEnergy
- Phycom
- Necton
- Chenghai Bao ER
- Dongying Haifu Biological
Segment by Type
- Spirulina
- Dunaliella Salina
- Chlorella
- Aphanocapsa
- Other
Segment by Application
- Health
- Food
- Feed
- Energy
- Other
Segment by Region
- North America
- United States
- Canada
- Asia-Pacific
- China
- Japan
- South Korea
- India
- Australia
- Southeast Asia
- Europe
- Germany
- France
- U.K.
- Italy
- Russia
- Latin America
- Mexico
- Brazil
- Argentina
- Middle East & Africa
- Turkey
- Saudi Arabia
- UAE
TABLE OF CONTENTS
1 STUDY COVERAGE
- 1.1 Microalgae Product Introduction
- 1.2 Market by Type
- 1.2.1 Global Microalgae Market Size Growth Rate by Type, 2017 VS 2021 VS 2028
- 1.2.2 Spirulina
- 1.2.3 Dunaliella Salina
- 1.2.4 Chlorella
- 1.2.5 Aphanocapsa
- 1.2.6 Other
- 1.3 Market by Application
- 1.3.1 Global Microalgae Market Size Growth Rate by Application, 2017 VS 2021 VS 2028
- 1.3.2 Health
- 1.3.3 Food
- 1.3.4 Feed
- 1.3.5 Energy
- 1.3.6 Other
- 1.4 Study Objectives
- 1.5 Years Considered
2 EXECUTIVE SUMMARY
- 2.1 Global Microalgae Sales Estimates and Forecasts 2017-2028
- 2.2 Global Microalgae Revenue Estimates and Forecasts 2017-2028
- 2.3 Global Microalgae Revenue by Region: 2017 VS 2021 VS 2028
- 2.4 Global Microalgae Sales by Region
- 2.4.1 Global Microalgae Sales by Region (2017-2022)
- 2.4.2 Global Sales Microalgae by Region (2023-2028)
- 2.5 Global Microalgae Revenue by Region
- 2.5.1 Global Microalgae Revenue by Region (2017-2022)
- 2.5.2 Global Microalgae Revenue by Region (2023-2028)
- 2.6 North America
- 2.7 Europe
- 2.8 Asia-Pacific
- 2.9 Latin America
- 2.10 Middle East & Africa
3 COMPETITION BY MANUFACTURERS
- 3.1 Global Microalgae Sales by Manufacturers
- 3.1.1 Global Microalgae Sales by Manufacturers (2017-2022)
- 3.1.2 Global Microalgae Sales Market Share by Manufacturers (2017-2022)
- 3.1.3 Global Top 10 and Top 5 Largest Manufacturers of Microalgae in 2021
- 3.2 Global Microalgae Revenue by Manufacturers
- 3.2.1 Global Microalgae Revenue by Manufacturers (2017-2022)
- 3.2.2 Global Microalgae Revenue Market Share by Manufacturers (2017-2022)
- 3.2.3 Global Top 10 and Top 5 Companies by Microalgae Revenue in 2021
- 3.3 Global Microalgae Sales Price by Manufacturers (2017-2022)
- 3.4 Analysis of Competitive Landscape
- 3.4.1 Manufacturers Market Concentration Ratio (CR5 and HHI)
- 3.4.2 Global Microalgae Market Share by Company Type (Tier 1, Tier 2, and Tier 3)
- 3.4.3 Global Microalgae Manufacturers Geographical Distribution
- 3.5 Mergers & Acquisitions, Expansion Plans
4 MARKET SIZE BY TYPE
- 4.1 Global Microalgae Sales by Type
- 4.1.1 Global Microalgae Historical Sales by Type (2017-2022)
- 4.1.2 Global Microalgae Forecasted Sales by Type (2023-2028)
- 4.1.3 Global Microalgae Sales Market Share by Type (2017-2028)
- 4.2 Global Microalgae Revenue by Type
- 4.2.1 Global Microalgae Historical Revenue by Type (2017-2022)
- 4.2.2 Global Microalgae Forecasted Revenue by Type (2023-2028)
- 4.2.3 Global Microalgae Revenue Market Share by Type (2017-2028)
- 4.3 Global Microalgae Price by Type
- 4.3.1 Global Microalgae Price by Type (2017-2022)
- 4.3.2 Global Microalgae Price Forecast by Type (2023-2028)
5 MARKET SIZE BY APPLICATION
- 5.1 Global Microalgae Sales by Application
- 5.1.1 Global Microalgae Historical Sales by Application (2017-2022)
- 5.1.2 Global Microalgae Forecasted Sales by Application (2023-2028)
- 5.1.3 Global Microalgae Sales Market Share by Application (2017-2028)
- 5.2 Global Microalgae Revenue by Application
- 5.2.1 Global Microalgae Historical Revenue by Application (2017-2022)
- 5.2.2 Global Microalgae Forecasted Revenue by Application (2023-2028)
- 5.2.3 Global Microalgae Revenue Market Share by Application (2017-2028)
- 5.3 Global Microalgae Price by Application
- 5.3.1 Global Microalgae Price by Application (2017-2022)
- 5.3.2 Global Microalgae Price Forecast by Application (2023-2028)
6 NORTH AMERICA
- 6.1 North America Microalgae Market Size by Type
- 6.1.1 North America Microalgae Sales by Type (2017-2028)
- 6.1.2 North America Microalgae Revenue by Type (2017-2028)
- 6.2 North America Microalgae Market Size by Application
- 6.2.1 North America Microalgae Sales by Application (2017-2028)
- 6.2.2 North America Microalgae Revenue by Application (2017-2028)
- 6.3 North America Microalgae Sales by Country
- 6.3.1 North America Microalgae Sales by Country (2017-2028)
- 6.3.2 North America Microalgae Revenue by Country (2017-2028)
- 6.3.3 United States
- 6.3.4 Canada
7 EUROPE
- 7.1 Europe Microalgae Market Size by Type
- 7.1.1 Europe Microalgae Sales by Type (2017-2028)
- 7.1.2 Europe Microalgae Revenue by Type (2017-2028)
- 7.2 Europe Microalgae Market Size by Application
- 7.2.1 Europe Microalgae Sales by Application (2017-2028)
- 7.2.2 Europe Microalgae Revenue by Application (2017-2028)
- 7.3 Europe Microalgae Market Size by Country
- 7.3.1 Europe Microalgae Sales by Country (2017-2028)
- 7.3.2 Europe Microalgae Revenue by Country (2017-2028)
- 7.3.3 Germany
- 7.3.4 France
- 7.3.5 U.K.
- 7.3.6 Italy
- 7.3.7 Russia
8 ASIA PACIFIC
- 8.1 Asia Pacific Microalgae Market Size by Type
- 8.1.1 Asia Pacific Microalgae Sales by Type (2017-2028)
- 8.1.2 Asia Pacific Microalgae Revenue by Type (2017-2028)
- 8.2 Asia Pacific Microalgae Market Size by Application
- 8.2.1 Asia Pacific Microalgae Sales by Application (2017-2028)
- 8.2.2 Asia Pacific Microalgae Revenue by Application (2017-2028)
- 8.3 Asia Pacific Microalgae Market Size by Region
- 8.3.1 Asia Pacific Microalgae Sales by Region (2017-2028)
- 8.3.2 Asia Pacific Microalgae Revenue by Region (2017-2028)
- 8.3.3 China
- 8.3.4 Japan
- 8.3.5 South Korea
- 8.3.6 India
- 8.3.7 Australia
- 8.3.8 Southeast Asia
9 LATIN AMERICA
- 9.1 Latin America Microalgae Market Size by Type
- 9.1.1 Latin America Microalgae Sales by Type (2017-2028)
- 9.1.2 Latin America Microalgae Revenue by Type (2017-2028)
- 9.2 Latin America Microalgae Market Size by Application
- 9.2.1 Latin America Microalgae Sales by Application (2017-2028)
- 9.2.2 Latin America Microalgae Revenue by Application (2017-2028)
- 9.3 Latin America Microalgae Market Size by Country
- 9.3.1 Latin America Microalgae Sales by Country (2017-2028)
- 9.3.2 Latin America Microalgae Revenue by Country (2017-2028)
- 9.3.3 Mexico
- 9.3.4 Brazil
- 9.3.5 Argentina
10 MIDDLE EAST AND AFRICA
- 10.1 Middle East and Africa Microalgae Market Size by Type
- 10.1.1 Middle East and Africa Microalgae Sales by Type (2017-2028)
- 10.1.2 Middle East and Africa Microalgae Revenue by Type (2017-2028)
- 10.2 Middle East and Africa Microalgae Market Size by Application
- 10.2.1 Middle East and Africa Microalgae Sales by Application (2017-2028)
- 10.2.2 Middle East and Africa Microalgae Revenue by Application (2017-2028)
- 10.3 Middle East and Africa Microalgae Market Size by Country
- 10.3.1 Middle East and Africa Microalgae Sales by Country (2017-2028)
- 10.3.2 Middle East and Africa Microalgae Revenue by Country (2017-2028)
- 10.3.3 Turkey
- 10.3.4 Saudi Arabia
- 10.3.5 UAE
11 CORPORATE PROFILE
- 11.1 DIC Corporation
- 11.1.1 DIC Corporation Information
- 11.1.2 DIC Corporation Overview
- 11.1.3 DIC Corporation Microalgae Sales, Price, Revenue and Gross Margin (2017-2022)
- 11.1.4 DIC Corporation Microalgae Product Model Numbers, Pictures, Descriptions and Specifications
- 11.1.5 DIC Corporation Recent Developments
- 11.2 Cyanotech Corporation
- 11.2.1 Cyanotech Corporation Information
- 11.2.2 Cyanotech Corporation Overview
- 11.2.3 Cyanotech Corporation Microalgae Sales, Price, Revenue and Gross Margin (2017-2022)
- 11.2.4 Cyanotech Corporation Microalgae Product Model Numbers, Pictures, Descriptions and Specifications
- 11.2.5 Cyanotech Corporation Recent Developments
- 11.3 Algaetech Group
- 11.3.1 Algaetech Group Corporation Information
- 11.3.2 Algaetech Group Overview
- 11.3.3 Algaetech Group Microalgae Sales, Price, Revenue and Gross Margin (2017-2022)
- 11.3.4 Algaetech Group Microalgae Product Model Numbers, Pictures, Descriptions and Specifications
- 11.3.5 Algaetech Group Recent Developments
- 11.4 TAAU Australia
- 11.4.1 TAAU Australia Corporation Information
- 11.4.2 TAAU Australia Overview
- 11.4.3 TAAU Australia Microalgae Sales, Price, Revenue and Gross Margin (2017-2022)
- 11.4.4 TAAU Australia Microalgae Product Model Numbers, Pictures, Descriptions and Specifications
- 11.5 Fuqing King Dnarmsa Spirulina
- 11.5.1 Fuqing King Dnarmsa Spirulina Corporation Information
- 11.5.2 Fuqing King Dnarmsa Spirulina Overview
- 11.5.3 Fuqing King Dnarmsa Spirulina Microalgae Sales, Price, Revenue and Gross Margin (2017-2022)
- 11.5.4 Fuqing King Dnarmsa Spirulina Microalgae Product Model Numbers, Pictures, Descriptions and Specifications
- 11.6 Shengbada Biology
- 11.6.1 Shengbada Biology Corporation Information
- 11.6.2 Shengbada Biology Overview
- 11.6.3 Shengbada Biology Microalgae Sales, Price, Revenue and Gross Margin (2017-2022)
- 11.6.4 Shengbada Biology Microalgae Product Model Numbers, Pictures, Descriptions and Specifications
- 11.7 Green A Biological
- 11.7.1 Green A Biological Corporation Information
- 11.7.2 Green A Biological Overview
- 11.7.3 Green A Biological Microalgae Sales, Price, Revenue and Gross Margin (2017-2022)
- 11.7.4 Green A Biological Microalgae Product Model Numbers, Pictures, Descriptions and Specifications
- 11.8 Dongtai City Spirulina Bio-Engineering
- 11.8.1 Dongtai City Spirulina Bio-Engineering Corporation Information
- 11.8.2 Dongtai City Spirulina Bio-Engineering Overview
- 11.8.3 Dongtai City Spirulina Bio-Engineering Microalgae Sales, Price, Revenue and Gross Margin (2017-2022)
- 11.8.4 Dongtai City Spirulina Bio-Engineering Microalgae Product Model Numbers, Pictures, Descriptions and Specifications
- 11.9 Alltech
- 11.9.1 Alltech Corporation Information
- 11.9.2 Alltech Overview
- 11.9.3 Alltech Microalgae Sales, Price, Revenue and Gross Margin (2017-2022)
- 11.9.4 Alltech Microalgae Product Model Numbers, Pictures, Descriptions and Specifications
- 11.9.5 Alltech Recent Developments
- 11.10 Parry Nutraceuticals
- 11.10.1 Parry Nutraceuticals Corporation Information
- 11.10.2 Parry Nutraceuticals Overview
- 11.10.3 Parry Nutraceuticals Microalgae Sales, Price, Revenue and Gross Margin (2017-2022)
- 11.10.4 Parry Nutraceuticals Microalgae Product Model Numbers, Pictures, Descriptions and Specifications
- 11.10.5 Parry Nutraceuticals Recent Developments
- 11.11 BlueBioTech
- 11.11.1 BlueBioTech Corporation Information
- 11.11.2 BlueBioTech Overview
- 11.11.3 BlueBioTech Microalgae Sales, Price, Revenue and Gross Margin (2017-2022)
- 11.11.4 BlueBioTech Microalgae Product Model Numbers, Pictures, Descriptions and Specifications
- 11.12 Roquette
- 11.12.1 Roquette Corporation Information
- 11.12.2 Roquette Overview
- 11.12.3 Roquette Microalgae Sales, Price, Revenue and Gross Margin (2017-2022)
- 11.12.4 Roquette Microalgae Product Model Numbers, Pictures, Descriptions and Specifications
- 11.13 Allma (Allmicroalgae)
- 11.13.1 Allma (Allmicroalgae) Corporation Information
- 11.13.2 Allma (Allmicroalgae) Overview
- 11.13.3 Allma (Allmicroalgae) Microalgae Sales, Price, Revenue and Gross Margin (2017-2022)
- 11.13.4 Allma (Allmicroalgae) Microalgae Product Model Numbers, Pictures, Descriptions and Specifications
- 11.13.5 Allma (Allmicroalgae) Recent Developments
- 11.14 Global EcoPower (Cyane)
- 11.14.1 Global EcoPower (Cyane) Corporation Information
- 11.14.2 Global EcoPower (Cyane) Overview
- 11.14.3 Global EcoPower (Cyane) Microalgae Sales, Price, Revenue and Gross Margin (2017-2022)
- 11.14.4 Global EcoPower (Cyane) Microalgae Product Model Numbers, Pictures, Descriptions and Specifications
- 11.14.5 Global EcoPower (Cyane) Recent Developments
- 11.15 Archimede Ricerche
- 11.15.1 Archimede Ricerche Corporation Information
- 11.15.2 Archimede Ricerche Overview
- 11.15.3 Archimede Ricerche Microalgae Sales, Price, Revenue and Gross Margin (2017-2022)
- 11.15.4 Archimede Ricerche Microalgae Product Model Numbers, Pictures, Descriptions and Specifications
- 11.16 AlgaEnergy
- 11.16.1 AlgaEnergy Corporation Information
- 11.16.2 AlgaEnergy Overview
- 11.16.3 AlgaEnergy Microalgae Sales, Price, Revenue and Gross Margin (2017-2022)
- 11.16.4 AlgaEnergy Microalgae Product Model Numbers, Pictures, Descriptions and Specifications
- 11.16.5 AlgaEnergy Recent Developments
- 11.17 Phycom
- 11.17.1 Phycom Corporation Information
- 11.17.2 Phycom Overview
- 11.17.3 Phycom Microalgae Sales, Price, Revenue and Gross Margin (2017-2022)
- 11.17.4 Phycom Microalgae Product Model Numbers, Pictures, Descriptions and Specifications
- 11.18 Necton
- 11.18.1 Necton Corporation Information
- 11.18.2 Necton Overview
- 11.18.3 Necton Microalgae Sales, Price, Revenue and Gross Margin (2017-2022)
- 11.18.4 Necton Microalgae Product Model Numbers, Pictures, Descriptions and Specifications
- 11.19 Chenghai Bao ER
- 11.19.1 Chenghai Bao ER Corporation Information
- 11.19.2 Chenghai Bao ER Overview
- 11.19.3 Chenghai Bao ER Microalgae Sales, Price, Revenue and Gross Margin (2017-2022)
- 11.19.4 Chenghai Bao ER Microalgae Product Model Numbers, Pictures, Descriptions and Specifications
- 11.20 Dongying Haifu Biological
- 11.20.1 Dongying Haifu Biological Corporation Information
- 11.20.2 Dongying Haifu Biological Overview
- 11.20.3 Dongying Haifu Biological Microalgae Sales, Price, Revenue and Gross Margin (2017-2022)
- 11.20.4 Dongying Haifu Biological Microalgae Product Model Numbers, Pictures, Descriptions and Specifications
12 INDUSTRY CHAIN AND SALES CHANNELS ANALYSIS
- 12.1 Microalgae Industry Chain Analysis
- 12.2 Microalgae Key Raw Materials
- 12.2.1 Key Raw Materials
- 12.2.2 Raw Materials Key Suppliers
- 12.3 Microalgae Production Mode & Process
- 12.4 Microalgae Sales and Marketing
- 12.5 Microalgae Customers
13 MICROALGAE MARKET DYNAMICS
- 13.1.1 Microalgae Industry Trends
- 13.1.2 Microalgae Market Drivers
- 13.1.3 Microalgae Market Challenges
- 13.1.4 Microalgae Market Restraints
14 KEY FINDINGS IN THE GLOBAL MICROALGAE STUDY
15 APPENDIX
- 15.1 Research Methodology
- 15.1.1 Methodology/Research Approach
- 15.1.2 Data Source
- 15.2 Author Details
- 15.3 Disclaimer