|
|
市場調査レポート
商品コード
1078371
仮想発電所の市場シェア、規模、動向、業界分析:技術別、供給源別、最終用途別、地域別、セグメント予測(2022年~2030年)Virtual Power Plant Market Share, Size, Trends, Industry Analysis Report, By Technology, By Source, By End-Use, By Region, Segment Forecast, 2022 - 2030 |
||||||
|
|
|||||||
|
● お客様のご希望に応じて、既存データの加工や未掲載情報(例:国別セグメント)の追加などの対応が可能です。 詳細はお問い合わせください。 |
|||||||


| 仮想発電所の市場シェア、規模、動向、業界分析:技術別、供給源別、最終用途別、地域別、セグメント予測(2022年~2030年) |
|
出版日: 2022年04月11日
発行: Polaris Market Research
ページ情報: 英文 118 Pages
納期: 即日から翌営業日
|
- 全表示
- 概要
- 図表
- 目次
世界の仮想発電所の市場規模は、2030年までに44億7,130万米ドルに達すると予測されています。
当レポートでは、世界の仮想発電所市場を調査し、市場の概要、市場の促進要因・抑制要因の分析、市場機会、COVID-19の影響、技術別・供給源別・最終用途別・地域別の市場分析、競合情勢、主要企業のプロファイルなどの情報を提供しています。
目次
第1章 イントロダクション
- レポートの説明
- 調査の目的
- 市場範囲
- 前提条件
- 利害関係者
第2章 エグゼクティブサマリー
- 市場のハイライト
第3章 調査手法
- 概要
- データマイニング
- データソース
- 一次資料
- 二次資料
第4章 世界の仮想発電所市場の洞察
- 業界のスナップショット
- 市場力学
- 促進要因と機会
- 抑制要因と課題
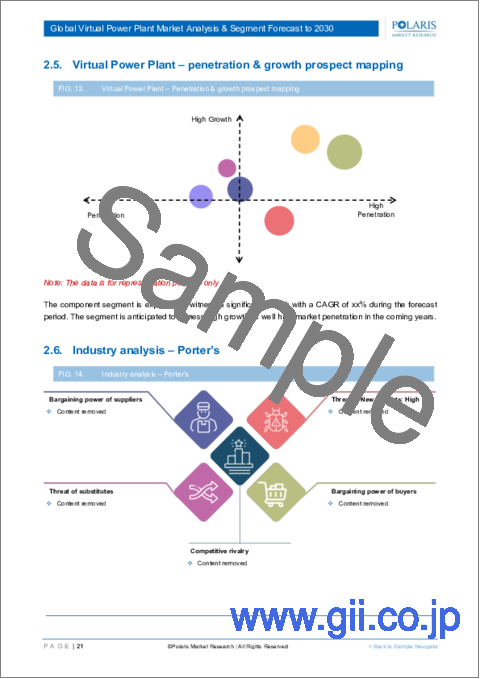
- ポーターのファイブフォース分析
- 供給企業の交渉力(中)
- 新規参入者の脅威(低)
- 買い手の交渉力(中)
- 代替の脅威(中)
- 既存企業間の競争(高)
- PESTEL分析
- 業界の動向
- バリューチェーン分析
- COVID-19の影響分析
第5章 世界の仮想発電所市場:技術別
- 主な調査結果
- イントロダクション
- 技術別(2018年~2030年)
- デマンドレスポンス
- デマンドレスポンス別、地域別(2018年~2030年)
- 分散型電源
- 分散型電源別、地域別(2018年~2030年)
- 混合資産
- 混合資産別、地域別(2018年~2030年)
第6章 世界の仮想発電所市場:供給源別
- 主な調査結果
- イントロダクション
- 供給源別(2018年~2030年)
- 太陽光
- 太陽光別、地域別(2018年~2030年)
- 風力
- 風力別、地域別(2018年~2030年)
- 小水力
- 小水力別、地域別(2018年~2030年)
- バッテリー
- バッテリー別、地域別(2018年~2030年)
- その他
- その他別、地域別(2018年~2030年)
第7章 世界の仮想発電所市場:最終用途別
- 主な調査結果
- イントロダクション
- 最終用途別(2018年~2030年)
- 産業
- 産業別、地域別(2018年~2030年)
- 商業
- 商業別、地域別(2018年~2030年)
- 住宅
- 住宅別、地域別(2018年~2030年)
第8章 世界の仮想発電所市場:地域別
- 主な調査結果
- イントロダクション
- 市場評価:地域別(2018年~2030年)
- 北米
- 技術別(2018年~2030年)
- 最終用途別(2018年~2030年)
- 供給源別(2018年~2030年)
- 米国
- カナダ
- 欧州
- 技術別(2018年~2030年)
- 最終用途別(2018年~2030年)
- 供給源別(2018年~2030年)
- 英国
- フランス
- ドイツ
- イタリア
- スペイン
- オランダ
- オーストリア
- アジア太平洋
- 技術別(2018年~2030年)
- 最終用途別(2018年~2030年)
- 供給源別(2018年~2030年)
- 中国
- インド
- マレーシア
- 日本
- インドネシア
- 韓国
- 中東・アフリカ
- 技術別(2018年~2030年)
- 最終用途別(2018年~2030年)
- 供給源別(2018年~2030年)
- サウジアラビア
- アラブ首長国連邦
- イスラエル
- 南アフリカ
- ラテンアメリカ
- 技術別(2018年~2030年)
- 最終用途別(2018年~2030年)
- 供給源別(2018年~2030年)
- メキシコ
- ブラジル
- アルゼンチン
第9章 競合情勢
- 事業拡張・企業買収の分析
- 事業拡張
- 企業買収
- パートナーシップ/コラボレーション/契約/展示会
第10章 企業プロファイル
- ABB, Ltd.
- AGL Energy
- AutoGrid
- Autogrid Systems, Inc.
- Blue Pillar, Inc.
- Cisco Systems, Inc.
- Comverge
- Cpower Energy Management
- Enbala Power Networks, Inc.
- Enel X
- Enernoc, Inc.
- Flexitricity Limited
- General Electric
- Hitachi, Ltd
- International Business Machines Corporation
- Limejump Limited
- Next Kraftwerke
- Olivene, Inc.
- Open Access Technology International, Inc.
- Osisoft
- Robert Bosch
- Schneider Electric
- Siemens
List of Tables
- Table 1 Global Virtual Power Plant Market, by Technology, 2018 - 2030 (USD Million)
- Table 2 Global Virtual Power Plant Market, by Source, 2018 - 2030 (USD Million)
- Table 3 Global Virtual Power Plant Market, by End-User, 2018 - 2030 (USD Million)
- Table 4 Virtual Power Plant Market Assessment, By Geography, 2018 - 2030 (USD Million)
- Table 5 North America: Virtual Power Plant Market, by Technology, 2018 - 2030 (USD Million)
- Table 6 North America: Virtual Power Plant Market, by Source, 2018 - 2030 (USD Million)
- Table 7 North America: Virtual Power Plant Market, by End-User, 2018 - 2030 (USD Million)
- Table 8 U.S.: Virtual Power Plant Market, by Technology, 2018 - 2030 (USD Million)
- Table 9 U.S.: Virtual Power Plant Market, by Source, 2018 - 2030 (USD Million)
- Table 10 U.S.: Virtual Power Plant Market, by End-User, 2018 - 2030 (USD Million)
- Table 11 Canada: Virtual Power Plant Market, by Technology, 2018 - 2030 (USD Million)
- Table 12 Canada: Virtual Power Plant Market, by Source, 2018 - 2030 (USD Million)
- Table 13 Canada: Virtual Power Plant Market, by End-User, 2018 - 2030 (USD Million)
- Table 14 Europe: Virtual Power Plant Market, by Technology, 2018 - 2030 (USD Million)
- Table 15 Europe: Virtual Power Plant Market, by Source, 2018 - 2030 (USD Million)
- Table 16 Europe: Virtual Power Plant Market, by End-User, 2018 - 2030 (USD Million)
- Table 17 UK: Virtual Power Plant Market, by Technology, 2018 - 2030 (USD Million)
- Table 18 UK: Virtual Power Plant Market, by Source, 2018 - 2030 (USD Million)
- Table 19 UK: Virtual Power Plant Market, by End-User, 2018 - 2030 (USD Million)
- Table 20 France: Virtual Power Plant Market, by Technology, 2018 - 2030 (USD Million)
- Table 21 France: Virtual Power Plant Market, by Source, 2018 - 2030 (USD Million)
- Table 22 France: Virtual Power Plant Market, by End-User, 2018 - 2030 (USD Million)
- Table 23 Germany: Virtual Power Plant Market, by Technology, 2018 - 2030 (USD Million)
- Table 24 Germany: Virtual Power Plant Market, by Source, 2018 - 2030 (USD Million)
- Table 25 Germany: Virtual Power Plant Market, by End-User, 2018 - 2030 (USD Million)
- Table 26 Italy: Virtual Power Plant Market, by Technology, 2018 - 2030 (USD Million)
- Table 27 Italy: Virtual Power Plant Market, by Source, 2018 - 2030 (USD Million)
- Table 28 Italy: Virtual Power Plant Market, by End-User, 2018 - 2030 (USD Million)
- Table 29 Spain: Virtual Power Plant Market, by Technology, 2018 - 2030 (USD Million)
- Table 30 Spain: Virtual Power Plant Market, by Source, 2018 - 2030 (USD Million)
- Table 31 Spain: Virtual Power Plant Market, by End-User, 2018 - 2030 (USD Million)
- Table 32 Netherlands: Virtual Power Plant Market, by Technology, 2018 - 2030 (USD Million)
- Table 33 Netherlands: Virtual Power Plant Market, by Source, 2018 - 2030 (USD Million)
- Table 34 Netherlands: Virtual Power Plant Market, by End-User, 2018 - 2030 (USD Million)
- Table 35 Austria: Virtual Power Plant Market, by Technology, 2018 - 2030 (USD Million)
- Table 36 Austria: Virtual Power Plant Market, by Source, 2018 - 2030 (USD Million)
- Table 37 Austria: Virtual Power Plant Market, by End-User, 2018 - 2030 (USD Million)
- Table 38 Asia Pacific: Virtual Power Plant Market, by Technology, 2018 - 2030 (USD Million)
- Table 39 Asia Pacific: Virtual Power Plant Market, by Source, 2018 - 2030 (USD Million)
- Table 40 Asia Pacific: Virtual Power Plant Market, by End-User, 2018 - 2030 (USD Million)
- Table 41 China: Virtual Power Plant Market, by Technology, 2018 - 2030 (USD Million)
- Table 42 China: Virtual Power Plant Market, by Source, 2018 - 2030 (USD Million)
- Table 43 China: Virtual Power Plant Market, by End-User, 2018 - 2030 (USD Million)
- Table 44 India: Virtual Power Plant Market, by Technology, 2018 - 2030 (USD Million)
- Table 45 India: Virtual Power Plant Market, by Source, 2018 - 2030 (USD Million)
- Table 46 India: Virtual Power Plant Market, by End-User, 2018 - 2030 (USD Million)
- Table 47 Malaysia: Virtual Power Plant Market, by Technology, 2018 - 2030 (USD Million)
- Table 48 Malaysia: Virtual Power Plant Market, by Source, 2018 - 2030 (USD Million)
- Table 49 Malaysia: Virtual Power Plant Market, by End-User, 2018 - 2030 (USD Million)
- Table 50 Japan: Virtual Power Plant Market, by Technology, 2018 - 2030 (USD Million)
- Table 51 Japan: Virtual Power Plant Market, by Source, 2018 - 2030 (USD Million)
- Table 52 Japan: Virtual Power Plant Market, by End-User, 2018 - 2030 (USD Million)
- Table 53 Indonesia: Virtual Power Plant Market, by Technology, 2018 - 2030 (USD Million)
- Table 54 Indonesia: Virtual Power Plant Market, by Source, 2018 - 2030 (USD Million)
- Table 55 Indonesia: Virtual Power Plant Market, by End-User, 2018 - 2030 (USD Million)
- Table 56 South Korea: Virtual Power Plant Market, by Technology, 2018 - 2030 (USD Million)
- Table 57 South Korea: Virtual Power Plant Market, by Source, 2018 - 2030 (USD Million)
- Table 58 South Korea: Virtual Power Plant Market, by End-User, 2018 - 2030 (USD Million)
- Table 59 Middle East & Africa: Virtual Power Plant Market, by Technology, 2018 - 2030 (USD Million)
- Table 60 Middle East & Africa: Virtual Power Plant Market, by Source, 2018 - 2030 (USD Million)
- Table 61 Middle East & Africa: Virtual Power Plant Market, by End-User, 2018 - 2030 (USD Million)
- Table 62 Saudi Arabia: Virtual Power Plant Market, by Technology, 2018 - 2030 (USD Million)
- Table 63 Saudi Arabia: Virtual Power Plant Market, by Source, 2018 - 2030 (USD Million)
- Table 64 Saudi Arabia: Virtual Power Plant Market, by End-User, 2018 - 2030 (USD Million)
- Table 65 UAE: Virtual Power Plant Market, by Technology, 2018 - 2030 (USD Million)
- Table 66 UAE: Virtual Power Plant Market, by Source, 2018 - 2030 (USD Million)
- Table 67 UAE: Virtual Power Plant Market, by End-User, 2018 - 2030 (USD Million)
- Table 68 Israel: Virtual Power Plant Market, by Technology, 2018 - 2030 (USD Million)
- Table 69 Israel: Virtual Power Plant Market, by Source, 2018 - 2030 (USD Million)
- Table 70 Israel: Virtual Power Plant Market, by End-User, 2018 - 2030 (USD Million)
- Table 71 South Africa: Virtual Power Plant Market, by Technology, 2018 - 2030 (USD Million)
- Table 72 South Africa: Virtual Power Plant Market, by Source, 2018 - 2030 (USD Million)
- Table 73 South Africa: Virtual Power Plant Market, by End-User, 2018 - 2030 (USD Million)
- Table 74 Latin America: Virtual Power Plant Market, by Technology, 2018 - 2030 (USD Million)
- Table 75 Latin America: Virtual Power Plant Market, by Source, 2018 - 2030 (USD Million)
- Table 76 Latin America: Virtual Power Plant Market, by End-User, 2018 - 2030 (USD Million)
- Table 77 Mexico: Virtual Power Plant Market, by Technology, 2018 - 2030 (USD Million)
- Table 78 Mexico: Virtual Power Plant Market, by Source, 2018 - 2030 (USD Million)
- Table 79 Mexico: Virtual Power Plant Market, by End-User, 2018 - 2030 (USD Million)
- Table 80 Brazil: Virtual Power Plant Market, by Technology, 2018 - 2030 (USD Million)
- Table 81 Brazil: Virtual Power Plant Market, by Source, 2018 - 2030 (USD Million)
- Table 82 Brazil: Virtual Power Plant Market, by End-User, 2018 - 2030 (USD Million)
- Table 83 Argentina: Virtual Power Plant Market, by Technology, 2018 - 2030 (USD Million)
- Table 84 Argentina: Virtual Power Plant Market, by Source, 2018 - 2030 (USD Million)
- Table 85 Argentina: Virtual Power Plant Market, by End-User, 2018 - 2030 (USD Million)
List of Figures
- Figure 1. Global Virtual Power Plant Market, 2018 - 2030 (USD Million)
- Figure 2. Integrated Ecosystem
- Figure 3. Research Methodology: Top-Down & Bottom-Up Approach
- Figure 4. Market by Geography
- Figure 5. Porter's Five Forces
- Figure 6. Market by Source
- Figure 7. Global Virtual Power Plant Market, by Source, 2021 & 2030 (USD Million)
- Figure 8. Market by Technology
- Figure 9. Global Virtual Power Plant Market, by Technology, 2021 & 2030 (USD Million)
- Figure 10. Market by End-User
- Figure 11. Global Virtual Power Plant Market, by End-User, 2021 & 2030 (USD Million)
- Figure 12. Virtual Power Plant Market Assessment, By Geography, 2018 - 2030 (USD Million)
- Figure 13. Strategic Analysis - Virtual Power Plant Market
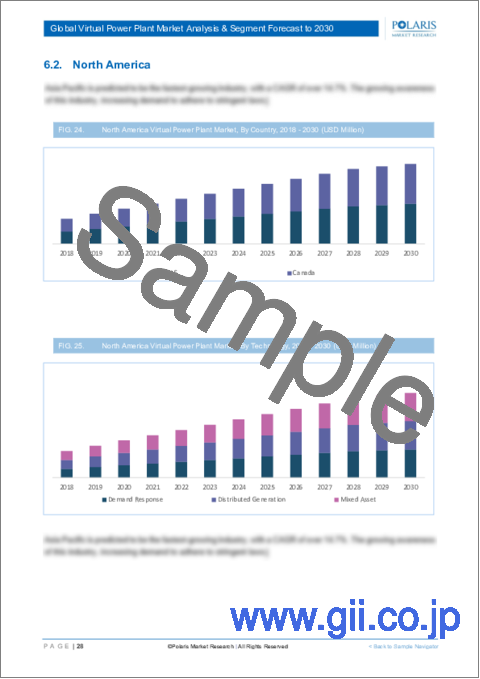
The global virtual power plant market size is expected to reach USD 4,471.30 Million by 2030, according to a new study by Polaris Market Research. The report "Virtual Power Plant Market Share, Size, Trends, Industry Analysis Report, By Technology (Demand Response, Distributed Generation, Mixed Asset); By Source (Solar, Wind, Small Hydro, Batteries, Others); By End-Use (Industrial, Commercial, Residential); By Region; Segment Forecast, 2022 - 2030" gives a detailed insight into current market dynamics and provides analysis on future market growth.
The major factors that boost the industry growth include its benefits for energy generation, expansion of smart grids, and growing demand for renewable energy. Virtual energy plants are used to maximize energy generation from existing sources, incorporate multiple renewable energy sources, and, as a result, reduce carbon emissions.
Any expansion of the smart grid would directly impact the virtual energy plant business. Furthermore, factors such as a growing share of renewable energy in the energy generation mix and falling solar generation and energy storage prices are expected to increase the virtual power plant business.
Based on the technology, the demand response segment accounted for the leading share in the industry in 2021. Due to increased expenditures in demand-response systems, the demand response category is expected to hold the most significant market share. Its popularity is fast growing due to its long-term benefits for end-users and capacity to improve the grid's energy efficiency. It also offers perks like peak load control and the chance to earn prizes by engaging in demand response programs.
Market players such as International Business Machines Corporation, General Electric, AGL Energy, ABB, Schneider Electric, Siemens. AutoGrid, Blue Pillar, Inc., Enbala Power Networks, Inc., Next Kraftwerke., Enel X, Cisco Systems, Inc., Hitachi, Ltd., Robert Bosch GmbH are key players operating in the global market.
In November 2021, SunPower Corp., a leading solar technology and energy services company, has announced the opening of its Virtual Power Plant (VPP) solution, which allows SunVaultTM energy storage consumers to be compensated for allowing the versatility to use stored energy throughout peak demand, resulting in a more stable electric grid in their community. Thus, these strategies adopted by the major players are boosting market growth.
Polaris Market Research has segmented the virtual power plant market report based on technology, source, end-user, and region:
Virtual Power Plant, Technology Outlook (Revenue - USD Million, 2018 - 2030)
Demand Response
Distributed Generation
Mixed Asset
Virtual Power Plant, Source Outlook (Revenue - USD Million, 2018 - 2030)
Solar
Wind
Small Hydro
Batteries
Others
Virtual Power Plant, End-User Outlook (Revenue - USD Million, 2018 - 2030)
Industrial
Commercial
Residential
Virtual Power Plant, Regional Outlook (Revenue - USD Million, 2018 - 2030)
North America
U.S.
Canada
Europe
France
Germany
UK
Italy
Netherlands
Spain
Austria
Asia Pacific
China
India
Japan
Malaysia
South Korea
Indonesia
Latin America
Mexico
Brazil
Argentina
Middle East & Africa
UAE
Saudi Arabia
Israel
South Africa
Table of Contents
1. Introduction
- 1.1. Report Description
- 1.1.1. Objectives of the Study
- 1.1.2. Market Scope
- 1.1.3. Assumptions
- 1.2. Stakeholders
2. Executive Summary
- 2.1. Market Highlights
3. Research Methodology
- 3.1. Overview
- 3.1.1. Data Mining
- 3.2. Data Sources
- 3.2.1. Primary Sources
- 3.2.2. Secondary Sources
4. Global Virtual Power Plant Market Insights
- 4.1. Virtual Power Plant - Industry Snapshot
- 4.2. Virtual Power Plant Market Dynamics
- 4.2.1. Drivers and Opportunities
- 4.2.1.1. Increasing share of renewable energy in the power generation mix
- 4.2.1.2. Shift from centralized to distributed generation
- 4.2.2. Restraints and Challenges
- 4.2.2.1. Health safety concerns regarding electromagnetic frequency (EMF) & radio frequency (RF) exposure
- 4.2.1. Drivers and Opportunities
- 4.3. Porter's Five Forces Analysis
- 4.3.1. Bargaining Power of Suppliers (Moderate)
- 4.3.2. Threats of New Entrants: (Low)
- 4.3.3. Bargaining Power of Buyers (Moderate)
- 4.3.4. Threat of Substitute (Moderate)
- 4.3.5. Rivalry among existing firms (High)
- 4.4. PESTEL Analysis
- 4.5. Virtual Power Plant Market Industry Trends
- 4.6. Value Chain Analysis
- 4.7. COVID-19 Impact Analysis
5. Global Virtual Power Plant Market, by Technology
- 5.1. Key Findings
- 5.2. Introduction
- 5.2.1. Global Virtual Power Plant Market, by Technology, 2018 - 2030 (USD Million)
- 5.3. Demand Response
- 5.3.1. Global Virtual Power Plant Market, by Demand Response, by Region, 2018 - 2030 (USD Million)
- 5.4. Distributed Generation
- 5.4.1. Global Virtual Power Plant Market, by Distributed Generation, by Region, 2018 - 2030 (USD Million)
- 5.5. Mixed Asset
- 5.5.1. Global Virtual Power Plant Market, by Mixed Asset, by Region, 2018 - 2030 (USD Million)
6. Global Virtual Power Plant Market, by Source
- 6.1. Key Findings
- 6.2. Introduction
- 6.2.1. Global Virtual Power Plant Market, by Source, 2018 - 2030 (USD Million)
- 6.3. Solar
- 6.3.1. Global Virtual Power Plant Market, by Solar, by Region, 2018 - 2030 (USD Million)
- 6.4. Wind
- 6.4.1. Global Virtual Power Plant Market, by Wind, by Region, 2018 - 2030 (USD Million)
- 6.5. Small Hydro
- 6.5.1. Global Virtual Power Plant Market, by Small Hydro, by Region, 2018 - 2030 (USD Million)
- 6.6. Batteries
- 6.6.1. Global Virtual Power Plant Market, by Batteries, by Region, 2018 - 2030 (USD Million)
- 6.7. Others
- 6.7.1. Global Virtual Power Plant Market, by Others, by Region, 2018 - 2030 (USD Million)
7. Global Virtual Power Plant Market, by End-User
- 7.1. Key Findings
- 7.2. Introduction
- 7.2.1. Global Virtual Power Plant Market, by End-User, 2018 - 2030 (USD Million)
- 7.3. Industrial
- 7.3.1. Global Virtual Power Plant Market, by Industrial, by Region, 2018 - 2030 (USD Million)
- 7.4. Commercial
- 7.4.1. Global Virtual Power Plant Market, by Commercial, by Region, 2018 - 2030 (USD Million)
- 7.5. Residential
- 7.5.1. Global Virtual Power Plant Market, by Residential, by Region, 2018 - 2030 (USD Million)
8. Global Virtual Power Plant Market, by Geography
- 8.1. Key findings
- 8.2. Introduction
- 8.2.1. Virtual Power Plant Market Assessment, By Geography, 2018 - 2030 (USD Million)
- 8.3. Virtual Power Plant Market - North America
- 8.3.1. North America: Virtual Power Plant Market, by Technology, 2018 - 2030 (USD Million)
- 8.3.2. North America: Virtual Power Plant Market, by End-User, 2018 - 2030 (USD Million)
- 8.3.3. North America: Virtual Power Plant Market, by Source, 2018 - 2030 (USD Million)
- 8.3.4. Virtual Power Plant Market - U.S.
- 8.3.4.1. U.S.: Virtual Power Plant Market, by Technology, 2018 - 2030 (USD Million)
- 8.3.4.2. U.S.: Virtual Power Plant Market, by End-User, 2018 - 2030 (USD Million)
- 8.3.4.3. U.S.: Virtual Power Plant Market, by Source, 2018 - 2030 (USD Million)
- 8.3.5. Virtual Power Plant Market - Canada
- 8.3.5.1. Canada: Virtual Power Plant Market, by Technology, 2018 - 2030 (USD Million)
- 8.3.5.2. Canada.: Virtual Power Plant Market, by End-User, 2018 - 2030 (USD Million)
- 8.3.5.3. Canada: Virtual Power Plant Market, by Source, 2018 - 2030 (USD Million)
- 8.4. Virtual Power Plant Market - Europe
- 8.4.1. Europe: Virtual Power Plant Market, by Technology, 2018 - 2030 (USD Million)
- 8.4.2. Europe.: Virtual Power Plant Market, by End-User, 2018 - 2030 (USD Million)
- 8.4.3. Europe: Virtual Power Plant Market, by Source, 2018 - 2030 (USD Million)
- 8.4.4. Virtual Power Plant Market - UK
- 8.4.4.1. UK: Virtual Power Plant Market, by Technology, 2018 - 2030 (USD Million)
- 8.4.4.2. UK.: Virtual Power Plant Market, by End-User, 2018 - 2030 (USD Million)
- 8.4.4.3. UK: Virtual Power Plant Market, by Source, 2018 - 2030 (USD Million)
- 8.4.5. Virtual Power Plant Market - France
- 8.4.5.1. France: Virtual Power Plant Market, by Technology, 2018 - 2030 (USD Million)
- 8.4.5.2. France.: Virtual Power Plant Market, by End-User, 2018 - 2030 (USD Million)
- 8.4.5.3. France: Virtual Power Plant Market, by Source, 2018 - 2030 (USD Million)
- 8.4.6. Virtual Power Plant Market - Germany
- 8.4.6.1. Germany: Virtual Power Plant Market, by Technology, 2018 - 2030 (USD Million)
- 8.4.6.2. Germany.: Virtual Power Plant Market, by End-User, 2018 - 2030 (USD Million)
- 8.4.6.3. Germany: Virtual Power Plant Market, by Source, 2018 - 2030 (USD Million)
- 8.4.7. Virtual Power Plant Market - Italy
- 8.4.7.1. Italy: Virtual Power Plant Market, by Technology, 2018 - 2030 (USD Million)
- 8.4.7.2. Italy.: Virtual Power Plant Market, by End-User, 2018 - 2030 (USD Million)
- 8.4.7.3. Italy: Virtual Power Plant Market, by Source, 2018 - 2030 (USD Million)
- 8.4.8. Virtual Power Plant Market - Spain
- 8.4.8.1. Spain: Virtual Power Plant Market, by Technology, 2018 - 2030 (USD Million)
- 8.4.8.2. Spain.: Virtual Power Plant Market, by End-User, 2018 - 2030 (USD Million)
- 8.4.8.3. Spain: Virtual Power Plant Market, by Source, 2018 - 2030 (USD Million)
- 8.4.9. Virtual Power Plant Market - Netherlands
- 8.4.9.1. Netherlands: Virtual Power Plant Market, by Technology, 2018 - 2030 (USD Million)
- 8.4.9.2. Netherlands.: Virtual Power Plant Market, by End-User, 2018 - 2030 (USD Million)
- 8.4.9.3. Netherlands: Virtual Power Plant Market, by Source, 2018 - 2030 (USD Million)
- 8.4.10. Virtual Power Plant Market - Austria
- 8.4.10.1. Austria: Virtual Power Plant Market, by Technology, 2018 - 2030 (USD Million)
- 8.4.10.2. Austria.: Virtual Power Plant Market, by End-User, 2018 - 2030 (USD Million)
- 8.4.10.3. Austria: Virtual Power Plant Market, by Source, 2018 - 2030 (USD Million)
- 8.5. Virtual Power Plant Market - Asia Pacific
- 8.5.1. Asia Pacific: Virtual Power Plant Market, by Technology, 2018 - 2030 (USD Million)
- 8.5.2. Asia Pacific.: Virtual Power Plant Market, by End-User, 2018 - 2030 (USD Million)
- 8.5.3. Asia Pacific: Virtual Power Plant Market, by Source, 2018 - 2030 (USD Million)
- 8.5.4. Virtual Power Plant Market - China
- 8.5.4.1. China: Virtual Power Plant Market, by Technology, 2018 - 2030 (USD Million)
- 8.5.4.2. China.: Virtual Power Plant Market, by End-User, 2018 - 2030 (USD Million)
- 8.5.4.3. China: Virtual Power Plant Market, by Source, 2018 - 2030 (USD Million)
- 8.5.5. Virtual Power Plant Market - India
- 8.5.5.1. India: Virtual Power Plant Market, by Technology, 2018 - 2030 (USD Million)
- 8.5.5.2. India.: Virtual Power Plant Market, by End-User, 2018 - 2030 (USD Million)
- 8.5.5.3. India: Virtual Power Plant Market, by Source, 2018 - 2030 (USD Million)
- 8.5.6. Virtual Power Plant Market - Malaysia
- 8.5.6.1. Malaysia: Virtual Power Plant Market, by Technology, 2018 - 2030 (USD Million)
- 8.5.6.2. Malaysia.: Virtual Power Plant Market, by End-User, 2018 - 2030 (USD Million)
- 8.5.6.3. Malaysia: Virtual Power Plant Market, by Source, 2018 - 2030 (USD Million)
- 8.5.7. Virtual Power Plant Market - Japan
- 8.5.7.1. Japan: Virtual Power Plant Market, by Technology, 2018 - 2030 (USD Million)
- 8.5.7.2. Japan.: Virtual Power Plant Market, by End-User, 2018 - 2030 (USD Million)
- 8.5.7.3. Japan: Virtual Power Plant Market, by Source, 2018 - 2030 (USD Million)
- 8.5.8. Virtual Power Plant Market - Indonesia
- 8.5.8.1. Indonesia: Virtual Power Plant Market, by Technology, 2018 - 2030 (USD Million)
- 8.5.8.2. Indonesia.: Virtual Power Plant Market, by End-User, 2018 - 2030 (USD Million)
- 8.5.8.3. Indonesia: Virtual Power Plant Market, by Source, 2018 - 2030 (USD Million)
- 8.5.9. Virtual Power Plant Market - South Korea
- 8.5.9.1. South Korea: Virtual Power Plant Market, by Technology, 2018 - 2030 (USD Million)
- 8.5.9.2. South Korea.: Virtual Power Plant Market, by End-User, 2018 - 2030 (USD Million)
- 8.5.9.3. South Korea: Virtual Power Plant Market, by Source, 2018 - 2030 (USD Million)
- 8.6. Virtual Power Plant Market - Middle East & Africa
- 8.6.1. Middle East & Africa: Virtual Power Plant Market, by Technology, 2018 - 2030 (USD Million)
- 8.6.2. Middle East & Africa.: Virtual Power Plant Market, by End-User, 2018 - 2030 (USD Million)
- 8.6.3. Middle East & Africa: Virtual Power Plant Market, by Source, 2018 - 2030 (USD Million)
- 8.6.4. Virtual Power Plant Market - Saudi Arabia
- 8.6.4.1. Saudi Arabia: Virtual Power Plant Market, by Technology, 2018 - 2030 (USD Million)
- 8.6.4.2. Saudi Arabia.: Virtual Power Plant Market, by End-User, 2018 - 2030 (USD Million)
- 8.6.4.3. Saudi Arabia: Virtual Power Plant Market, by Source, 2018 - 2030 (USD Million)
- 8.6.5. Virtual Power Plant Market - UAE
- 8.6.5.1. UAE: Virtual Power Plant Market, by Technology, 2018 - 2030 (USD Million)
- 8.6.5.2. UAE.: Virtual Power Plant Market, by End-User, 2018 - 2030 (USD Million)
- 8.6.5.3. UAE: Virtual Power Plant Market, by Source, 2018 - 2030 (USD Million)
- 8.6.6. Virtual Power Plant Market - Israel
- 8.6.6.1. Israel: Virtual Power Plant Market, by Technology, 2018 - 2030 (USD Million)
- 8.6.6.2. Israel.: Virtual Power Plant Market, by End-User, 2018 - 2030 (USD Million)
- 8.6.6.3. Israel: Virtual Power Plant Market, by Source, 2018 - 2030 (USD Million)
- 8.6.7. Virtual Power Plant Market - South Africa
- 8.6.7.1. South Africa: Virtual Power Plant Market, by Technology, 2018 - 2030 (USD Million)
- 8.6.7.2. South Africa.: Virtual Power Plant Market, by End-User, 2018 - 2030 (USD Million)
- 8.6.7.3. South Africa: Virtual Power Plant Market, by Source, 2018 - 2030 (USD Million)
- 8.7. Virtual Power Plant Market - Latin America
- 8.7.1. Latin America: Virtual Power Plant Market, by Technology, 2018 - 2030 (USD Million)
- 8.7.2. Latin America.: Virtual Power Plant Market, by End-User, 2018 - 2030 (USD Million)
- 8.7.3. Latin America: Virtual Power Plant Market, by Source, 2018 - 2030 (USD Million)
- 8.7.4. Virtual Power Plant Market - Mexico
- 8.7.4.1. Mexico: Virtual Power Plant Market, by Technology, 2018 - 2030 (USD Million)
- 8.7.4.2. Mexico.: Virtual Power Plant Market, by End-User, 2018 - 2030 (USD Million)
- 8.7.4.3. Mexico: Virtual Power Plant Market, by Source, 2018 - 2030 (USD Million)
- 8.7.5. Virtual Power Plant Market - Brazil
- 8.7.5.1. Brazil: Virtual Power Plant Market, by Technology, 2018 - 2030 (USD Million)
- 8.7.5.2. Brazil.: Virtual Power Plant Market, by End-User, 2018 - 2030 (USD Million)
- 8.7.5.3. Brazil: Virtual Power Plant Market, by Source, 2018 - 2030 (USD Million)
- 8.7.6. Virtual Power Plant Market - Argentina
- 8.7.6.1. Argentina: Virtual Power Plant Market, by Technology, 2018 - 2030 (USD Million)
- 8.7.6.2. Argentina.: Virtual Power Plant Market, by End-User, 2018 - 2030 (USD Million)
- 8.7.6.3. Argentina: Virtual Power Plant Market, by Source, 2018 - 2030 (USD Million)
9. Competitive Landscape
- 9.1. Expansion and Acquisition Analysis
- 9.1.1. Expansion
- 9.1.2. Acquisitions
- 9.2. Partnerships/Collaborations/Agreements/Exhibitions
10. Company Profiles
- 10.1. ABB, Ltd.
- 10.1.1. Company Overview
- 10.1.2. Financial Performance
- 10.1.3. Product Benchmarking
- 10.1.4. Recent Development
- 10.2. AGL Energy
- 10.2.1. Company Overview
- 10.2.2. Financial Performance
- 10.2.3. Product Benchmarking
- 10.2.4. Recent Development
- 10.3. AutoGrid
- 10.3.1. Company Overview
- 10.3.2. Financial Performance
- 10.3.3. Product Benchmarking
- 10.3.4. Recent Development
- 10.4. Autogrid Systems, Inc.
- 10.4.1. Company Overview
- 10.4.2. Financial Performance
- 10.4.3. Product Benchmarking
- 10.4.4. Recent Development
- 10.5. Blue Pillar, Inc.
- 10.5.1. Company Overview
- 10.5.2. Financial Performance
- 10.5.3. Product Benchmarking
- 10.5.4. Recent Development
- 10.6. Cisco Systems, Inc.
- 10.6.1. Company Overview
- 10.6.2. Financial Performance
- 10.6.3. Product Benchmarking
- 10.6.4. Recent Development
- 10.7. Comverge
- 10.7.1. Company Overview
- 10.7.2. Financial Performance
- 10.7.3. Product Benchmarking
- 10.7.4. Recent Development
- 10.8. Cpower Energy Management
- 10.8.1. Company Overview
- 10.8.2. Financial Performance
- 10.8.3. Product Benchmarking
- 10.8.4. Recent Development
- 10.9. Enbala Power Networks, Inc.
- 10.9.1. Company Overview
- 10.9.2. Financial Performance
- 10.9.3. Product Benchmarking
- 10.9.4. Recent Development
- 10.10. Enel X
- 10.10.1. Company Overview
- 10.10.2. Financial Performance
- 10.10.3. Product Benchmarking
- 10.10.4. Recent Development
- 10.11. Enernoc, Inc.
- 10.11.1. Company Overview
- 10.11.2. Financial Performance
- 10.11.3. Product Benchmarking
- 10.11.4. Recent Development
- 10.12. Flexitricity Limited
- 10.12.1. Company Overview
- 10.12.2. Financial Performance
- 10.12.3. Product Benchmarking
- 10.12.4. Recent Development
- 10.13. General Electric
- 10.13.1. Company Overview
- 10.13.2. Financial Performance
- 10.13.3. Product Benchmarking
- 10.13.4. Recent Development
- 10.14. Hitachi, Ltd
- 10.14.1. Company Overview
- 10.14.2. Financial Performance
- 10.14.3. Product Benchmarking
- 10.14.4. Recent Development
- 10.15. International Business Machines Corporation
- 10.15.1. Company Overview
- 10.15.2. Financial Performance
- 10.15.3. Product Benchmarking
- 10.15.4. Recent Development
- 10.16. Limejump Limited
- 10.16.1. Company Overview
- 10.16.2. Financial Performance
- 10.16.3. Product Benchmarking
- 10.16.4. Recent Development
- 10.17. Next Kraftwerke
- 10.17.1. Company Overview
- 10.17.2. Financial Performance
- 10.17.3. Product Benchmarking
- 10.17.4. Recent Development
- 10.18. Olivene, Inc.
- 10.18.1. Company Overview
- 10.18.2. Financial Performance
- 10.18.3. Product Benchmarking
- 10.18.4. Recent Development
- 10.19. Open Access Technology International, Inc.
- 10.19.1. Company Overview
- 10.19.2. Financial Performance
- 10.19.3. Product Benchmarking
- 10.19.4. Recent Development
- 10.20. Osisoft
- 10.20.1. Company Overview
- 10.20.2. Financial Performance
- 10.20.3. Product Benchmarking
- 10.20.4. Recent Development
- 10.21. Robert Bosch
- 10.21.1. Company Overview
- 10.21.2. Financial Performance
- 10.21.3. Product Benchmarking
- 10.21.4. Recent Development
- 10.22. Schneider Electric
- 10.22.1. Company Overview
- 10.22.2. Financial Performance
- 10.22.3. Product Benchmarking
- 10.22.4. Recent Development
- 10.23. Siemens
- 10.23.1. Company Overview
- 10.23.2. Financial Performance
- 10.23.3. Product Benchmarking
- 10.23.4. Recent Development