 |
市場調査レポート
商品コード
1364092
非GEOコンステレーション分析ツールキット4.0Non-Geo Constellations Analysis Toolkit 4.0 |
||||||

| 非GEOコンステレーション分析ツールキット4.0 |
|
出版日: 2023年10月17日
発行: Northern Sky Research, LLC
ページ情報: 英文
納期: 即日から翌営業日
|
- 全表示
- 概要
- 目次
当ツールキットは、以前のスプレッドシートバージョンよりも多くの機能とパワーを備えたオンラインウェブアプリケーションです。NCAT4プラットフォームは、独自の変数とフィルタを持つ、正確な計算が可能な複数のツールを提供し、ユーザーは地図、チャート、インフォグラフィックス、エクスポート可能なデータセットなどでこれらを視覚化することができます。
フルツールキット
- 3四半期ごとのアップデートNCATアプリ
- デイリーアップデート:データソース
この製品の提供内容は以下の通りです:
- 1年間のマルチユーザーアクセス:すべてのツールキット機能・ソフトウェアアップグレード・データベース更新
- 12のコンボツール:(いくつかのツールはダイナミックなツールに統合されています)
- デイリーアップデート:運用中の衛星および航空会社の飛行ルートの軌道観測
- 四半期アップデート:NCATソフトウェアの更新とデータベースの更新
- 国別ズームイン分析:200以上の国と地域
- 商用フライトデータとの統合:機内接続の需給ダイナミクスのシミュレーション (数千の航空会社および空港を選択可能)
目次
ツールキットユーザーガイド (PDF)
構成/設定メニュー
NCAT4データベースから最新のデータをダウンロードしてテーブルで表示するWebページ (プライベートNCATメニューでクリック可能)。ユーザーは、パーソナライズされた分析のために特定のサブコンステレーションおよびゲートウェイステーションを選択 (チェック) および編集できます。
- 選択・編集可能なコンステレーションシェルを含むデータベーステーブル
- テーブルの列:シェルID、システム名、高度、軌道傾斜角、軌道面、面ごとの衛星数、最小仰角- ユーザー端末、最小仰角- ゲートウェイアンテナ、ISL
- 選択・編集可能なゲートウェイステーションのリストを含むデータベーステーブル:
- ゲートウェイID、オペレータ、システム、GW名、緯度、経度、アンテナ、アンテナサイズ、送信元
- ベンチマークチャート
計算ツール
さまざまなニーズに対応する計算機と視覚化ツールが表示されたページ。ユーザーはインプットを少し編集するだけで一般的なメトリクスを迅速に駆動できます。
- コンステレーションの特徴
- インプット:コンステレーション名、軌道傾斜角、最小仰角- ユーザーアンテナ/端末、最小仰角- ゲートウェイステーションアンテナ、衛星高度
- アウトプット:軌道半径、飛行速度、角速度、軌道周期、最大速度ハンドオフ間の時間 (パスタイム)、最小衛星ハンドオフ率
- コンステレーションで覆われた地球の部分
- 衛星フットプリントで到達できる最大緯度 (南・北)
- コンステレーションが覆う地球表面の部分
- カバーされた表面積:(最大緯度の北緯と南緯の間)
- カバーされない表面積:到達できる最大緯度 (南・北)
- 衛星のフットプリント
- 各衛星でカバーされる最小表面積 (フットプリント)
- コンステレーションの衛星の数
- 衛星の最小カバー角度 (地球中心から)
- 衛星のカバー範囲半径
- 距離と遅延:地球から衛星まで
- 衛星と地上局の間の最小距離
- 最小往復遅延
- 最大衛星・地上局距離- ユーザー端末
- 最大衛星・地上局距離- GWステーション
- GWとUT間の最大往復遅延 (両方とも最小角度)
- インフォグラフィックジェネレーター
- 電卓または設定メニューでチェックしたシェルリストからデータをインプットします
- 選択可能なインフォグラフィックの背景画像
- マップビューア
- 点、線、多角形のgeoJSONデータ回収
- セルインデックスと解像度インプットに基づく六角形グリッドビューア
視程ツール
周回衛星とマルチシェルコンステレーションの視程メトリクスを動的に計算して表示するように設計されたツール。衛星をリアルタイムで表示し、複数軌道、マルチプレイヤー分析をサポートします。設定メニューで選択された各サブコンステレーション (シェル) は、個別の色で表示されます。ツールのアウトプットには、マップのズームレベルに基づいたサイトの線上にある衛星の計算、ユーザー定義の端末位置の可視衛星のタイムライン (クリック可能) 、端末 (UT) の「ルックアングル」を計算するための「衛星トラッカー」が含まれます (方位/仰角)
- シミュレーション速度コントロール:時間コントロール (早戻し、逆方向、再生/一時停止、早送り、早送り、リセットタイムボタン) 、シミュレーションスピードアクセラレータ (リアルタイム、60X、300X、カスタム速度)
- 表示コントロール:衛星、衛星FoV 、GWおよび可視衛星、UTおよび可視衛星、海底ファイバーケーブル (無効/機能使用) 、サービス可能エリア (色の強度) 、到達範囲輪郭 (リアルタイム、最大到達距離、連続リーチ)
- UT衛星の選択:最適なルックアングル、最小の遅延、最小ハンドオフレート
- オプション:衛星GW可視性を含める/無視する
- アウトプット:コンステレーションのマップアニメーション (シングルシェルおよびマルチシェル)
- ユーザー端末から見える衛星のタイムラインチャート (2)
- 設定されたユーザー端末のアンテナルックアングル (方位角と仰角) を示す「Sat Tracker」チャート (2)
- ダウンロード可能なCSVファイルとデータ列
- コンステレーションデータ:タイムスタンプ(UTC)、衛星名、衛星緯度、衛星経度、高度[km]、傾斜[度]、ECI位置:X、ECI位置:Y、ECI位置:Z、公転周期[分]、平均運動[度/分]、1 日あたりの回転数、離心率、GeoJson 形式の視野 (FoV) リング
- 見通し内 (LoS) 衛星:緯度、ロス最大衛星数、ロス平均衛星数、ロス最小衛星数
- 衛星トラッカー:タイムスタンプ (UTC)、可視衛星、衛星方位角、衛星高度、リンク用に選択された衛星
- 可視衛星タイムライン
遅延ツール
衛星および地上のエンドツーエンドのリンク遅延をリアルタイムでベンチマークするツール。このツールは、衛星間リンク (ISL/OISL) を使用してコンステレーションまたはサブコンステレーションを評価するために設計されています。このツールは、選択可能な (クリック可能な) 2つのエンドポイントを指定して、衛星群と地上シナリオのエンドツーエンドの往復遅延をベンチマークします。ガラスファイバーの屈折率を考慮して、衛星間リンク (ISL) と地球大圏 (地球上の最良のシナリオ) を備えたコンステレーションのリンク遅延を計算します。このツールは、Fiber-vs-Sat Delay Metricsツール (メニューからもアクセス可能) を補完します。
- ISL動作制御:
- アウトプット:地図上に動的に表示される最短パスISLリンクの選択、衛星 (遅延、衛星およびISLホップ) およびファイバー (大圏) のエンドツーエンド遅延計算サンプルを含むタイムラインチャート
- データ:CSV形式でダウンロード可能
IPスループットツール
システムごと、衛星のタイプ/世代ごと、ペイロードビームごとに、きめ細かな容量とリンク効率の計算を実行する構成可能なリンクバジェット (LB) ツール。パラボラアンテナとフラットパネルアンテナの両方をサポートしています。NCATサーバーは、NCATデータベースに保存されているビームの技術データに基づいて、すべてのペイロードビームのオンデマンドのクリアスカイリンクバジェット分析を計算します。衛星データは衛星の生成に基づいており、NCATユーザーは特定のゲートウェイおよびユーザービーム (アップリンクとダウンリンクの両方) を選択して、詳細なテーブルにLB結果を表示できます。
ツールのアウトプット (すべてのビーム) はテーブルに表示され、ヒートマップおよびモビリティ解析ツール、およびダッシュボードツールの概要で使用できるようにローカルメモリに保存されます。
- LB分析のアウトプットテーブル:
- アップリンクClearSkyリンクバジェット (LB) 分析アウトプット (フォワード&リターンリンク、複数のルックアングル):チャネル帯域幅[MHz]、中心周波数[GHz]、アンテナ仰角[度]、最小BUC/TWTAパワー (飽和フルビーム) [W]、アンテナ直径[m]、アンテナ利得[dBi]、アンテナ給電フランジ電力[dBW]、EIRP[dBWi]、傾斜距離 (局-衛星) [km]、自由空間経路損失 (FSPL) [dB]、大気損失[dB]、衛星での電力束密度 (PFD) [dBW/m2]、ステーションに向けた衛星RXアンテナピークゲイン[dBi]、アンテナポインティングエラー/G/T不利[dB]、その他の損失 (カスタム調整に使用) ) [dB]、最大時のG/T。ゲインポイント[dB/K]、地上アンテナ方向のG/T[dB/K]、熱C/N0[dB]、C/I (GSOネットワークからのASI) [dB]、C/I (Xpol) [dB]、C/I (IM) [dB]、C/ (N+I) [dB]、Eb/No[dB]、Es/No (必須) [dB]、Es/No (モデム) [dB]、Es/マージンなし[dB]、優先変調タイプ (ModCod) 変調 (Xry) 、FECレート、ModCodスペクトル効率 (ロールオフを無視) [bits/Hz]、ロールオフ (1.x) Nw管理オーバーヘッド (%) 、情報ビットレート[Mbps]
- ダウンリンクClearSkyリンクバジェット (LB) 分析アウトプット (フォワード&リターンリンク、複数のルックアングル) :チャネル帯域幅[MHz]、中心周波数[GHz]、アンテナ仰角[度]、最大。送信EIRP密度[dBW/Hz]、最大送信EIRP (-BO) [dBWi]、EIRP/ポインティングデメリット[dB]、EIRP (ユーザー方向) [dBWi]、傾斜距離 (局-衛星) [km]、FSPL[dB]、大気損失[dB]、ユーザーアンテナ直径[m]、衛星方向のRXアンテナ利得[dBi]、RXシステム雑音温度[K]、その他の損失 (カスタム調整に使用) [dB]、衛星方向のG/T[dB/K]、熱C/N0[dB]、C/I (GSOネットワークからのASI) [dB]、C/I (Xpol) [dB]、C/I (IM) [dB]、C/ (N+I) [dB]、結合C/ (N+I) アップ&ダウン (ベントパイプのみ) [dB]、RX Eb/No[dB]、Es/No (必須) [dB]、Es/No (モデム) [dB]、Es/マージンなし[dB]、優先変調タイプ (ModCod)
- モジュレーション (Xry) 、FECレート、ModCodスペクトル効率 (ロールオフを無視) [ビット/Hz]、ロールオフ (1+x) 、Nw管理オーバーヘッド (%)
- リンクバジェットの概要 (ユーザー選択ビーム) :ゲートウェイアンテナサイズ[m]、ユーザーアンテナサイズ[m]、ゲートウェイビームID、ゲートウェイビームタイプ、ゲートウェイ中心周波数[GHz]、ゲートウェイビーム帯域幅[MHz]、ゲートウェイ平均ビームIPスループット[Mbps]、ゲートウェイ平均スペクトル効率[ビット/ヘルツ]、ユーザービームID、ユーザービームタイプ、ユーザー中心周波数[GHz]、ユーザービーム帯域幅[MHz]、ユーザー平均ビームIPスループット[Mbps]、ユーザー平均スペクトル効率[ビット/ヘルツ]
- 達成可能なサイトIPスループット:フォワード&リターンサイト容量、(衛星可視) サイトの最大ユーザー容量[Mbps]
- 衛星IP容量:- ゲートウェイビーム:ビーム数、合計スペクトル[MHz] (偏光および空間周波数の再利用を含む) 、ビームごとの平均帯域幅[MHz]、衛星IP容量[Gbps]- 最大 (最高/高品質の外観) 角度) 、衛星IP容量[Gbps]- 平均 (平均ルックアングル) 、衛星IP容量[Gbps]- 最小 (最悪/低ルックアングル)
- 衛星IP容量:- ユーザービーム:ビーム数、合計スペクトル[MHz] (偏光および空間周波数の再利用を含む) 、ビームごとの平均帯域幅[MHz]、衛星IP容量[Gbps]- 最大 (最高/高品質の外観) 角度) 、衛星IP容量[Gbps]- 平均 (平均ルックアングル) 、衛星IP容量[Gbps]- 最小 (最悪/低ルックアングル)
- フォワード&リターンリンク容量:衛星容量[Gbps]- 最大 (最良/高ルックアングル) 、衛星容量[Gbps]- 平均 (平均ルックアングル) 、衛星容量[Gbps]- 最小 (最悪/低ルックアングル)
- 注記
ヒートマップツール
このツールは、単一または複数軌道/マルチプレイヤーコンステレーションのIPブロードバンドの供給と需要の帯域幅ダイナミクスの詳細な動的分析を実行します。
スループットツール (メモリに保存) であるヒートマップツールは、リアルタイムで情報を処理し、需要条件に基づいて、選択された帯域幅供給の公平性基準に基づいて定義されたセルにビーム容量を動的に割り当てます。NCATユーザーは、衛星の視程に基づいて平方キロメートルあたりの比例オーバーヘッド容量を計算した以前の静的NCATバージョンよりも優れた推計を実行できます。
- シミュレーション速度コントロール
- 表示コントロール
- UT衛星の選択
- ターゲット市場:セル密度に基づくユーザー定義パラメータ
- 固定ブロードバンドサービスプランの定義
- 表示用ヒートマップメトリックセレクター:人口、可視衛星、容量需要、供給と需要
- 帯域供給・分配公平性セレクター:低需要セルを優先、高需要セルを優先、可視衛星が少ないセルを優先、ランダムセル優先
- アウトプット:コンステレーションのマップアニメーション (シングルおよびマルチシェル)
- 六角形グリッド:サマリー
- サマリーバナー
- ダウンロード可能なCSVファイルとデータカラム:
- サマリー
- セルグリッド
- 衛星コンステレーション
モビリティヒートマップツール
- シミュレーション速度コントロール
- 表示コントロール
- UT衛星の選択
- 航空会社と空港のセレクター
- 地域グリッドの選択
- 固定ブロードバンドサービスプランの定義とターゲット市場
- 表示用ヒートマップメトリックセレクター:人口、可視衛星、容量需要、供給&需要
- 帯域幅供給・分配公平性セレクター
- アウトプット:コンステレーションのマップアニメーション
- 六角形グリッドの概要:
- ダウンロード可能なCSVファイルとデータ列:
- 飛行経路データ
- サマリー
- セルグリッド
- 衛星コンステレーション
- 注記
ダッシュボードツール
- インプット:コンステレーション内の衛星の数、衛星の推定寿命 (年) 、衛星あたりの推定ユーザービームスループット (Gbps、ダウン+ アップ) 、衛星あたりの製造コスト、衛星の質量 (Kg) 、Kgあたりの打ち上げコスト、ターゲットのアドレサビリティ&キャプチャ
- アウトプット:使用可能なMbpsあたりの資本コストのビジネスケース感度分析
- 確率チャート
- モデルのインプットとBCのアウトプット間の相関関係を示す図
- インフォグラフィック要約ツールの分析
ビジネスケース分析ツール:光ファイバー vs 衛星バックホール
- インプット:予測帯域幅使用量- 新しいネットワーク全体のMbps、接続ユーザーあたりの平均ラストマイルCAPEX、非GEO HTS帯域幅の使用量とコスト、GWホスティング収益、端末コスト、サービス収益と費用、資本支出- コアファイバーとラストマイル、NPV分析インプット値 (法人税率、借入金利、割引率、減価償却費)
- アウトプット:EBITDA、FCF、NPV、ヒストグラム分布を含む収益性を含むグラフとデータ
- モデルインプットとBCアウトプットの間の相関関係を示す散布図
- モンテカルロシミュレーションサンプル (1,000サンプル)
光ファイバー vs 衛星遅延メトリックツール
- インプット:2ポイントリンクの位置 (緯度/経度) 、ルーティング/衛星ホップごとの構成可能な処理遅延、ファイバーの屈折率、コンステレーションの軌道特性 (高度、最小アンテナ仰角)
- アウトプット:衛星間リンク (光ISL) 、地上相互接続、ゲートウェイ中継局の使用を考慮した4つの考えられるSATシナリオのベンチマーク
- SAT対FOシナリオのインフォグラフィックアウトプット
除外角度、EPFD解析ツール
- インプット
- ダウンリンク
- アップリンク
- アウトプット:満たすべき計算された最小アップリンクおよびダウンリンク識別角 (φ) 、ITU勧告に従って計算されたテーブル、アンテナ放射パターンチャート、ユーザーアンテナの可視コーンと衛星のフィールドで考えられる (許可および禁止された) アップリンクルックアングルのヒートマップサイトの緯度に基づくビュー
FULL TOOLKIT:
- +3 Quarterly Updates: NCAT app
- Daily Updates: Data sources
“Non-Geo Constellations Analysis Toolkit 4.0” is now an online web application with more capabilities and power than previous spreadsheet versions.
This product's deliverables include:
- One-year multi-user access to all toolkit features, software upgrades, and database updates.
- 12 combo tools (some tools combined into fewer, dynamic tools).
- Daily updates: Orbital observations for operating satellites and airline flight routes.
- Quarterly Updates: NCAT software updates and database updates.
- Country zoom-in analysis - for over 200 countries and territories.
- Integrated with sources of commercial flight data to simulate in-flight connectivity supply-demand dynamics (thousands of selectable airlines and airports)
Report Summary:
NSR's “Non-GEO Constellations Analysis Toolkit 4.0 (NCAT4) ” is an assembly of quantitative models that x-ray and benchmark LEO and MEO satellite constellations.
The latest edition of NSR's industry-leading benchmarking toolset has moved online bringing expanded capabilities and processing power. With NCAT4, users can assess the impact of constellations dynamically, across both space and time domains, and with finer resolution and speed than previous Excel versions.
Changes and New Additions in this Edition:
Version 4 of NSR's industry-leading benchmarking toolset is a web application running millions of calculations on datasets compiled for planned and operational NGSO systems. Each tool is configurable via filters, controls and user-defined inputs. New capabilities include:
- Point-and-click interactivity: Through interactive maps and controls (layers, filters, buttons and settings) NCAT users can zoom in/out, click to set user-terminal locations and control dynamic calculations and visualizations.
- Multi-orbit analysis: Simulations are configurable for a combination of sub-constellations, from one or multiple satellite operators. In NCAT4 the number of shells and satellites combinable is limitless.
- Enhanced database and application update cycle:
- Quarterly: Enhancements to the software and database are deployed quarterly.
- Daily: The number of operating satellites and orbital observations are updated daily and automatically for fully or partially deployed operating NGSO shells (Starlink, OneWeb, etc.)
- Dynamic, animated visualizations: Users can visualize propagating conditions in real time such as satellites position, footprint, visible satellites, antenna look angles, link latency variations, supply and demand heatmaps, etc.
- Space-time simulation controls: NCAT users can choose to run real-time or accelerated time-lapse analysis globally, regionally (user-defined area) or locally for over 200 countries and territories.
- Simulations can be accelerated up to 300 times, allowing toolkit users to run an entire day of constellation performance inless than 5 minutes.
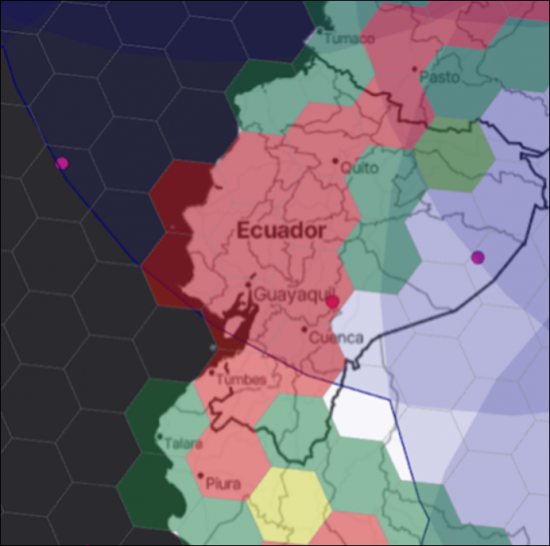
- Hexagonal Ground Grid: NCAT4 introduces a dynamic hex-grid. Country ground grid precision is configurable down to city-size resolution (~9 km cell radius, a 100X improvement over previous NCAT versions).
- Boosted IP throughput computations: In previous Excel NCAT versions, the IP throughput analysis for Non-GEO satellites was extrapolated from the result of executing link-budget (LB) calculations on specific, user-selectable beams. NCAT4 pushes this approach further by proactively computing LBs on all user and gateway beams. Additionally, the number of IP throughput link budget instances for combinations of gateway and user-terminal look angles is three times larger (finer) than in previous NCAT versions.
- Demand-driven supply: Via selectable supply fairness criteria, NCAT4 simulates reconfigurations of steerable beam capacity to best meet changing demand conditions.
- Upgraded Mobility Tool: NCAT4 is now linked to daily information sources* of commercial flights for the assessment of in-flight connectivity (IFC) supply/demand dynamics (tens of thousands of flight routes, airlines and airports).
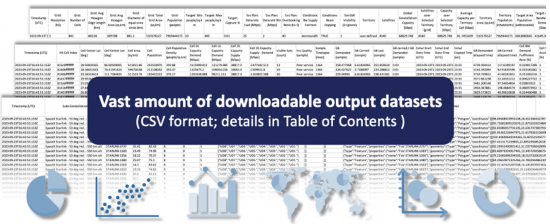
- Downloadable datasets: NCAT4 simulations produce vast amounts of output datasets that are downloadable in CSV format for further processing outside the NCAT platform: Timestamped constellation shells data, terrestrial grids, capacity supply & demand calculations, assessment summaries, flight routes, charts data, look angles, beam utilization, etc. (details in Table of Contents)
“NCAT4 ” is a standalone NSR product that may also be leveraged in combination with market metrics and insights from relevant NSR and Analysys Mason research studies. The toolset is meant for both business and technical professionals alike seeking in-depth understanding of NGSO SATCOM.
*Daily flight information is currently supported through NCAT's server API key. In future updates NCAT users may need to use their own keys to access daily flights information.
Key Questions Addressed:
- How do NGSO architectures differ at multiple levels: Coverage, capacity, beams and satellites?
- What is the service impact of constellations' orbital mechanics (coverage, portion of the Earth covered, maximum latitude reach, distance and delay, orbital period, satellite pass time, etc.)?
- What is the maximum, average and minimum number of satellites in line of sight (LoS) across all latitudes, per shell or selectable combination of shells?
- What is the timestamped number of visible satellites and look angles at user-defined terminal locations?
- How does fiber latency benchmark against LEO topologies, depending on POPs, use of optical inter-satellite links (OISL) and link relays?
- What is the forward and return link capacity (spectrum, bandwidth and IP throughput) per selectable gateway/user beam, satellite and sub-constellation?
- How do uplink and downlink beam performance (efficiency, ModCods) and IP capacity vary based on user-terminal and gateway elevation angles?
- What is the maximum, minimum and average IP throughput capacity per beam, satellite generation and sub-constellation?
- How much capacity can be steered towards specific (definable) territories or countries at aggregate and cell area levels?
- How to assess supply and demand dynamics factually, based on user-configurable mobility and fixed broadband service plans? Where are the congestion areas and how they shift over time?
- How can the capital cost per usable Mbps/month be inferred? What is the sensitivity to cost and performance elements?
- Under what conditions can SATCOM constellations become competitive vs. fiber optics to service distant underserved communities? How sensitive is the backhaul business case to CAPEX and OPEX elements?
- What are the regulatory exclusion angles for NGSO systems to avoid interfering with GEO (GSO) systems?
“NCAT4 ” processes millions of data points dynamically to drive unbiased, rigorous assessments of constellations' capabilities and their competitive standing versus terrestrial networks.
Bottom Line: Clients rely on a feature-rich toolbox to drive analysis of LEO and MEO satellite constellations.
Key Features:
LEO and MEO satellite constellations beaming tens of Terabits per second have disrupted the space sector, affecting the wider telecommunications industry. It has become vital for strategists, planners and business/technical decision makers across fixed, wireless and satellite value chains to measure and visualize the impact at granularly defined levels. The NCAT4 platform provides a multiplicity of tools, each with its own variables and filters driving accurate calculations that users can visualize on maps, charts, infographics and exportable datasets.
Toolkit Elements Include:
- Sophisticated but easy-to-use analytics models driven by auto-populated or manually set inputs and filters
- Output-rich set of technical and business metrics benchmarking constellations performance at multiple layers
- Useful visualizations including comparison charts, dynamic heatmaps, satellites, footprints per constellation and infographics.
- Detailed input and output data tables with information per system and sub-constellation
- Bandwidth supply and addressability assessments for geographic-based SWOT and TAM analysis
- Examination of line-of-sight satellites and gateway/terminal beam IP throughput
- Estimator of breakeven capital costs per deployed and usable Mbps
- Terrestrial versus satellite backhaul business-case sensitivity analysis via configurable Monte Carlo simulation.
- Uplink and downlink discrimination angle calculations for NGSO-GSO interference avoidance
- Granular heatmaps of satellite bandwidth supply/demand dynamics via a configurable grid system
- Other models and calculators included: User and gateway antenna visibility cones, satellites beam-covered areas, shells' latitude reach, portion of Earth surface and population addressed, orbital period, satellite handoff time, slant range, satellite vs. terrestrial latency, upstream and downstream spectrum and throughput, spectral efficiency, fiber vs satellite NPV (Net Present Value) sensitivity analysis, profitability, etc.
- Datasets are downloadable in CSV format. Visualizations (maps, charts, infographics) are downloadable in PDF /PNG formats
Who Should Purchase NCAT:
- Established and emerging satellite operators (GSO & NGSO, FSS & MSS)
- Teleport operators, satellite service providers and Integrators
- Distributors and resellers of managed satellite services
- Terrestrial and wireless network operators including telcos, MNOs, towercos, cable, IP Transit, WLL and cloud service providers.
- Equipment manufacturers of solutions for NGSO SATCOM, including terminals, antennae (MSA & ESA), hub/modems, RF and ground-network virtualization sub-systems
- Spacecraft manufacturers and component vendors
- Airlines, cruise lines and energy communication stakeholders
- Other major end users of NGSO services including commercial, government, defense and first responders.
- Industry Associations and research labs /institutions
- IT Companies developing virtualized cloud software solutions for constellations.
- Regulators and spectrum utilization agencies
- Financial institutions, investment management and insurance.
Systems Analyzed in this Product:
As an online configurable toolset NCAT4 has unlimited expandability and is delivered pre-populated with key data inputs for leading NGSO systems. Datasets include granted, operating and proposed systems. Partial list: Amazon Project Kuiper, AST SpaceMobile, Astra Space, Hughes HVNET, Intelsat MEO, Kepler Communications, LYNK Global, Mangata Networks, OneWeb, Rivada Space Networks, SES O3B, SpaceX Starlink, Telesat Lightspeed and Viasat/Inmarsat.
Market commentary:
"The go-to compendium and toolkit for NGSO constellations." - Konrad Nieradka, System and Service Architect, Rivada Space Network.
"Very impressive piece of work, and incredibly useful." - Nihar Shah, Vice President, Strategy and Market Intelligence, SES.
"Excellent toolset ! Flexible, visual, easy-to-use and with in-depth analysis." - Pablo Rasore, CEO, Grupo Andesat.
Table of Contents
Toolkit User Guide (PDF)
Online Toolkit Tools (brief description, inputs and output below)
Configuration /Settings Menu
Web page (clickable in the private NCAT menu) that downloads the latest data from the NCAT4 database and displays it in tables. Users can select (check) and edit the specific sub-constellations and gateway stations for personalized analysis.
- Database table with selectable and editable constellation shells. Table columns:
- Shell ID, System Name, Altitude, Orbital Inclination, Orbital Planes, Sats per Plane, Min Elevation Angle - User Terminals, Min Elevation Angle - Gateway Antennas, ISL.
- Database table with a selectable and editable list of gateway stations:
- Gateway ID, Operator , System, GW Name, Latitude, Longitude, Antennas, Antenna Size [m], Source
- Benchmark charts
- Note: User edits are stored only in the local machine browser memory (NCAT4 users' personalized analysis is not sent to the server)
Calculators Tool
Page populated with calculators and visualization tools for various needs, meant for users to quickly drive general metrics by editing only a small set of inputs
- Constellation Characteristics
- Inputs: Constellation Name, Orbital Inclination, Minimum Elevation Angle - User antenna/terminal, Minimum Elevation Angle - Gateway Station antenna, Satellite Altitude.
- Output: Orbital Radius, Flight Velocity, Angular Speed, Orbital Period, Max. time between handoffs (Pass Time), Min. Satellite Handoff Rate.
- Portion of Earth Covered (blanketed) by Constellation
- Max Latitude Reached by Sat's Footprint (N & S)
- Portion of Earth Surface Covered by Constellation
- Surface Area Covered (between N and S Max Latitudes)
- Surface Area Not Covered: North and South of Max Lat Reach.
- Satellites Footprint
- Min Surface Area covered by each Satellite (footprint)
- number of sats in constellation
- Minimum satellite coverage angle (from Earth center)
- Sats Coverage Radius
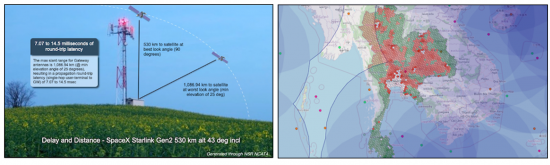
- Distance and Delay: Earth to Satellite
- Min Distance between sats and ground stations (GS)
- Min Round-Trip Delay (@ 90 deg elevation)
- Max Sat-GS Distance -User terminal (@ min UT el angle)
- Max Sat-GS Distance -GW Station (@ min GW el angle)
- Max Round-Trip Delay between GW and UT (both @ min el angle)
- Infographics generator
- Inputs data from calculator or from the shell list checked in the config menu
- Selectable infographics background image
- Map viewer
- For geoJSON data collections of points, lines and polygons
- Hexagonal grid viewer based on cell index and resolution inputs
- Note: User inputs and simulation results are stored only in the local machine browser memory (NCAT4 users' personalized analysis is not sent to the server).
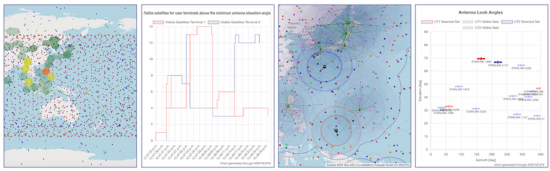
Visibility Tool
Tool designed to dynamically calculate and display orbiting satellites and visibility metrics for multi-shell constellations. Displays satellites in real time and supports multi-orbit, multi-player analysis. Each sub-constellation (shell) selected in the settings menu is displayed with a distinct color. Tool output includes calculations for satellites in line of site based on the map zoom level, a timeline of visible satellites for user-defined terminal locations (clickable) and a "sat tracker" for the calculation of terminal's (UT) "look angles" (azimuth/elevation)
- Simulation speed controls: Time Controls (fast-backward, backward, play/pause, forward, fast-forward, reset time buttons), simulation peed accelerator (real time, 60X, 300X and custom speed).
- Display Controls: Satellites, Sat Field of View (FoV), GWs & visible sats, UT & visible sats, Undersea Fiber Cables (disabled /feature use), Serviceable Area (color Intensity), reach contour (Real Time, Maximum Reach, Continuous Reach)
- UT Sat Selection: Best look angle, Lowest latency, Min handoff rate
- Option: Include /Ignore satellite GW visibility
- Output: Map animation of constellation (single and multi-shell)
- Clickable for user terminal location
- Satellites in Line of Sight (LoS) Chart: Minimum, average, maximum and real-time number of satellites in LoS across -90 to 90 degrees latitude
- Download buttons for chart (PDF) and data (csv)
- Timeline chart of visible satellites for the user terminals (2)
- Download buttons for chart (PDF) and data (csv)
- "Sat Tracker" chart showing antenna look angles (azimuth & elevation) for set user terminals (2)
- Real-time calculation of satellites in Line of Sight (LOS) for the defined site locations
- Antenna azimuth and elevation for all satellites visible by the terminals
- Selected satellite for connection based on defined criterion (lowest delay, etc.).
- Download buttons for chart (PDF) and data (csv)
- Downloadable CSV files and data columns:
- Constellations data: Timestamp (UTC), Sat Name, Sat Latitude, Sat Longitude, Altitude [km], Inclination [deg], ECI position: X, ECI position: Y, ECI position: Z, Orbital Period [min], Mean Motion [deg/min], Revs per Day, Eccentricity, Field of View (FoV) Rings in GeoJson format.
- Satellites in Line of Sight (LoS): Latitude (-90 to 90 degrees in 5 deg. increments), Sats In Los Max, Sats In Los Avg, Sats In Los Min.
- Sat Tracker: Timestamp (UTC), Visible Sats, Sat Azimuth, Sat Elevation, Selected Sat for Link
- Visible Sats Timeline: Timestamp (UTC), Number of Visible Satellites Terminal 1, Number of Visible Satellites Terminal 2.
- Note: User settings and simulation results are stored only in the local machine browser memory (NCAT4 users' personalized analysis is not sent to the server)
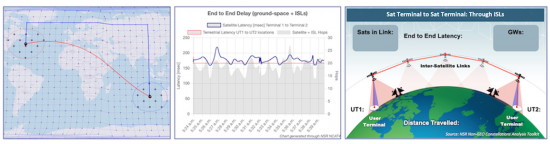
Latency Tool
Tool that benchmarks satellite and terrestrial end-to-end link latency in real time. This tool is designed for the assessment of constellations or sub-constellations with Inter-Satellite Links (ISL /OISL). Given two selectable (clickable) end points the tool benchmarks the end-to-end round trip latency of satellite constellations versus terrestrial scenarios. It calculates the link delay for constellations with Inter-Satellite Links (ISLs) and great-circle terrestrial (best-case terrestrial scenario) considering glass-fiber's refraction index. This tool complements the Fiber-vs-Sat Delay Metrics tool (also accessible in the menu).
- ISL Behavior Controls:
- Intra-plane: Sat search Sensitivity (as multiplier of default search area)
- Inter-plane: ISL FoV Angle [deg]
- ISL Reach (as multiplier of max inter-plane distance)
- ISL Sat Selection: Nearest sat (within ISL FoV and reach), Sat with lowest relative speed (within ISL FoV and reach)
- Output: Shortest-path ISL link selection displayed dynamically on the map, timeline chart with end-to-end latency calculation samples for satellite (latency, satellite and ISL hops) and fiber (great circle)
- Data downloadable in CSV format.
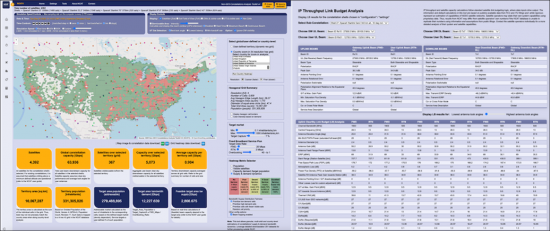
IP Throughput Tool
Configurable Link Budgeting (LB) tool that performs granular capacity and link efficiency calculations per system, per satellite type/generation, and for each payload beam. It has support for -both- parabolic and flat-panel antennas. The NCAT server computes on-demand clear-sky link budget analysis for all payload beams based on beams technical data stored in the NCAT database. Satellite data is based on the satellite generation and NCAT users can select specific gateway and user beams (both uplink and downlink) to display the LB results in detailed tables.
Tool output (all beams) is displayed in tables and stored in local memory for use in the heatmap and mobility analysis tools, as well as in dashboard-tool summaries.
- LB analysis Output tables:
- Uplink ClearSky Link Budget (LB) Analysis Output (forward and return links, multiple look angles): Channel Bandwidth [MHz], Central Frequency [GHz], Antenna Elevation Angle [deg], Min BUC/TWTA Power (saturated full beam)[W], Antenna Diameter [m], Antenna Gain [dBi], Antenna Feed Flange Power [dBW], EIRP [dBWi], Slant Range (Station-Satellite) [km], Free Space Path Loss (FSPL) [dB], Atmospheric Loss [dB], Power Flux Density (PFD) at Satellite [dBW/m2], Satellite RX Antenna Peak Gain towards Station [dBi], Antenna Pointing Error / G/T disadvantage [dB], Other Losses (use for custom adjustment) [dB], G/T at Max. Gain Point [dB/K], G/T towards Ground Antenna [dB/K], Thermal C/N0 [dB], C/I (ASI from GSO networks)[dB], C/I (Xpol)[dB], C/I (IM)[dB], C/(N+I)[dB], Eb/No[dB], Es/No (Required)[dB], Es/No (Modem)[dB], Es/No Margin [dB], Preferred Modulation Type (ModCod) Modulation (Xry), FEC Rate, ModCod Spectral Efficiency (ignoring roll-off) [bits/Hz], Roll-Off (1.x) Nw Mgmt Overhead (%), Information Bit Rate [Mbps].
- Downlink ClearSky Link Budget (LB) Analysis Output (forward and return links, multiple look angles): Channel Bandwidth [MHz], Central Frequency [GHz], Antenna Elevation Angle [deg], Max. Transmit EIRP Density [dBW/Hz], Max. Transmit EIRP (-BO) [dBWi], EIRP /Pointing disadvantage [dB], EIRP (towards user) [dBWi], Slant Range (Station-Satellite) [km], FSPL [dB], Atmospheric Loss [dB], User Antenna Diameter [m], RX Antenna Gain towards Satellite [dBi], RX System Noise temperature [K], Other Losses (use for custom adjustment) [dB], G/T towards the Satellite [dB/K], Thermal C/N0 [dB], C/I (ASI from GSO networks) [dB], C/I (Xpol) [dB], C/I (IM) [dB], C/(N+I) [dB], Combined C/(N+I) up & down (bent-pipe only) [dB], RX Eb/No [dB], Es/No (Required) [dB], Es/No (Modem) [dB], Es/No Margin [dB], Preferred Modulation Type (ModCod)
- Modulation (Xry), FEC Rate, ModCod Spectral Efficiency (ignoring roll-off) [bits/Hz], Roll-Off (1+x), Nw Mgmt Overhead (%).
- Link Budget Summary (user selected beams): Gateway Antenna Size [m], User Antenna Size [m], Gateway Beam ID, Gateway Beam Type, Gateway Center Frequency [GHz], Gateway Beam Bandwidth [MHz], Gateway Average Beam IP Throughput [Mbps], Gateway Avg. Spectral Efficiency [bits/hertz], User Beam ID, User Beam Type, User Center Frequency [GHz], User Beam Bandwidth [MHz], User Average Beam IP Throughput [Mbps], User Avg. Spectral Efficiency [bits/hertz]
- Achievable Site IP Throughput: Forward & Return Site Capacity, Max. User capacity at (sat-visible) site [Mbps]
- Satellite IP Capacity: - Gateway Beams: Number of Beams, Total Spectrum [MHz] (incl. pol. & spatial freq. reuse), Average Bandwidth per Beam [MHz], Sat IP Capacity [Gbps] - Max (best/high look angles), Sat IP Capacity [Gbps] - Avg (average look angles), Sat IP Capacity [Gbps] - Min (worst/low look angles)
- Satellite IP Capacity: - User Beams: Number of Beams, Total Spectrum [MHz] (incl. pol. & spatial freq. reuse), Average Bandwidth per Beam [MHz], Sat IP Capacity [Gbps] - Max (best/high look angles), Sat IP Capacity [Gbps] - Avg (average look angles), Sat IP Capacity [Gbps] - Min (worst/low look angles)
- Forward & return Link Capacity: Satellite Capacity [Gbps] - Max (best/high look angles), Satellite Capacity [Gbps] - Avg (average look angles), Satellite Capacity [Gbps] - Min (worst/low look angles)
- Notes:
- This tool leverages an NCAT4 server-side API to run all possible LB combinations, based on user inputs. The API is currently accessible only via the NCAT4 frontend application.
- IP throughput and satellite capacity calculations follow standard satellite link budgeting logic, where data inputs drive output. The information and default calculations in this tool are based on publicly available data from FCC and ITU filings and -while rigorous- represent an estimation of capabilities of NGSO satellite networks. Satellite operators may state their own system capabilities using proprietary data. Thus, results from NCAT may differ from satellite operators' own numbers if the NCAT database is unable to replicate their numbers using information and assumptions from public filings. Contact the satellite operators individually for a more detailed analysis of their system and satellite capabilities.
- As of the NCAT4 release date, the server counts with technical satellite data to perform link budget, IP bandwidth calculations for the following systems (based on satellite generation, applies to all shells using same satellite architecture). Users can edit the NCAT inputs to run LB analysis for any other system not surveyed/cataloged in the NCAT server:
- Amazon Project Kuiper (Ka and V systems), Astra Space, Boeing, Hughes HVNET, Intelsat MEO, OneWeb (phases 1 & 2), SES O3B (current and next generation MEO-HTS), Starlink (Gen1 and Gen2), SpaceX VLEO, Telesat Lightspeed (granted and modified), Telesat VLEO and Viasat MEO & LEO.
- AST Space Mobile, China GW-2 & GW-A59, E-Space, Kepler Communications, LYNK Global, Mangata Networks and Rivada Space Networks are not fully digitized. Data and calculations for such systems are provided for orbital mechanics but not for IP throughput analysis. Toolkit users can refer to the relevant ITU/FCC filings to extract technical data and leverage the generic Link Budgeting tool (included with the toolkit) to run performance calculations on such systems and/or any other.
Heatmap Tool
This tool executes a granular and dynamic analysis of IP broadband supply & demand bandwidth dynamics for single or multi-orbit/multi-player constellations. Based on factual IP throughput results previously conducted using the IP
Throughput tool (stored in memory), the heatmap tool processes the information in real-time and, based on demand conditions, assigns beam capacity dynamically to the ground the cells defined based on the bandwidth supply fairness criterion selected. NCAT users can run better estimations than those calculated in previous static NCAT versions that calculated proportional overhead capacity per square kilometer based on satellite visibility.
- Simulation speed controls: Time Controls (fast-backward, backward, play/pause, forward, fast-forward, reset time buttons), simulation peed accelerator (real time, 60X, 300X and custom speed).
- Display Controls: Satellites, Sat Field of View (FoV), GWs & visible sats, UT & visible sats, Hexagonal cells, Serviceable Area (color Intensity), reach contour (Real Time, Maximum Reach, Continuous Reach)
- UT Sat Selection: Best look angle, Lowest latency, Min handoff rate
- Option: Include /Ignore satellite GW visibility
- Territory Selection: User-defined (dynamic resolution grid), or country zoom-in (over 200 countries and territories selectable)
- Coarse/Fine Option: Modify country cell resolution, down to city-size precision (~9 km cell radius).
- Target Market: User-defined parameters based on cell population density:
- Minimum density (0.1 to 100 inhabitants/sq.km)
- Maximum density (100 to 1000 inhabitants/sq.km)
- Target market capture (%)
- Fixed Broadband Service Plan Definition:
- Target forward and return data rates [Mbps]
- Overbooking rate.
- Heatmap Metric Selector for Display: Population, visible satellites, capacity demand, supply & demand (combined)
- Bandwidth Supply Distribution Fairness Selector: Prioritize low demand cells, Prioritize high demand cells, Prioritize cells with fewer visible sats, Random cell priority.
- Output: Map animation of constellation (single and multi-shell)
- Color-coded hexagonal cells based on defined resolution/territory, supply/demand and metric selector.
- Download buttons for chart (PDF) and data (csv)
- Hexagonal grid summary: Resolution, Number of Cells, Avg Hexagon Edge Length (km), Avg Hexagon Area (sq.km), Diameter of equal-area circle (km), Total Grid Area (sq.km), Population (people)
- Summary Banners: Satellites, Global constellation capacity [Gbps], Satellites over selected territory (grid), Capacity over selected territory [Gbps], Average capacity per territory cell [Gbps], Territory area [sq.km], Territory population [inhabitants], Target area population (addressable), Target area bandwidth [Gbps], Feasible target area bandwidth supply [Gbps]
- Downloadable CSV files and data columns:
- Summary: Timestamp (UTC), Grid: Resolution (h3), Grid: Number of Cells, Grid: Avg Hexagon Edge Length (km), Grid: Avg Hexagon Area (sq.km), Grid: Diameter of equal-area circle (km), Grid: Total Grid Area (sq.km), Grid: Population (people), Target: Min people/sq.km, Target: Max people/sq.km, Target: Capture %, Svc Plan: Datarate Fwd [Mbps], Svc Plan: Datarate Rtn [Mbps], Svc Plan: Overbooking Ratio (to 1), Conditions: Bw Supply Fairness, Conditions: Beam Hopping, Sat-GW Visibility (1=ignore), Territory Satellites, Global Constellation Capacity [Gbps], Satellites over Selected Territory (grid), Capacity over Selected Territory [Gbps], Average Capacity per Territory Cell [Gbps], Territory Area [sq.km], Territory Population [inhabitants], Target Area Population (addressable), Target Area Bandwidth Demand [Gbps], Feasible target area bw supply [Gbps].
- Cell Grid: Timestamp (UTC), H3 Cell Index, Cell Center Lat [deg], Cell Center Lon [deg], Cell Area [sq.km], Cell Population, Cell Population Density [people/sq.km], Cell DL Capacity Demand [Mbps] , Cell UL Capacity Demand [Mbps], Cell DL Capacity Supply [Mbps], Cell DL Capacity Supply - Demand [Mbps], Visible Sats (count), Svc Quality (sample) , Sample Timelapse [msec], GB Demanded (sample), GB Carried (sample), GB Lost (sample), GB carried / GB Demanded (sample), Simul Start Date-Time (UTC), Simul End Date-Time (UTC), Simul Elapsed Time [sec], GB Demanded (elapsed time), GB Carried (elapsed time), Cell BW Demand Fulfillment Rate [%], Cell Svc Availability [%].
- Satellite Constellation: Timestamp (UTC), Subs-Constellation, Sat Name, Sat Latitude, Sat Longitude, DL User Beams Used (Count), DL User Beams Free (Count), DL User Beam Utilization, DL User Beams Used (List), DL User Beams Free (List), DL User Beams Partially Used - List, Field of View (FoV) Rings in GeoJSON format.
- Note: User settings and simulation results are stored only in the local machine browser memory (NCAT4 users' personalized analysis is not sent to the server)
Mobility Heatmap Tool
This tool executes a granular and dynamic analysis of constellations' supply & demand bandwidth dynamics for mobility (currently only In-Flight Connectivity -IFC). Users can optionally configure settings for fixed broadband (same as in the heatmap broadband tool) if the scenario requires mixing of the two applications. Based on factual IP throughput results previously conducted using the IP Throughput tool (stored in memory), the heatmap tool processes the information in real-time and, based on demand conditions, assigns beam capacity dynamically to the aircraft and associated ground cells defined based on the bandwidth supply fairness criterion selected.
- Simulation speed controls: Time Controls (fast-backward, backward, play/pause, forward, fast-forward, reset time buttons), simulation peed accelerator (real time, 60X, 300X and custom speed).
- Display Controls: Satellites, Sat Field of View (FoV), GWs & visible sats, UT & visible sats, Airports & flight routes, Aircraft & travelled routes, Hex cells, Serviceable Area (color Intensity), reach contour (Real Time, Maximum Reach, Continuous Reach)
- UT Sat Selection: Best look angle, Lowest latency, Min handoff rate
- Option: Include /Ignore satellite GW visibility.
- Airline and Airports selector: Selectable by IATA codes from a list of over 12 thousand airlines and ~10 thousand airports.
- Outbound and inbound flights selectors.
- Territory Grid Selection: User-defined (dynamic resolution grid), or country zoom-in (over 200 countries and territories selectable)
- Coarse/Fine Option: Modify country cell resolution, down to city-size precision (~9 km cell radius).
- Fixed Broadband Service Plan Definition and Target Market: User-defined parameters based on cell population density.
- Heatmap Metric Selector for Display: Population, visible satellites, capacity demand, supply & demand (combined)
- Bandwidth Supply Distribution Fairness Selector: Prioritize low demand cells, Prioritize high demand cells, Prioritize cells with fewer visible sats, Random cell priority.
- Output: Map animation of constellation (single and multi-shell)
- Color-coded hexagonal cells based on defined resolution/territory, supply/demand and metric selector.
- Download buttons for chart (PDF) and data (csv)
- Hexagonal grid summary: Resolution, Number of Cells, Avg Hexagon Edge Length (km), Avg Hexagon Area (sq.km), Diameter of equal-area circle (km), Total Grid Area (sq.km), Population (people)
- Summary Banners: Satellites, Global constellation capacity [Gbps], Satellites over selected territory (grid), Capacity over selected territory [Gbps], Average capacity per territory cell [Gbps], Aircraft Count (all flying), Number of A/C over selected territory (grid), Number of grid cells used by flying A/C, Average IFC bandwidth demand per cell [Mbps], Average A/C flying speed [km/h], Territory area [sq.km], Territory population [inhabitants], Target area population (addressable), Total target area bandwidth [Gbps], Feasible target area bandwidth supply [Gbps].
- Downloadable CSV files and data columns:
- Flight Routes Data: Departure: Airport, Departure: Timezone, Departure: IATA, Departure: ICAO, Departure: Time (local), Arrival: Airport, Arrival: Timezone, Arrival: IATA, Arrival: ICAO, Arrival: Time (local), Airline: Name, Airline: callsign, Airline: IATA, Airline: ICAO, Flight: Number.
- Summary: Timestamp (UTC), Grid: Resolution (h3), Grid: Number of Cells, Grid: Avg Hexagon Edge Length (km), Grid: Avg Hexagon Area (sq.km), Grid: Diameter of equal-area circle (km), Grid: Total Grid Area (sq.km), Grid: Population (people), Target: Min people/sq.km, Target: Max people/sq.km, Target: Capture %, Svc Plan: Datarate Fwd [Mbps], Svc Plan: Datarate Rtn [Mbps], Svc Plan: Overbooking Ratio (to 1), Conditions: Bw Supply Fairness, Conditions: Beam Hopping, Sat-GW Visibility (1=ignore), Territory Satellites, Global Constellation Capacity [Gbps], Satellites over Selected Territory (grid), Capacity over Selected Territory [Gbps], Average Capacity per Territory Cell [Gbps], Territory Area [sq.km], Territory Population [inhabitants], Target Area Population (addressable), Target Area Bandwidth Demand [Gbps], Feasible target area bw supply [Gbps].
- Cell Grid: Timestamp (UTC), H3 Cell Index, Cell Center Lat [deg], Cell Center Lon [deg], Cell Area [sq.km], Cell Population, Cell Population Density [people/sq.km], Aircraft within cell boundaries (count), Cell DL Capacity Demand [Mbps], Cell UL Capacity Demand [Mbps], Cell DL Capacity Supply [Mbps], Cell DL Capacity Supply - Demand [Mbps], Visible Sats (count), Svc Quality (sample), Sample Timelapse [msec], GB Demanded (sample), GB Carried (sample), GB Lost (sample), GB carried / GB Demanded (sample), Simul Start Date-Time (UTC), Simul End Date-Time (UTC), Simul Elapsed Time [sec], GB Demanded (elapsed time), GB Carried (elapsed time), Cell BW Demand Fulfillment Rate [%], Cell Svc Availability [%].
- Satellite Constellation: Timestamp (UTC), Subs-Constellation, Sat Name, Sat Latitude, Sat Longitude, DL User Beams Used (Count), DL User Beams Free (Count), DL User Beam Utilization, DL User Beams Used (List), DL User Beams Free (List), DL User Beams Partially Used - List, Field of View (FoV) Rings in GeoJSON format.
- Notes:
- User settings and simulation results are stored only in the local machine browser memory (NCAT4 users' personalized analysis is not sent to the server)
- Daily flight information is currently supported through NCAT's server API key. In future updates NCAT users may need to use their own keys to access daily flights information.
Dashboard Tool
Displays a summary and visual representations of the NCAT user analysis and simulation results for all above-listed tools.
Non-GEO Business Case Tool
Tool that runs a sensitivity analysis for the capital cost of deployed and usable Mbps/Month and bandwidth breakeven price. This tool currently operates as an Excel file embedded into the NCAT site. Users can interact with the tool online or download the Excel file for local processing.
- Inputs: Number of satellites in constellation, Estimated Lifetime of Satellites (Years), Estimated User Beam Throughput per Satellite (Gbps; down + up), Manufacturing Cost per Satellite, Satellite Mass (Kg), Launch Costs per Kg, target addressability and capture.
- Output: Business-case sensitivity analysis of the capital cost per usable Mbps.
- Probability charts
- Scatter plots illustrating correlations between model inputs and BC output...
- Infographic summarizing tool's analysis
Fiber Optic vs. Satellite Backhaul Business Case Analysis Tool
This tool runs a business-Case sensitivity analysis as a Fiber Optics (FO) versus Satellite (SAT) investment project evaluation. This tool currently operates as an Excel file embedded into the NCAT site. Users can interact with the tool online or download the Excel file for local processing.
- Inputs: Projected BW Use - Mbps New-Network Wide, Average Last-mile CAPEX per connected user, Non-GEO HTS Bandwidth Usage & Cost, GW Hosting Revenues, Terminal cost, Service Revenue and Expenses, Captal Expenditures - Core Fiber & last-mile, NPV analysis inputs (corp. tax rate, debt financing interest rate, discount rate, depreciation)
- Output: Charts and data with resulting EBITDA, FCF, NPV and Profitability including histogram distribution of possible outcomes
- Scatter plots illustrating correlations between model inputs and BC output.
- Monte Carlo simulation samples (1 thousand samples)
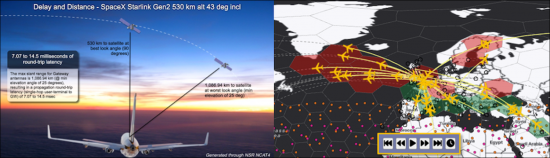
Fiber Optic vs. Satellite Delay Metrics Tool
This tool complements the dynamic latency tool by providing a quick analysis of best-case propagation latency for end-to-end link using Fiber Optics (FO) and LEO Satellite (SAT). This tool currently operates as an Excel file embedded into the NCAT site. Users can interact with the tool online or download the Excel file for local processing.
- Inputs: Location (lat/long) of a two-point link, configurable processing delay per routing/satellite hop, fiber refraction index, constellations orbital characteristics (altitude, min antenna elevation angles)
- Output: Benchmark of four possible SAT scenarios considering use of Inter-satellite links (optical ISLs), terrestrial interconnections and gateway relay stations
- Infographics output for SAT vs. FO scenarios
Exclusion Angles, EPFD Analysis Tool
Calculation of downlink and uplink discrimination angles based on the Equivalent Power Flux Density (EFFD) limits of Article 22 of the ITU Radio Regulations; applicable to FSS (Ku & Ka) frequency bands. This tool currently operates as an Excel file embedded into the NCAT site. Users can interact with the tool online or download the Excel file for local processing.
- Inputs:
- Downlink: Beam Frequency band (GHz), Satellite Peak EIRP density [dB(W/Hz)], Altitude (km), Minimum Antenna Elevation, Co-freq Satellites.
- Uplink: Beam Frequency band (GHz), Maximum number of co-frequency operating NGSO earth stations visible by a GSO satellite, Peak uplink power spectral density fed into the NGSO transmitting earth station [dB(W/Hz)], Antenna Diameter (m), Min. Saturation Flux Density (dBW/m2 ) , E.S. uplink eirp (dBw/Hz), Channel Bandwidth (Hz)
- Output: Calculated minimum uplink and downlink discrimination angles (φ) that should be met, tables calculated following ITU recommendations, antenna radiation pattern charts, Heatmaps of possible (allowed & disallowed) uplink look angles for the user-antenna visibility cone and satellites' field of view, based on site latitude.