|
|
市場調査レポート
商品コード
1184641
バイオ肥料の世界市場:微生物タイプ、作物タイプ、使用法、剤形別 - 2029年までの予測Biofertilizers Market by Microorganism Type (Nitrogen-fixing Microbes, Phosphate Solubilizing Microbes), Crop Type (Cereals & Grains, Oilseeds & Pulses), Mode of Application (Seed Treatment, Fertigation), Form - Global Forecast to 2029 |
||||||
|
|
|||||||
|
● お客様のご希望に応じて、既存データの加工や未掲載情報(例:国別セグメント)の追加などの対応が可能です。 詳細はお問い合わせください。 |
|||||||


| バイオ肥料の世界市場:微生物タイプ、作物タイプ、使用法、剤形別 - 2029年までの予測 |
|
出版日: 2023年01月13日
発行: Meticulous Research
ページ情報: 英文 222 Pages
納期: 即納可能
|
- 全表示
- 概要
- 図表
- 目次
世界のバイオ肥料の市場規模は、2029年までに32億米ドルに達し、2022年~2029年の予測期間中にCAGRで11.5%の成長が予測されています。有機農業の拡大、有機食品に対する需要の増加、環境の安全性についての懸念の高まり、バイオ肥料の使用を促進する政府の取り組みの増加、市場企業の無機的成長戦略に対する重視などが、市場の成長に寄与しています。
当レポートでは、世界のバイオ肥料市場について調査分析し、市場の考察、セグメント分析、地域分析、競合情勢などを提供しています。
目次
第1章 イントロダクション
第2章 調査手法
第3章 エグゼクティブサマリー
第4章 市場の考察
- イントロダクション
- 促進要因
- 抑制要因
- 機会
- 課題
- 世界のバイオ肥料市場に対するCOVID-19の影響
第5章 世界のバイオ肥料市場:微生物タイプ別
- イントロダクション
- 窒素固定微生物
- 根粒菌
- アゾスピリルム
- その他の窒素固定微生物
- リン酸を可溶化・可動化する微生物
- シュードモナス
- バチルス
- その他のリン酸を可溶化・可動化する微生物
- カリウムを可溶化・可動化する微生物
- その他の微生物タイプ
第6章 世界のバイオ肥料市場:作物タイプ別
- イントロダクション
- 穀物
- とうもろこし
- 小麦
- 米
- その他の穀物
- 油糧種子・豆類
- 果物・野菜
- その他の作物タイプ
第7章 世界のバイオ肥料市場:使用法別
- イントロダクション
- 種子処理
- 葉面散布
- 施肥潅漑
- その他の使用法
第8章 世界のバイオ肥料市場:剤形別
- イントロダクション
- 乾燥バイオ肥料
- 液体バイオ肥料
第9章 バイオ肥料市場:地域別
- イントロダクション
- 北米
- 米国
- カナダ
- 欧州
- フランス
- スペイン
- イタリア
- ドイツ
- 英国
- その他の欧州
- アジア太平洋
- 中国
- インド
- オーストラリア
- 日本
- 韓国
- その他のアジア太平洋
- ラテンアメリカ
- ブラジル
- メキシコ
- アルゼンチン
- その他のラテンアメリカ
- 中東・アフリカ
第10章 競合情勢
- イントロダクション
- 主な成長戦略
- 競合ベンチマーキング
第11章 企業プロファイル(事業の概要、財務の概要、製品ポートフォリオ、戦略的発展)
- AgriLife
- American Vanguard Corporation
- Chr. Hansen Holding A/S
- IPL Biologicals Limited
- Koppert B.V
- Lallemand Inc.
- Mapleton Agri Biotec Pty Ltd
- National Fertilizers Limited
- Novozymes A/S
- Rizobacter Argentina SA
- Symborg Corporate, SL
- UPL Limited.
- Vegalab SA
第12章 付録
List of Tables
- Table 1 Global Biofertilizers Market: Impact Analysis of Market Drivers (2022-2029)
- Table 2 Major Agreements in the Biofertilizers Market, 2020-2022
- Table 3 Global Biofertilizers Market: Impact Analysis of Market Restraints (2022-2029)
- Table 4 Global Biofertilizers Market Size, by Microorganism Type, 2020-2029 (USD Million)
- Table 5 Global Nitrogen-Fixing Microbes Market Size, by Type, 2020-2029 (USD Million)
- Table 6 Global Nitrogen-Fixing Microbes Market Size, by Country/Region, 2020-2029 (USD Million)
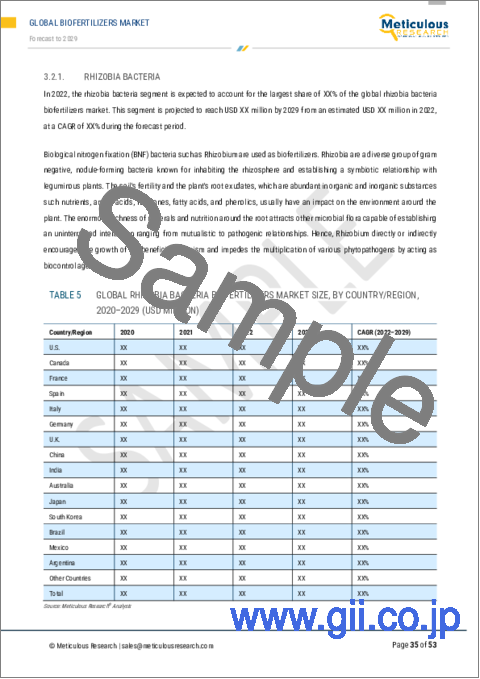
- Table 7 Global Rhizobia Bacteria Biofertilizers Market Size, by Country/Region, 2020-2029 (USD Million)
- Table 8 Global Azospirillum Biofertilizers Market Size, by Country/Region, 2020-2029 (USD Million)
- Table 9 Global Other Nitrogen-Fixing Microbes Market Size, by Country/Region, 2020-2029 (USD Million)
- Table 10 Global Phosphate Solubilizing & Mobilizing Microbes Market Size, by Type, 2020-2029 (USD Million)
- Table 11 Global Phosphate Solubilizing & Mobilizing Microbes Market Size, by Country/Region, 2020-2029 (USD Million)
- Table 12 Global Pseudomonas Biofertilizers Market Size, by Country/Region, 2020-2029 (USD Million)
- Table 13 Global Bacillus Biofertilizers Market Size, by Country/Region, 2020-2029 (USD Million)
- Table 14 Global Other Phosphate Solubilizing & Mobilizing Microbes Market Size, by Country/Region, 2020-2029 (USD Million)
- Table 15 Global Potassium Solubilizing & Mobilizing Microbes Market Size, by Country/Region, 2020-2029 (USD Million)
- Table 16 Global Other Microorganism Types Market Size, by Country/Region, 2020-2029 (USD Million)
- Table 17 Global Biofertilizers Market Size, by Crop Type, 2020-2029 (USD Million)
- Table 18 Global Biofertilizers Market Size for Cereals & Grains, by Type, 2020-2029 (USD Million)
- Table 19 Global Biofertilizers Market Size for Cereals & Grains, by Country/Region, 2020-2029 (USD Million)
- Table 20 Global Biofertilizers Market Size for Maize/Corn, by Country/Region, 2020-2029 (USD Million)
- Table 21 Global Biofertilizers Market Size for Wheat, by Country/Region, 2020-2029 (USD Million)
- Table 22 Global Biofertilizers Market Size for Rice, by Country/Region, 2020-2029 (USD Million)
- Table 23 Global Biofertilizers Market Size for Other Cereals & Grains, by Country/Region, 2020-2029 (USD Million)
- Table 24 Global Biofertilizers Market Size for Oilseeds & Pulses, by Country/Region, 2020-2029 (USD Million)
- Table 25 Global Biofertilizers Market Size for Fruits & Vegetables, by Country/Region, 2020-2029 (USD Million)
- Table 26 Global Biofertilizers Market Size for Other Crop Types, by Country/Region, 2020-2029 (USD Million)
- Table 27 Global Biofertilizers Market Size, by Mode of Application, 2020-2029 (USD Million)
- Table 28 Global Biofertilizers Market Size for Seed Treatment, by Country/Region, 2020-2029 (USD Million)
- Table 29 Global Biofertilizers Market Size for Foliar Spray, by Country/Region, 2020-2029 (USD Million)
- Table 30 Global Biofertilizers Market Size for Fertigation, by Country/Region, 2020-2029 (USD Million)
- Table 31 Global Biofertilizers Market Size for Other Modes of Application, by Country/Region, 2020-2029 (USD Million)
- Table 32 Global Biofertilizers Market Size, by Formulation, 2020-2029 (USD Million)
- Table 33 Dry Biofertilizers Market Size, by Country/Region, 2020-2029 (USD Million)
- Table 34 Liquid Biofertilizers Market Size, by Country/Region, 2020-2029 (USD Million)
- Table 35 Global Biofertilizers Market Size, by Country/Region, 2020-2029 (USD Million)
- Table 36 North America: Biofertilizers Market Size, by Country, 2020-2029 (USD Million)
- Table 37 North America: Biofertilizers Market Size, by Microorganism Type, 2020-2029 (USD Million)
- Table 38 North America: Nitrogen-Fixing Microbes Market Size, by Type, 2020-2029 (USD Million)
- Table 39 North America: Phosphate Solubilizing & Mobilizing Microbes Market Size, by Type, 2020-2029 (USD Million)
- Table 40 North America: Biofertilizers Market Size, by Crop Type, 2020-2029 (USD Million)
- Table 41 North America: Biofertilizers Market Size for Cereals & Grains, by Type, 2020-2029 (USD Million)
- Table 42 North America: Biofertilizers Market Size, by Mode of Application, 2020-2029 (USD Million)
- Table 43 North America: Biofertilizers Market Size, by Formulation, 2020-2029 (USD Million)
- Table 44 U.S.: Organic Crop Production Area, 2020 (Hectares)
- Table 45 U.S.: Biofertilizers Market Size, by Microorganism Type, 2020-2029 (USD Million)
- Table 46 U.S.: Nitrogen-Fixing Microbes Market Size, by Type, 2020-2029 (USD Million)
- Table 47 U.S.: Phosphate Solubilizing & Mobilizing Microbes Market Size, by Type, 2020-2029 (USD Million)
- Table 48 U.S.: Biofertilizers Market Size, by Crop Type, 2020-2029 (USD Million)
- Table 49 U.S.: Biofertilizers Market Size for Cereals & Grains, by Type, 2020-2029 (USD Million)
- Table 50 U.S.: Biofertilizers Market Size, by Mode of Application, 2020-2029 (USD Million)
- Table 51 U.S.: Biofertilizers Market Size, by Formulation, 2020-2029 (USD Million)
- Table 52 Canada: Biofertilizers Market Size, by Microorganism Type, 2020-2029 (USD Million)
- Table 53 Canada: Nitrogen-Fixing Microbes Market Size, by Type, 2020-2029 (USD Million)
- Table 54 Canada: Phosphate Solubilizing & Mobilizing Microbes Market Size, by Type, 2020-2029 (USD Million)
- Table 55 Canada: Biofertilizers Market Size, by Crop Type, 2020-2029 (USD Million)
- Table 56 Canada: Biofertilizers Market Size for Cereals & Grains, by Type, 2020-2029 (USD Million)
- Table 57 Canada: Biofertilizers Market Size, by Mode of Application, 2020-2029 (USD Million)
- Table 58 Canada: Biofertilizers Market Size, by Formulation, 2020-2029 (USD Million)
- Table 59 Europe: Biofertilizers Market Size, by Country/Region, 2020-2029 (USD Million)
- Table 60 Europe: Biofertilizers Market Size, by Microorganism Type, 2020-2029 (USD Million)
- Table 61 Europe: Nitrogen-Fixing Microbes Market Size, by Type, 2020-2029 (USD Million)
- Table 62 Europe: Phosphate Solubilizing & Mobilizing Microbes Market Size, by Type, 2020-2029 (USD Million)
- Table 63 Europe: Biofertilizers Market Size, by Crop Type, 2020-2029 (USD Million)
- Table 64 Europe: Biofertilizers Market Size for Cereals & Grains, by Type, 2020-2029 (USD Million)
- Table 65 Europe: Biofertilizers Market Size, by Mode of Application, 2020-2029 (USD Million)
- Table 66 Europe: Biofertilizers Market Size, by Formulation, 2020-2029 (USD Million)
- Table 67 France: Biofertilizers Market Size, by Microorganism Type, 2020-2029 (USD Million)
- Table 68 France: Nitrogen-Fixing Microbes Market Size, by Type, 2020-2029 (USD Million)
- Table 69 France: Phosphate Solubilizing & Mobilizing Microbes Market Size, by Type, 2020-2029 (USD Million)
- Table 70 France: Biofertilizers Market Size, by Crop Type, 2020-2029 (USD Million)
- Table 71 France: Biofertilizers Market Size for Cereals & Grains, by Type, 2020-2029 (USD Million)
- Table 72 France: Biofertilizers Market Size, by Mode of Application, 2020-2029 (USD Million)
- Table 73 France: Biofertilizers Market Size, by Formulation, 2020-2029 (USD Million)
- Table 74 Spain: Biofertilizers Market Size, by Microorganism Type, 2020-2029 (USD Million)
- Table 75 Spain: Nitrogen-Fixing Microbes Market Size, by Type, 2020-2029 (USD Million)
- Table 76 Spain: Phosphate Solubilizing & Mobilizing Microbes Market Size, by Type, 2020-2029 (USD Million)
- Table 77 Spain: Biofertilizers Market Size, by Crop Type, 2020-2029 (USD Million)
- Table 78 Spain: Biofertilizers Market Size, for Cereals & Grains, by Type, 2020-2029 (USD Million)
- Table 79 Spain: Biofertilizers Market Size, by Mode of Application, 2020-2029 (USD Million)
- Table 80 Spain: Biofertilizers Market Size, by Formulation, 2020-2029 (USD Million)
- Table 81 Italy: Biofertilizers Market Size, by Microorganism Type, 2020-2029 (USD Million)
- Table 82 Italy: Nitrogen-Fixing Microbes Market Size, by Type, 2020-2029 (USD Million)
- Table 83 Italy: Phosphate Solubilizing & Mobilizing Microbes Market Size, by Type, 2020-2029 (USD Million)
- Table 84 Italy: Biofertilizers Market Size, by Crop Type, 2020-2029 (USD Million)
- Table 85 Italy: Biofertilizers Market Size for Cereals & Grains, by Type, 2020-2029 (USD Million)
- Table 86 Italy: Biofertilizers Market Size, by Mode of Application, 2020-2029 (USD Million)
- Table 87 Italy: Biofertilizers Market Size, by Formulation, 2020-2029 (USD Million)
- Table 88 Germany: Biofertilizers Market Size, by Microorganism Type, 2020-2029 (USD Million)
- Table 89 Germany: Nitrogen-Fixing Microbes Market Size, by Type, 2020-2029 (USD Million)
- Table 90 Germany: Phosphate Solubilizing & Mobilizing Microbes Market Size, by Type, 2020-2029 (USD Million)
- Table 91 Germany: Biofertilizers Market Size, by Crop Type, 2020-2029 (USD Million)
- Table 92 Germany: Biofertilizers Market Size for Cereals & Grains, by Type, 2020-2029 (USD Million)
- Table 93 Germany: Biofertilizers Market Size, by Mode of Application, 2020-2029 (USD Million)
- Table 94 Germany: Biofertilizers Market Size, by Formulation, 2020-2029 (USD Million)
- Table 95 U.K.: Biofertilizers Market Size, by Microorganism Type, 2020-2029 (USD Million)
- Table 96 U.K.: Nitrogen-Fixing Microbes Market Size, by Type, 2020-2029 (USD Million)
- Table 97 U.K.: Phosphate Solubilizing & Mobilizing Microbes Market Size, by Type, 2020-2029 (USD Million)
- Table 98 U.K.: Biofertilizers Market Size, by Crop Type, 2020-2029 (USD Million)
- Table 99 U.K.: Biofertilizers Market Size for Cereals & Grains, by Type, 2020-2029 (USD Million)
- Table 100 U.K.: Biofertilizers Market Size, by Mode of Application, 2020-2029 (USD Million)
- Table 101 U.K.: Biofertilizers Market Size, by Formulation, 2020-2029 (USD Million)
- Table 102 Rest of Europe: Biofertilizers Market Size, by Microorganism Type, 2020-2029 (USD Million)
- Table 103 Rest of Europe: Nitrogen-Fixing Microbes Market Size, by Type, 2020-2029 (USD Million)
- Table 104 Rest of Europe: Phosphate Solubilizing & Mobilizing Microbes Market Size, by Type, 2020-2029 (USD Million)
- Table 105 Rest of Europe: Biofertilizers Market Size, by Crop Type, 2020-2029 (USD Million)
- Table 106 Rest of Europe: Biofertilizers Market Size, for Cereals & Grains, by Type, 2020-2029 (USD Million)
- Table 107 Rest of Europe: Biofertilizers Market Size, by Mode of Application, 2020-2029 (USD Million)
- Table 108 Rest of Europe: Biofertilizers Market Size, by Formulation, 2020-2029 (USD Million)
- Table 109 Asia-Pacific: Biofertilizers Market Size, by Country/Region, 2020-2029 (USD Million)
- Table 110 Asia-Pacific: Biofertilizers Market Size, by Microorganism Type, 2020-2029 (USD Million)
- Table 111 Asia-Pacific: Nitrogen-Fixing Microbes Market Size, by Type, 2020-2029 (USD Million)
- Table 112 Asia-Pacific: Phosphate Solubilizing & Mobilizing Microbes Market Size, by Type, 2020-2029 (USD Million)
- Table 113 Asia-Pacific: Biofertilizers Market Size, by Crop Type, 2020-2029 (USD Million)
- Table 114 Asia-Pacific: Biofertilizers Market Size for Cereals & Grains, by Type, 2020-2029 (USD Million)
- Table 115 Asia-Pacific: Biofertilizers Market Size, by Mode of Application, 2020-2029 (USD Million)
- Table 116 Asia-Pacific: Biofertilizers Market Size, by Formulation, 2020-2029 (USD Million)
- Table 117 China: Area Under Organic Cultivation, by Crop Type, 2020 (Hectares)
- Table 118 China: Biofertilizers Market Size, by Microorganism Type, 2020-2029 (USD Million)
- Table 119 China: Nitrogen-Fixing Microbes Market Size, by Type, 2020-2029 (USD Million)
- Table 120 China: Phosphate Solubilizing & Mobilizing Microbes Market Size, by Type, 2020-2029 (USD Million)
- Table 121 China: Biofertilizers Market Size, by Crop Type, 2020-2029 (USD Million)
- Table 122 China: Biofertilizers Market Size for Cereals & Grains, by Type, 2020-2029 (USD Million)
- Table 123 China: Biofertilizers Market Size, by Mode of Application, 2020-2029 (USD Million)
- Table 124 China: Biofertilizers Market Size, by Formulation, 2020-2029 (USD Million)
- Table 125 India: Biofertilizers Market Size, by Microorganism Type, 2020-2029 (USD Million)
- Table 126 India: Nitrogen-Fixing Microbes Market Size, by Type, 2020-2029 (USD Million)
- Table 127 India: Phosphate Solubilizing & Mobilizing Microbes Market Size, by Type, 2020-2029 (USD Million)
- Table 128 India: Biofertilizers Market Size, by Crop Type, 2020-2029 (USD Million)
- Table 129 India: Biofertilizers Market Size for Cereals & Grains, by Type, 2020-2029 (USD Million)
- Table 130 India: Biofertilizers Market Size, by Mode of Application, 2020-2029 (USD Million)
- Table 131 India: Biofertilizers Market Size, by Formulation, 2020-2029 (USD Million)
- Table 132 Australia: Biofertilizers Market Size, by Microorganism Type, 2020-2029 (USD Million)
- Table 133 Australia: Nitrogen-Fixing Microbes Market Size, by Type, 2020-2029 (USD Million)
- Table 134 Australia: Phosphate Solubilizing & Mobilizing Microbes Market Size, by Type, 2020-2029 (USD Million)
- Table 135 Australia: Biofertilizers Market Size, by Crop Type, 2020-2029 (USD Million)
- Table 136 Australia: Biofertilizers Market Size for Cereals & Grains, by Type, 2020-2029 (USD Million)
- Table 137 Australia: Biofertilizers Market Size, by Mode of Application, 2020-2029 (USD Million)
- Table 138 Australia: Biofertilizers Market Size, by Formulation, 2020-2029 (USD Million)
- Table 139 Japan: Biofertilizers Market Size, by Microorganism Type, 2020-2029 (USD Million)
- Table 140 Japan: Nitrogen-Fixing Microbes Market Size, by Type, 2020-2029 (USD Million)
- Table 141 Japan: Phosphate Solubilizing & Mobilizing Microbes Market Size, by Type, 2020-2029 (USD Million)
- Table 142 Japan: Biofertilizers Market Size, by Crop Type, 2020-2029 (USD Million)
- Table 143 Japan: Biofertilizers Market Size for Cereals & Grains, by Type, 2020-2029 (USD Million)
- Table 144 Japan: Biofertilizers Market Size, by Mode of Application, 2020-2029 (USD Million)
- Table 145 Japan: Biofertilizers Market Size, by Formulation, 2020-2029 (USD Million)
- Table 146 South Korea: Biofertilizers Market Size, by Microorganism Type, 2020-2029 (USD Million)
- Table 147 South Korea: Nitrogen-Fixing Microbes Market Size, by Type, 2020-2029 (USD Million)
- Table 148 South Korea: Phosphate Solubilizing & Mobilizing Microbes Market Size, by Type, 2020-2029 (USD Million)
- Table 149 South Korea: Biofertilizers Market Size, by Crop Type, 2020-2029 (USD Million)
- Table 150 South Korea: Biofertilizers Market Size for Cereals & Grains, by Type, 2020-2029 (USD Million)
- Table 151 South Korea: Biofertilizers Market Size, by Mode of Application, 2020-2029 (USD Million)
- Table 152 South Korea: Biofertilizers Market Size, by Formulation, 2020-2029 (USD Million)
- Table 153 RoAPAC: Biofertilizers Market Size, by Microorganism Type, 2020-2029 (USD Million)
- Table 154 RoAPAC: Nitrogen-Fixing Microbes Market Size, by Type, 2020-2029 (USD Million)
- Table 155 RoAPAC: Phosphate Solubilizing & Mobilizing Microbes Market Size, by Type, 2020-2029 (USD Million)
- Table 156 RoAPAC: Biofertilizers Market Size, by Crop Type, 2020-2029 (USD Million)
- Table 157 RoAPAC: Biofertilizers Market Size for Cereals & Grains, by Type, 2020-2029 (USD Million)
- Table 158 RoAPAC: Biofertilizers Market Size, by Mode of Application, 2020-2029 (USD Million)
- Table 159 RoAPAC: Biofertilizers Market Size, by Formulation, 2020-2029 (USD Million)
- Table 160 Latin America: Biofertilizers Market Size, by Country/Region, 2020-2029 (USD Million)
- Table 161 Latin America: Biofertilizers Market Size, by Microorganism Type, 2020-2029 (USD Million)
- Table 162 Latin America: Nitrogen-Fixing Microbes Market Size, by Type, 2020-2029 (USD Million)
- Table 163 Latin America: Phosphate Solubilizing & Mobilizing Microbes Market Size, by Type, 2020-2029 (USD Million)
- Table 164 Latin America: Biofertilizers Market Size, by Crop Type, 2020-2029 (USD Million)
- Table 165 Latin America: Biofertilizers Market Size for Cereals & Grains, by Type, 2020-2029 (USD Million)
- Table 166 Latin America: Biofertilizers Market Size, by Mode of Application, 2020-2029 (USD Million)
- Table 167 Latin America: Biofertilizers Market Size, by Formulation, 2020-2029 (USD Million)
- Table 168 Brazil: Biofertilizers Market Size, by Microorganism Type, 2020-2029 (USD Million)
- Table 169 Brazil: Nitrogen-Fixing Microbes Market Size, by Type, 2020-2029 (USD Million)
- Table 170 Brazil: Phosphate Solubilizing & Mobilizing Microbes Market Size, by Type, 2020-2029 (USD Million)
- Table 171 Brazil: Biofertilizers Market Size, by Crop Type, 2020-2029 (USD Million)
- Table 172 Brazil: Biofertilizers Market Size for Cereals & Grains, by Type, 2020-2029 (USD Million)
- Table 173 Brazil: Biofertilizers Market Size, by Mode of Application, 2020-2029 (USD Million)
- Table 174 Brazil: Biofertilizers Market Size, by Formulation, 2020-2029 (USD Million)
- Table 175 Mexico: Area Under Organic Crop Production, 2020 (Hectares)
- Table 176 Mexico: Biofertilizers Market Size, by Microorganism Type, 2020-2029 (USD Million)
- Table 177 Mexico: Nitrogen-Fixing Microbes Market Size, by Type, 2020-2029 (USD Million)
- Table 178 Mexico: Phosphate Solubilizing & Mobilizing Microbes Market Size, by Type, 2020-2029 (USD Million)
- Table 179 Mexico: Biofertilizers Market Size, by Crop Type, 2020-2029 (USD Million)
- Table 180 Mexico: Biofertilizers Market Size for Cereals & Grains, by Type, 2020-2029 (USD Million)
- Table 181 Mexico: Biofertilizers Market Size, by Mode of Application, 2020-2029 (USD Million)
- Table 182 Mexico: Biofertilizers Market Size, by Formulation, 2020-2029 (USD Million)
- Table 183 Argentina: Biofertilizers Market Size, by Microorganism Type, 2020-2029 (USD Million)
- Table 184 Argentina: Nitrogen-Fixing Microbes Market Size, by Type, 2020-2029 (USD Million)
- Table 185 Argentina: Phosphate Solubilizing & Mobilizing Microbes Market Size, by Type, 2020-2029 (USD Million)
- Table 186 Argentina: Biofertilizers Market Size, by Crop Type, 2020-2029 (USD Million)
- Table 187 Argentina: Biofertilizers Market Size for Cereals & Grains, by Type, 2020-2029 (USD Million)
- Table 188 Argentina: Biofertilizers Market Size, by Mode of Application, 2020-2029 (USD Million)
- Table 189 Argentina: Biofertilizers Market Size, by Formulation, 2020-2029 (USD Million)
- Table 190 RoLATAM: Biofertilizers Market Size, by Microorganism Type, 2020-2029 (USD Million)
- Table 191 RoLATAM: Nitrogen-Fixing Microbes Market Size, by Type, 2020-2029 (USD Million)
- Table 192 RoLATAM: Phosphate Solubilizing & Mobilizing Microbes Market Size, by Type, 2020-2029 (USD Million)
- Table 193 RoLATAM: Biofertilizers Market Size, by Crop Type, 2020-2029 (USD Million)
- Table 194 RoLATAM: Biofertilizers Market Size for Cereals & Grains, by Type, 2020-2029 (USD Million)
- Table 195 RoLATAM: Biofertilizers Market Size, by Mode of Application, 2020-2029 (USD Million)
- Table 196 RoLATAM: Biofertilizers Market Size, by Formulation, 2020-2029 (USD Million)
- Table 197 Middle East & Africa: Biofertilizers Market Size, by Microorganism Type, 2020-2029 (USD Million)
- Table 198 Middle East & Africa: Nitrogen-Fixing Microbes Market Size, by Type, 2020-2029 (USD Million)
- Table 199 Middle East & Africa: Phosphate Solubilizing & Mobilizing Microbes Market Size, by Type, 2020-2029 (USD Million)
- Table 200 Middle East & Africa: Biofertilizers Market Size, by Crop Type, 2020-2029 (USD Million)
- Table 201 Middle East & Africa: Biofertilizers Market Size for Cereals & Grains, by Type, 2020-2029 (USD Million)
- Table 202 Middle East & Africa: Biofertilizers Market Size, by Mode of Application, 2020-2029 (USD Million)
- Table 203 Middle East & Africa: Biofertilizers Market Size, by Formulation, 2020-2029 (USD Million)
- Table 204 Number of Developments by Major Players During 2019-2022
List of Figures
- Figure 1 Market Ecosystem
- Figure 2 Research Process
- Figure 3 Key Secondary Sources
- Figure 4 Primary Research Techniques
- Figure 5 Key Executives Interviewed
- Figure 6 Breakdown of Primary Interviews (Supply-Side & Demand-Side)
- Figure 7 Market Size Estimation
- Figure 8 In 2022, the Nitrogen-Fixing Microbes Segment is Expected to Account for the Largest Share
- Figure 9 In 2022, the Cereals & Grains Segment is Expected to Account for the Largest Share
- Figure 10 In 2022, the Seed Treatment Segment is Expected to Account for the Largest Share
- Figure 11 In 2022, the Dry Biofertilizers Segment is Expected to Account for the Largest Share
- Figure 12 Asia-Pacific to be the Fastest-Growing Regional Market
- Figure 13 Market Dynamics
- Figure 14 Number of Countries Engaged in Organic Farming, 2010-2020
- Figure 15 Development of the Global Organic Foods Market, 2000-2020 (USD Billion)
- Figure 16 Global Biofertilizers Market Size, by Microorganism Type, 2022 Vs. 2029 (USD Million)
- Figure 17 Global Nitrogen-Fixing Microbes Market Size, by Type, 2022 Vs. 2029 (USD Million)
- Figure 18 Global Phosphate Solubilizing & Mobilizing Microbes Market Size, by Type, 2022 Vs. 2029 (USD Million)
- Figure 19 Global Biofertilizers Market Size, by Crop Type, 2022 Vs. 2029 (USD Million)
- Figure 20 Global Organic Cereal Production Area, 2010-2020 (Million Hectares)
- Figure 21 Global Biofertilizers Market Size, by Mode of Application, 2022 Vs. 2029 (USD Million)
- Figure 22 Global Biofertilizers Market Size, by Formulation, 2022 Vs 2029 (USD Million)
- Figure 23 Global Biofertilizers Market Size, by Region, 2022 Vs 2029 (USD Million)
- Figure 24 North America: Biofertilizers Market Snapshot (2022)
- Figure 25 Europe: Biofertilizers Market Snapshot, 2022
- Figure 26 Asia-Pacific: Biofertilizers Market Snapshot (2022)
- Figure 27 Australia: Increase in Land Under Organic Agriculture, 2012-2020 (Million Hectares)
- Figure 28 Latin America: Biofertilizers Market Snapshot (2022)
- Figure 29 Middle East & Africa: Biofertilizers Market Snapshot (2022)
- Figure 30 Key Growth Strategies Adopted by Leading Players, 2019-2022
- Figure 31 Biofertilizer Market: Competitive Benchmarking of Key Players, by Application
- Figure 32 Biofertilizer Market: Competitive Benchmarking of Key Players, by Formulation
- Figure 33 Biofertilizer Market: Competitive Benchmarking of Key Players, by Microorganism Type
- Figure 34 American Vanguard Corporation: Financial Overview (2021)
- Figure 35 Chr. Hansen Holding A/S: Financial Overview (2022)
- Figure 36 National Fertilizers Limited: Financial Overview (2022)
- Figure 37 Novozymes A/S: Financial Overview (2021)
- Figure 38 UPL Limited: Financial Overview (2022)
Biofertilizers Market by Microorganism Type (Nitrogen-fixing Microbes {Rhizobia Bacteria}, Phosphate Solubilizing Microbes), Crop Type (Cereals & Grains, Oilseeds & Pulses), Mode of Application (Seed Treatment, Fertigation), Form-Global Forecast to 2029
The research report titled, 'Biofertilizers Market by Microorganism Type (Nitrogen-fixing Microbes {Rhizobia Bacteria}, Phosphate Solubilizing Microbes), Crop Type (Cereals & Grains, Oilseeds & Pulses), Mode of Application (Seed Treatment, Fertigation), Form-Global Forecast to 2029' provides an in-depth analysis of the biofertilizers market in five major geographies and emphasizes on the current market trends, market size, market shares, recent developments, and forecasts to 2029. In terms of value, the biofertilizers market is projected to reach $3.2 billion by 2029, at a CAGR of 11.5% during the forecast period 2022-2029.
The growth of the biofertilizers market is attributed to the growth in organic farming & the rising demand for organic food, growing concerns regarding environmental safety, increasing government initiatives to promote the use of biofertilizers, and market players' increasing focus on inorganic growth strategies. However, the high demand for synthetic fertilizers and the high cost of biofertilizer production may restrain the growth of this market to a certain extent.
Based on microorganism type, the nitrogen-fixing microbes segment is projected to register the highest CAGR during the forecast period. The growth of this segment is attributed to the hazards associated with the use of chemical fertilizers, the rising number of initiatives by government agencies along with increasing awareness about the need for sustainability in modern agriculture, the rising adoption of advanced farming with drip irrigation and sprinklers, and the growing health concerns. In addition, nitrogen-fixing microbes are a more economical, ecological, and profitable solution to provide nitrogen to plants contributing to their increased adoption.
Based on crop type, in 2022, the cereals & grains segment is expected to account for the largest share of the global biofertilizers market. The large market share of this segment is mainly attributed to the increasing demand for organic and naturally grown cereals & grains, the rising need and focus on minimizing the effect of chemical fertilizer on cereal & grain products, and huge areas of land under organic cereal & grain cultivation.
Based on mode of application, the foliar spray segment is projected to register the highest CAGR during the forecast period. The growth of this segment is attributed to the advantages of the foliar application method, such as uniform application and distribution of nutrients and minimal wastage of biofertilizers. It is one of the most economical and reliable biofertilizer application methods as it requires smaller quantities of biofertilizers.
Based on formulation, in 2022, the dry biofertilizers segment is expected to account for the largest share of the global biofertilizers market. The large market share of this segment is mainly attributed to the rising adoption of dry biofertilizers for lawn & garden applications, their long-lasting effects and high efficiency in all climatic conditions, and the wide & easy availability of raw materials.
Based on geography, Asia-Pacific is slated to register the highest CAGR during the forecast period. The growth of this regional market is mainly driven by the huge areas under organic cultivation, rapid population & income growth, increasing mechanization and irrigation facilities, and the presence of several organic operators. Furthermore, supportive government policies and initiatives by organizations to promote and expand the organics industry contribute to the growth of the biofertilizers market in this region.
Key Players
The key players operating in the global biofertilizers market are AgriLife (India), American Vanguard Corporation (U.S.), Chr. Hansen Holding A/S (Denmark), IPL Biologicals Limited (India), Koppert B.V. (Netherlands), Lallemand Inc. (U.S.), Mapleton Agri Biotec Pt Ltd (Australia), National Fertilizers Limited (India), Novozymes A/S (Denmark), Rizobacter Argentina SA (Argentina), Symborg Corporate, SL (Spain), UPL Limited (India), and Vegalab SA (Switzerland).
Scope of the Report:
Biofertilizers Market, by Microorganism Type
- Nitrogen-fixing Microbes
- Rhizobia Bacteria
- Azospirillum
- Other Nitrogen-fixing Microbes
- Phosphate Solubilizing & Mobilizing Microbes
- Pseudomonas
- Bacillus
- Other Phosphate Solubilizing & Mobilizing Microbes
- Potassium Solubilizing & Mobilizing Microbes
- Other Microorganism Types
Biofertilizers Market, by Crop Type
- Cereals & Grains
- Maize/Corn
- Wheat
- Rice
- Other Cereals & Grains
- Oilseeds & Pulses
- Fruits & Vegetables
- Other Crop Types
Biofertilizers Market, by Mode of Application
- Fertigation
- Foliar Application
- Seed Treatment
- Other Modes of Application
Biofertilizers Market, by Formulation
- Dry Biofertilizers
- Liquid Biofertilizers
Biofertilizers Market, by Geography
- North America
- U.S.
- Canada
- Europe
- France
- Spain
- Italy
- Germany
- U.K.
- Rest of Europe
- Asia-Pacific
- China
- India
- Japan
- Australia
- South Korea
- Rest of Asia-Pacific (RoAPAC)
- Latin America
- Brazil
- Mexico
- Argentina
- Rest of Latin America (RoLATAM)
- Middle East & Africa
Key Questions Answered in the Report-
- Which are the high-growth market segments based on microorganism type, crop type, mode of application, formulation, and region/country?
- What was the historical market size for biofertilizers across the globe?
- What are the market forecasts and estimates for 2022-2029?
- What are the major drivers, restraints, opportunities, and challenges for the global biofertilizers market?
- Who are the major players in the global biofertilizers market?
- How is the competitive landscape, and who are the market leaders in the global biofertilizers market?
- What are the recent developments in the global biofertilizers market?
- What are the geographical trends and high-growth regions/countries?
- Who are the local emerging players in the global biofertilizers market, and how do they compete with the global players?
TABLE OF CONTENTS
1. Introduction
- 1.1. Market Definition
- 1.2. Market Ecosystem
- 1.3. Currency
- 1.4. Key Stakeholders
2. Research Methodology
- 2.1. Research Process
- 2.2. Data Collection & Validation
- 2.2.1. Secondary Research
- 2.2.2. Primary Research
- 2.3. Market Assessment
- 2.3.1. Market Size Estimation
- 2.3.1.1. Bottom-Up Approach
- 2.3.1.2. Top-Down Approach
- 2.3.1.3. Growth Forecast
- 2.3.1. Market Size Estimation
- 2.4. Assumptions for the Study
- 2.5. Limitations of the Study
3. Executive Summary
- 3.1. Introduction
- 3.2. Segmental Analysis
- 3.2.1. Biofertilizers Market Analysis: by Microorganism Type
- 3.2.2. Biofertilizers Market Analysis: by Crop Type
- 3.2.3. Biofertilizers Market Analysis: by Mode of Application
- 3.2.4. Biofertilizers Market Analysis: by Formulation
- 3.3. Regional Analysis
- 3.4. Key Players
4. Market Insights
- 4.1. Introduction
- 4.2. Drivers
- 4.2.1. Growth in Organic Farming & the Rising Demand for Organic Food
- 4.2.2. Growing Concerns Regarding Environmental Safety
- 4.2.3. Increasing Government Initiatives to Promote the use of Biofertilizers
- 4.2.4. Market Players' Increasing Focus on Inorganic Growth Strategies
- 4.3. Restraints
- 4.3.1. High Demand for Synthetic Fertilizers
- 4.3.2. High Cost of Biofertilizer Production
- 4.4. Opportunities
- 4.4.1. Growing Adoption of Fertilizers in Emerging Economies
- 4.5. Challenges
- 4.5.1. Lengthy Product Registration & Approval Processes
- 4.6. The Impact of Covid-19 on the Global Biofertilizers Market
5. Global Biofertilizers Market, by Microorganism Type
- 5.1. Introduction
- 5.2. Nitrogen-Fixing Microbes
- 5.2.1. Rhizobia Bacteria
- 5.2.2. Azospirillum
- 5.2.3. Other Nitrogen-Fixing Microbes
- 5.3. Phosphate Solubilizing & Mobilizing Microbes
- 5.3.1. Pseudomonas
- 5.3.2. Bacillus
- 5.3.3. Other Phosphate Solubilizing & Mobilizing Microbes
- 5.4. Potassium Solubilizing & Mobilizing Microbes
- 5.5. Other Microorganism Types
6. Global Biofertilizers Market, by Crop Type
- 6.1. Introduction
- 6.2. Cereals & Grains
- 6.2.1. Maize/Corn
- 6.2.2. Wheat
- 6.2.3. Rice
- 6.2.4. Other Cereals & Grains
- 6.3. Oilseeds & Pulses
- 6.4. Fruits & Vegetables
- 6.5. Other Crop Types
7. Global Biofertilizers Market, by Mode of Application
- 7.1. Introduction
- 7.2. Seed Treatment
- 7.3. Foliar Spray
- 7.4. Fertigation
- 7.5. Other Modes of Application
8. Global Biofertilizers Market, by Formulation
- 8.1. Introduction
- 8.2. Dry Biofertilizers
- 8.3. Liquid Biofertilizers
9. Biofertilizers Market, by Geography
- 9.1. Introduction
- 9.2. North America
- 9.2.1. U.S.
- 9.2.2. Canada
- 9.3. Europe
- 9.3.1. France
- 9.3.2. Spain
- 9.3.3. Italy
- 9.3.4. Germany
- 9.3.5. U.K.
- 9.3.6. Rest of Europe (RoE)
- 9.4. Asia-Pacific
- 9.4.1. China
- 9.4.2. India
- 9.4.3. Australia
- 9.4.4. Japan
- 9.4.5. South Korea
- 9.4.6. Rest of Asia-Pacific (RoAPAC)
- 9.5. Latin America
- 9.5.1. Brazil
- 9.5.2. Mexico
- 9.5.3. Argentina
- 9.5.4. Rest of Latin America (RoLATAM)
- 9.6. Middle East & Africa
10. Competitive Landscape
- 10.1. Introduction
- 10.2. Key Growth Strategies
- 10.3. Competitive Benchmarking
11. Company Profile (Business Overview, Financial Overview, Product Portfolio, and Strategic Developments)
- 11.1. AgriLife
- 11.2. American Vanguard Corporation
- 11.3. Chr. Hansen Holding A/S
- 11.4. IPL Biologicals Limited
- 11.5. Koppert B.V
- 11.6. Lallemand Inc.
- 11.7. Mapleton Agri Biotec Pty Ltd
- 11.8. National Fertilizers Limited
- 11.9. Novozymes A/S
- 11.10. Rizobacter Argentina SA
- 11.11. Symborg Corporate, SL
- 11.12. UPL Limited.
- 11.13. Vegalab SA
12. Appendix
- 12.1. Questionnaire
- 12.2. Available Customization