|
|
市場調査レポート
商品コード
1087283
癌の併用免疫療法の世界市場:市場の機会と臨床試験に関する洞察(2028年)Global Combination Cancer Immunotherapy Market Opportunity & Clinical Trials Insight 2028 |
||||||
|
|
|||||||


| 癌の併用免疫療法の世界市場:市場の機会と臨床試験に関する洞察(2028年) |
|
出版日: 2022年06月01日
発行: KuicK Research
ページ情報: 英文 1320 Pages
納期: 即日から翌営業日
|
- 全表示
- 概要
- 図表
- 目次
世界の癌の併用免疫療法の市場規模は、2028年までに150億米ドルを超えると予測されています。これは主に、高齢者人口の増加や様々な癌の有病率の急増に起因しています。
当レポートでは、世界の癌の併用免疫療法市場について調査し、市場の概要とともに、適応別、地域別の動向、および市場に参入する企業のプロファイルなどを提供しています。
目次
第1章 癌の併用免疫療法-癌研究の新時代
第2章 癌の併用免疫療法の必要性
第3章 臨床的および商業的に承認された癌の併用免疫療法
第4章 世界の癌の併用免疫療法の市場規模と動向分析
第5章 世界の癌の併用免疫療法の市場規模と動向分析、適応別
- 乳癌
- 腎臓癌
- 肺癌
- 肝臓癌
- 胃癌
- リンパ腫
- 前立腺癌
- 黒色腫
- 結腸直腸癌
- 白血病
- 子宮頸癌
- 膵臓癌
- 卵巣癌
- 頭頸部癌
- 多発性骨髄腫
第6章 世界の癌の併用免疫療法の市場規模と動向分析、地域別
- 米国
- 欧州
- 中国
- 日本
- オーストラリア
- 韓国
- カナダ
- 英国
第7章 癌の併用免疫療法で承認された免疫チェックポイント阻害剤-臨床的および商業的洞察
第8章 癌の併用免疫療法で承認された抗体薬物複合体-臨床的および商業的洞察
第9章 癌の併用免疫療法で承認されたモノクローナル抗体-臨床的および商業的洞察
第10章 癌の併用免疫療法の臨床試験の概要
- 企業別
- 国別
- 患者セグメント/病期別
- 相別
第11章 癌の併用免疫療法の臨床試験と企業別、国別、適応別、相別の特許インサイト
- 調査
- 前臨床
- 臨床
- 第I相
- 第I/II相
- 第II相
- 第II/III相
- 第III相
- 事前登録
- 登録済み
第12章 市販の癌の併用免疫療法の臨床および特許の洞察、企業別、国別、適応別
第13章 免疫チェックポイント阻害剤の有効性を高めるための併用戦略
第14章 臨床腫瘍学における治療用抗体の組み合わせ
第15章 併用療法における癌ワクチンの関与
第16章 併用療法における抗体薬物複合体
第17章 CART細胞療法との併用療法
第18章 腫瘍溶解性ウイルス併用療法
第19章 競合情勢
- AbbVie
- Agenus
- Akeso Pharmaceutical
- Amgen
- Arbutus Biopharma
- AstraZeneca
- AUM Bioscience
- BeiGene
- BioNTech
- Bristol Myers Squibb
- Candel Therapeutics
- Eli Lilly
- Elicio Therapeutics
- Fate Therapeutics
- GlaxoSmithKline
- Harpoon Therapeutics
- Immutep
- Imugene
- Intensity Therapeutics
- Janssen Pharmaceuticals
- Merck
- MorphoSys
- Novocure
- Novartis
- Nykode Therapeutics
- Ono Pharmaceutical
- Oxford Biotherapeutics
- Pfizer
- Regeneron
- Roche
- Sanofi
- Seagen
- Shanghai Junshi Biosciences
- Takeda Pharmaceuticals
- Qurient
List of Tables
- Table 2-1: Advantages of Immunotherapy & their Combinations
- Table 3-1: Global -- Approval Combination Cancer Immunotherapy by Indication
- Table 13-1: Ongoing Clinical Trial in Immune Checkpoint Inhibitor Combination Therapy
- Table 13-2: ICI Combination Therapy with Chemotherapy in Preclinical Models
- Table 13-3: Ongoing Clinical Trials in ICI Combined with Targeted Therapies
- Table 14-1: Ongoing Clinical Trials in Monoclonal Antibody Combination Therapies
- Table 14-2: Ongoing Clinical Trials in Bispecific Antibody Combination Therapies
- Table 15-1: Ongoing Clinical Studies Evaluating Vaccines in Combination Therapy
- Table 16-1: Ongoing Clinical Studies Evaluating Antibody Drug Conjugate in Combination Therapy
- Table 17-1: Preclinical Studies Combining CAR T Cells with Oncolytic Virus
- Table 17-2: Ongoing & Completed Clinical Trials Testing Combination Therapies with CAR T Cells
- Table 18-1: Current Clinical Trials of Combination Therapy with OVs and Immune Checkpoint Inhibitors
- Table 18-2: Mechanism of Synergy of Chemotherapy & Oncolytics Virus Combination
List of Figures
- Figure 1-1: Currently Available Immunotherapeutic Approaches
- Figure 1-2: Basis of Combination Immunotherapy
- Figure 4-1: Global - Combination Cancer Immunotherapy Market Size (US$ Billion), 2020 & 2021
- Figure 4-2: Global - Cancer Combination Immunotherapy Market by Indication (US$ Million), 2021
- Figure 4-3: Global - Cancer Combination Immunotherapy Market by Indication (%), 2021
- Figure 4-4: Global - Cancer Combination Immunotherapy Market by Region (US$ Million), 2021
- Figure 4-5: Global - Cancer Combination Immunotherapy Market by Region (%), 2021
- Figure 4-6: Global - Combination Cancer Immunotherapy Market Size (US$ Billion), 2022 - 2028
- Figure 5-1: Global - Breast Cancer Incidences & Deaths (Million), 2020 & 2025
- Figure 5-2: Global - Breast Combination Cancer Immunotherapy Market Size (US$ Billion), 2020 & 2021
- Figure 5-3: Global - Breast Combination Cancer Immunotherapy Market Size (US$ Million), 2022 - 2028
- Figure 5-4: Global - Kidney Combination Cancer Immunotherapy Market Size (US$ Million), 2020 & 2021
- Figure 5-5: Global - Kidney Combination Cancer Immunotherapy Market Size (US$ Million), 2022 - 2028
- Figure 5-6: Global - Lung Combination Cancer Immunotherapy Market Size (US$ Million), 2020 & 2021
- Figure 5-7: Global - Lung Combination Cancer Immunotherapy Market Size (US$ Million), 2022 - 2028
- Figure 5-8: Global - Liver Combination Cancer Immunotherapy Market Size (US$ Million), 2020 & 2021
- Figure 5-9: Global - Liver Combination Cancer Immunotherapy Market Size (US$ Million), 2022 - 2028
- Figure 5-10: Global - Gastric Combination Cancer Immunotherapy Market Size (US$ Million), 2021 - 2028
- Figure 5-11: Global - Lymphoma Combination Immunotherapy Market Size (US$ Million), 2020 & 2021
- Figure 5-12: Global - Lymphoma Combination Immunotherapy Market Size (US$ Million), 2022 - 2028
- Figure 5-13: Global - Prostate Combination Immunotherapy Market Size (US$ Million), 2022 - 2028
- Figure 5-14: Global - Melanoma Combination Immunotherapy Market Size (US$ Million), 2020 & 2021
- Figure 5-15: Global - Melanoma Combination Immunotherapy Market Size (US$ Million), 2022 - 2028
- Figure 5-16: Global - Colorectal Combination Cancer Immunotherapy Market Size ( US$ Million), 2020 & 2021
- Figure 5-17: Global - Colorectal Combination Cancer Immunotherapy Market Size (US$ Million), 2022 - 2028
- Figure 5-18: Global - Leukemia Combination Immunotherapy Market Size (US$ Million), 2020 & 2021
- Figure 5-19: Global - Leukemia Combination Immunotherapy Market Size (US$ Million), 2022 - 2028
- Figure 5-20: Global - Cervical Combination Cancer Immunotherapy Market Size (US$ Million), 2020 & 2021
- Figure 5-21: Global - Cervical Combination Cancer Immunotherapy Market Size (US$ Million), 2022 - 2028
- Figure 5-22: Global - Pancreatic Combination Cancer Immunotherapy Market Size (US$ Million), 2020 & 2021
- Figure 5-23: Global - Pancreatic Combination Cancer Immunotherapy Market Size (US$ Million), 2022 - 2028
- Figure 5-24: Global - Ovarian Combination Cancer Immunotherapy Market Size (US$ Million), 2020 & 2021
- Figure 5-25: Global - Ovarian Combination Cancer Immunotherapy Market Size (US$ Million), 2022 - 2028
- Figure 5-26: Global - Head & Neck Combination Cancer Immunotherapy Market Size (US$ Million), 2020 & 2021
- Figure 5-27: Global - Head & Neck Combination Cancer Immunotherapy Market Size (US$ Million), 2022 - 2028
- Figure 5-28: Global - Multiple Myeloma Combination Immunotherapy Market Size (US$ Million), 2020 & 2021
- Figure 5-29: Global - Multiple Myeloma Combination Immunotherapy Market Size (US$ Million), 2022 - 2028
- Figure 6-1: US - Combination Cancer Immunotherapy Market Size (US$ Million), 2020 & 2021
- Figure 6-2: US vs. ROW - Combination Cancer Immunotherapy Market Size (US$ Million), 2021
- Figure 6-3: US - Combination Cancer Immunotherapy Market Size (US$ Million), 2022 - 2028
- Figure 6-4: Europe - Combination Cancer Immunotherapy Market Size (US$ Million), 2020 & 2021
- Figure 6-5: Europe vs. ROW - Combination Cancer Immunotherapy Market Size (US$ Million), 2021
- Figure 6-6: Europe vs. ROW - Combination Cancer Immunotherapy Market Size (US$ Million), 2021
- Figure 6-7: Europe - Combination Cancer Immunotherapy Market Size (US$ Million), 2022 - 2028
- Figure 6-8: China - Combination Cancer Immunotherapy Market Size (US$ Million), 2020 & 2021
- Figure 6-9: China vs. ROW - Combination Cancer Immunotherapy Market Size (US$ Million), 2021
- Figure 6-10: China vs. ROW - Combination Cancer Immunotherapy Market Size (US$ Million), 2021
- Figure 6-11: China - Combination Cancer Immunotherapy Market Size (US$ Million), 2022 - 2028
- Figure 6-12: Japan - Combination Cancer Immunotherapy Market Size (US$ Million), 2020 & 2021
- Figure 6-13: Japan vs. ROW - Combination Cancer Immunotherapy Market Size (US$ Million), 2021
- Figure 6-14: Japan vs. ROW - Combination Cancer Immunotherapy Market Size (US$ Million), 2021
- Figure 6-15: Japan - Combination Cancer Immunotherapy Market Size (US$ Million), 2022 - 2028
- Figure 6-16: Australia - Combination Cancer Immunotherapy Market Size (US$ Million), 2020 & 2021
- Figure 6-17: Australia vs. ROW - Combination Cancer Immunotherapy Market Size (US$ Million), 2021
- Figure 6-18: Australia vs. ROW - Combination Cancer Immunotherapy Market Size (US$ Million), 2021
- Figure 6-19: Australia - Combination Cancer Immunotherapy Market Size (US$ Million), 2022 - 2028
- Figure 6-20: South Korea - Combination Cancer Immunotherapy Market Size (US$ Million), 2020 & 2021
- Figure 6-21: South Korea - Combination Cancer Immunotherapy Market Size (US$ Million), 2022 - 2028
- Figure 6-22: Canada - Combination Cancer Immunotherapy Market Size (US$ Million), 2020 & 2021
- Figure 6-23: Canada vs. ROW - Combination Cancer Immunotherapy Market Size (US$ Million), 2021
- Figure 6-24: Canada vs. ROW - Combination Cancer Immunotherapy Market Size (US$ Million), 2021
- Figure 6-25: Canada - Combination Cancer Immunotherapy Market Size (US$ Million), 2022 - 2028
- Figure 6-26: UK - Combination Cancer Immunotherapy Market Size (US$ Million), 2020 & 2021
- Figure 6-27: UK vs. ROW - Combination Cancer Immunotherapy Market Size (US$ Million), 2021
- Figure 6-28: UK vs. ROW - Combination Cancer Immunotherapy Market Size (US$ Million), 2021
- Figure 6-29: UK - Combination Cancer Immunotherapy Market Size (US$ Million), 2022 - 2028
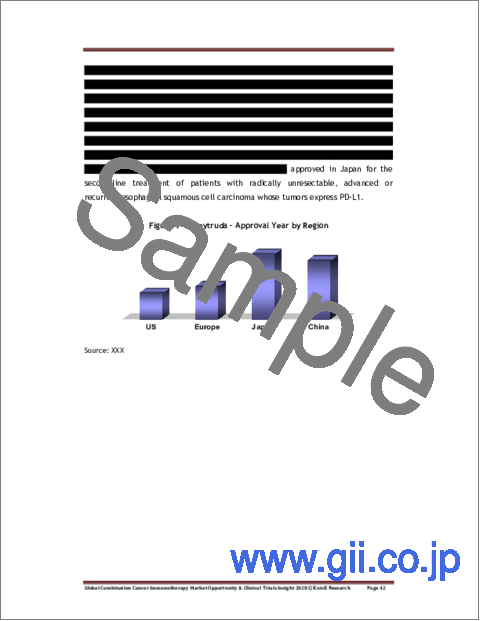
- Figure 7-1: Keytruda - Approval Year by Region
- Figure 7-2: Keytruda Combination - FDA Approval Year by Indication
- Figure 7-3: Keytruda Combination - EMA Approval Year by Indication
- Figure 7-4: Keytruda - Patent Expiration Year by Region
- Figure 7-5: US - Price for 4ml, 8ml Supply & Price Per ml of Keytruda Intravenous Injection (US$), June'2022
- Figure 7-6: UK - Price for 4ml & Price Per ml of Keytruda 100mg Intravenous Injection (GBP/US$), June'2022
- Figure 7-7: Keytruda - Duration of Single Treatment Cycle & Full Treatment of Melanoma & Other Cancers (Weeks),
- Figure 7-8: Keytruda - Cost of Single & Full Treatment using Solution of Injection (US$), June'2022
- Figure 7-9: Opdivo - Approval Year by Region
- Figure 7-10: Opdivo Combination - FDA Approval by Indication
- Figure 7-11: Opdivo - Patent Expiration Year by Region
- Figure 7-12: US - Price for 4ml Supply & Price Per ml of Opdivo 10mg/ml Intravenous Injection (US$), June'2022
- Figure 7-13: US - Price for 10 ml Supply & Price Per ml of Opdivo 10mg/ml Intravenous Injection (US$), June'2022
- Figure 7-14: US - Price for 12 ml Supply & Price Per ml of Opdivo 10mg/ml Intravenous Injection (US$), June'2022
- Figure 7-15: US - Price for 24 ml Supply & Price Per ml of Opdivo 10mg/ml Intravenous Injection (US$), June'2022
- Figure 7-16: UK - Price for 4 ml Supply & Price Per ml of Opdivo 10mg/ml Intravenous Injection (GBP/US$), June'2022
- Figure 7-17: UK - Price for 10ml Supply & Price Per ml of Opdivo 10mg/ml Intravenous Injection (GBP/US$), June'2022
- Figure 7-18: UK - Price for 24ml Supply & Price Per ml of Opdivo 10mg/ml Intravenous Injection (GBP/US$), June'2022
- Figure 7-19: Opdivo Combination Therapy - Single Treatment Cycle & Full Treatment Average Cost (US$), June'2022
- Figure 7-20: Yervoy Combination - FDA Approval Year by Region
- Figure 7-21: Yervoy - Approval Year by Region
- Figure 7-22: Yervoy - US & Europe Exclusivity Expiration Year
- Figure 7-23: US - Price for 10ml Supply & Price Per ml of Yervoy 5mg/ml Intravenous Injection (US$), June'2022
- Figure 7-24: US - Price for 40ml Supply & Price Per ml 5mg/ml Yervoy Intravenous Injection (US$), June'2022
- Figure 7-25: UK - Price for 10ml & Price Per ml of Yervoy 50mg Intravenous Injection (GBP/US$), June'2022
- Figure 7-26: UK - Price for 40ml & Price Per ml of Yervoy 200mg Intravenous Injection (GBP/US$), June'2022
- Figure 7-27: Yervoy - Single Treatment Cycle & Full Treatment Average Cost for NSCLC (US$), June'2022
- Figure 7-28: Yervoy & Opdivo Combination - Single Treatment Cycle & Full Treatment Average Cost for NSCLC (US$), June'2022
- Figure 7-29: Imfinzi - Approval Year by Region
- Figure 7-30: Imfinzi - FDA Approval & Patent Expiration Year
- Figure 7-31: US- Price for a Supply of 2.4ml & Price Per ml of Imfinzi Solution for Injection (US$), June'2022
- Figure 7-32: US - Price for a Supply of 10 ml & Price Per ml of Imfinzi Solution for Injection (US$), June'2022
- Figure 7-33: UK- Price for a Supply of 2.4ml & Price Per ml of Imfinzi Solution for Injection (GBP/US$), June'2022
- Figure 7-34: UK- Price for a Supply of 10ml & Price Per ml of Imfinzi Solution for Injection (GBP/US$), June'2022
- Figure 7-35: Imfinzi Combination Therapy - Single Treatment Cycle & Full Treatment Average Cost (US$), June'2022
- Figure 7-36: Tecentriq - Approval Year by Region
- Figure 7-37: Tecentriq Combination - FDA Approval Year by Indication
- Figure 7-38: US- Price for 14ml Supply & Price Per ml of Tecentriq 840mg/14ml Intravenous Injection (US$), June'2022
- Figure 7-39: US - Price for 20ml Supply & Price Per ml of Tecentriq 1200mg/20ml Intravenous Injection (US$), June'2022
- Figure 7-40: UK- Price for a Supply of 20ml & Price Per ml of Tecentriq Solution for Injection (GBP/US$), June'2022
- Figure 7-41: UK- Price for a Supply of 14ml & Price Per ml of Tecentriq Solution for Injection (GBP/US$), June'2022
- Figure 7-42: Tecentriq - Average Cost of Single Treatment Cycle & Annual Treatment using 840mg/2 Week Dose (US$), June'2022
- Figure 7-43: Tecentriq - Average Cost of Single Treatment Cycle & Annual Treatment using 1200mg/3 Week Dose (US$), June'2022
- Figure 7-44: Tecentriq - Average Cost of Single Treatment Cycle & Annual Treatment using 1680mg/4 Week Dose (US$), June'2022
- Figure 7-45: Tuoyi - NMPA Approval by Indication
- Figure 7-46: China- Price for a Supply of 2ml & Price Per ml of Tuoyi Solution for Injection (Yuan/US$), June'2022
- Figure 7-47: China- Price for a Supply of 2.5ml & Price Per ml of Tuoyi Solution for Injection (Yuan/US$), June'2022
- Figure 7-48: China- Price for a Supply of 6ml & Price Per ml of Tuoyi Solution for Injection (Yuan/US$), June'2022
- Figure 7-49: Tislelizumab - NMPA Approval by Indication
- Figure 7-50: US - Opdualag FDA Orphan Designation & Approval Year
- Figure 7-51: US - Price for 20ml Supply & Price Per ml of Opdualag Intravenous Injection (US$), June'2022
- Figure 7-52: Global - Keytruda Sales (US$ Million), Q1'2021 & Q1'2022
- Figure 7-53: Global - Keytruda Sales Value (US$ Billion), 2018 - 2021
- Figure 7-54: Global - Keytruda Quarterly Sales Value (US$ Billion), 2021
- Figure 7-55: Global - Keytruda Quarterly Sales Value (US$ Billion), 2020
- Figure 7-56: Global - Opdivo Sales Value by Region (US$ Million), Q1'2022
- Figure 7-57: Global - Opdivo Sales Value by Region (%), Q1'2022
- Figure 7-58: Global - Opdivo Sales Value (US$ Million), 2018 - 2021
- Figure 7-59: US - Opdivo Sales Value (US$ Million), 2018 - 2021
- Figure 7-60: Global - Opdivo Sales Value by Region (US$ Million), 2021
- Figure 7-61: Global - Opdivo Sales Value by Region (%), 2021
- Figure 7-62: Global - Opdivo Quarterly Sales Value (US$ Million), 2021
- Figure 7-63: US - Opdivo Quarterly Sales Value (US$ Million), 2021
- Figure 7-64: Global - Opdivo Quarterly Sales Value (US$ Million), 2020
- Figure 7-65: US - Opdivo Quarterly Sales Value (US$ Million), 2020
- Figure 7-66: Global - Yervoy Sales Value by Region (US$ Million), Q1'2022
- Figure 7-67: Global - Yervoy Sales Value by Region (%), Q1'2022
- Figure 7-68: Global - Yervoy Sales Value (US$ Million), 2018 - 2021
- Figure 7-69: US - Yervoy Sales Value (US$ Million), 2018 - 2021
- Figure 7-70: Yervoy - Sales Value by Region (US$ Million), 2021
- Figure 7-71: Yervoy - Sales Value by Region (US$ Million), 2021
- Figure 7-72: Global - Yervoy Quarterly Sales Value (US$ Million), 2021
- Figure 7-73: US - Yervoy Quarterly Sales Value (US$ Million), 2021
- Figure 7-74: Global - Yervoy Quarterly Sales Value (US$ Million), 2020
- Figure 7-75: US - Yervoy Quarterly Sales Value (US$ Million), 2020
- Figure 7-76: Imfinzi - Sales Value by Region (US$ Million), Q1'2022
- Figure 7-77: Imfinzi - Sales Value by Region (US$ Million), Q1'2022
- Figure 7-78: Global - Imfinzi Sales Value (US$ Million), 2019 - 2021
- Figure 7-79: US - Imfinzi Sales Value (US$ Million), 2019 - 2021
- Figure 7-80: Europe - Imfinzi Sales Value (US$ Million), 2019 - 2021
- Figure 7-81: Imfinzi - Sales Value by Region (US$ Million), 2021
- Figure 7-82: Imfinzi - Sales Value by Region (%), 2021
- Figure 7-83: Global - Imfinzi Quarterly Sales Value US$ Million), 2021
- Figure 7-84: US - Imfinzi Quarterly Sales Value US$ Million), 2021
- Figure 7-85: Global - Imfinzi Quarterly Sales Value US$ Million), 2020
- Figure 7-86: US - Imfinzi Quarterly Sales Value US$ Million), 2020
- Figure 7-87: Tecentriq - Sales Value by Region (US$/CHF Million), Q1'2022
- Figure 7-88: Tecentriq - Sales Value by Region (%), Q1'2022
- Figure 7-89: Global - Tecentriq Sales Value (US$/CHF Million), 2019 - 2021
- Figure 7-90: US - Tecentriq Sales Value (US$/CHF Million), 2019 - 2021
- Figure 7-91: Europe - Tecentriq Sales Value (US$/CHF Million), 2019 - 2021
- Figure 7-92: Japan - Tecentriq Sales Value (US$/CHF Million), 2019 - 2021
- Figure 7-93: ROW - Tecentriq Sales Value (US$/CHF Million), 2019 - 2021
- Figure 7-94: Tecentriq - Sales Value by Region (US$/CHF Million), 2021
- Figure 7-95: Tecentriq - Sales Value by Region (%), 2021
- Figure 7-96: Global - Tecentriq Quarterly Sales Value (US$/CHF Million), 2021
- Figure 7-97: US - Tecentriq Quarterly Sales Value (US$/CHF Million), 2021
- Figure 7-98: US - Tecentriq Quarterly Sales Value (US$/CHF Million), 2020
- Figure 8-1: Adcetris Combination - Approval Year by Region
- Figure 8-2: Adcetris Combination - Approval Year in Hodgkin Lymphoma by Region
- Figure 8-3: Adcetris Combination - Approval Year in Large Cell Lymphoma by Region
- Figure 8-4: Adcetris - Patent Expiration by Region
- Figure 8-5: UK - Cost of Supply of Adcetris 50mg Intravenous Powder (GBP/US$), June'2022
- Figure 8-6: Adcetris - Cost of Supply of Vial for Injection by Region (US$), June'2022
- Figure 8-7: Adcetris - Duration of Single Treatment Cycle & Full Treatment of Stage III and IV Classical Hodgkin Lymphoma (Weeks)
- Figure 8-8: Adcetris - Maximum Cost of Single Treatment Cycle & Full Treatment of Stage III and IV Classical Hodgkin Lymphoma (US$), June'2022
- Figure 8-9: Adcetris - Duration of Single Treatment Cycle & Full Treatment of Classical Hodgkin Lymphoma (Weeks)
- Figure 8-10: Adcetris - Maximum Cost of Single Treatment Cycle & Full Treatment of Classical Hodgkin Lymphoma (US$), June'2022
- Figure 8-11: Adcetris - Maximum Cost of Single Treatment Cycle & Full Treatment of Previously Untreated Systemic ALCL or Other CD30 T-Cell Lymphomas (US$), June'2022
- Figure 8-12: Polivy Combination - Approval Year by Region
- Figure 8-13: US - Price for Single Unit of Polivy 30mg & 140mg Intravenous Powder for Injection (US$), June'2022
- Figure 8-14: UK - Price for Single Unit of Polivy 30mg & 140mg Intravenous Powder for Injection (GBP/US$), June'2022
- Figure 8-15: Polivy - Duration of Single Treatment Cycle & Full Treatment (Weeks)
- Figure 8-16: Polivy - Cost of Single Dose, Single Treatment Cycle & Full Treatment of DLBCL (US$), June'2022
- Figure 8-17: Global - Adcetris Sales (US$ Million), Q1'2021 & Q1'2022
- Figure 8-18: Global - Adcetris Sales Value (US$ Million), 2018 - 2021
- Figure 8-19: Global - Adcetris Quarterly Sales (US$ Million), 2021
- Figure 8-20: Global - Adcetris Quarterly Sales (US$ Million), 2020
- Figure 8-21: Polivy - Sales Value by Region (US$/CHF Million), Q1'2022
- Figure 8-22: Polivy - Sales Value by Region (US$/CHF Million), Q1'2022
- Figure 8-23: Global - Polivy Sales Value (US$/CHF Million), 2019 - 2021
- Figure 8-24: Global - Polivy Quarterly Sales Value (US$/CHF Million), 2021
- Figure 8-25: US - Polivy Quarterly Sales Value (US$/CHF Million), 2021
- Figure 8-26: Europe - Polivy Quarterly Sales Value (US$/CHF Million), 2021
- Figure 8-27: Japan - Polivy Quarterly Sales Value (US$/CHF Million), Q2-Q4'2021
- Figure 8-28: ROW - Polivy Quarterly Sales Value (US$/CHF Million), 2021
- Figure 8-29: Polivy - Sales Value by Region (US$/CHF Million), 2021
- Figure 8-30: Polivy - Quarterly Sales Value by Region (%), 2021
- Figure 8-31: Global - Polivy Quarterly Sales Value (US$/CHF Million), 2020
- Figure 8-32: US - Polivy Quarterly Sales Value (US$/CHF Million), 2020
- Figure 8-33: Europe - Polivy Quarterly Sales Value (US$/CHF Million), 2020
- Figure 8-34: Polivy - Annual Sales Value by Region (US$/CHF Million), 2020
- Figure 8-35: Polivy - Sales Value by Region (%), 2020
- Figure 8-36: Polivy - Quarterly Sales Value (US$/CHF Million), Q2-Q4'2019
- Figure 9-1: Avastin - Approval Year by Region
- Figure 9-2: Avastin Combination - FDA Approval Year by Indication
- Figure 9-3: US- Price for a Supply of 10 & Price for Single 4ml Avastin Solution for Injection (US$), June'2022
- Figure 9-4: US - Price for a Supply of 10 & Price for Single 16ml Avastin Solution for Injection (US$), June'2022
- Figure 9-5: UK- Price for a Supply of 4ml & Price Per ml of Avastin Solution for Injection (GBP/US$), June'2022
- Figure 9-6: UK- Price for a Supply of 16ml & Price Per ml of Avastin Solution for Injection (GBP/US$), June'2022
- Figure 9-7: Avastin - Cost of Single Treatment Cycle & Annual Treatment Cost for NSCLC & Cervical Cancer (US$), June'2022
- Figure 9-8: Avastin - Duration of Treatment of Recurrent Glioblastoma & Renal Cell Carcinoma as Combination & Monotherapy (Weeks)
- Figure 9-9: Mvasi - Approval Year by Region
- Figure 9-10: Mvasi - Price for 4ml Supply & Price Per ml of Intravenous Solution (US$), June'2022
- Figure 9-11: Mvasi - Price for 16 ml Supply & Price Per Unit of Intravenous Solution (US$), June'2022
- Figure 9-12: Mvasi - Cost of Single Treatment Cycle & Annual Treatment Cost for NSCLC & Metastatic Cervical Cancer (US$), June'2022
- Figure 9-13: US- Price for a Supply of 4ml & Price Per ml of Zirabev Solution for Injection (US$), June'2022
- Figure 9-14: US- Price for a Supply of 16ml & Price Per ml of Zirabev Solution for Injection (US$), June'2022
- Figure 9-15: UK- Price for a Supply of 16ml, 4ml & Price Per ml of Zirabev Solution for Injection (GBP/US$), June'2022
- Figure 9-16: Zirabev - Cost of Single Treatment Cycle & Annual Treatment Cost for NSCLC (US$), June'2022
- Figure 9-17: UK- Price for a Supply of 4ml & Price Per ml of Aybintio Solution for Injection (GBP/US$), June'2022
- Figure 9-18: UK- Price for a Supply of 16ml & Price Per ml of Aybintio Solution for Injection (GBP/US$), June'2022
- Figure 9-19: Arzerra - FDA Approval Year by Therapy
- Figure 9-20: Arzerra - Price for a Supply of 15 ml, 5 ml and Price per ml of Intravenous Solution (US$), June'2022
- Figure 9-21: Arzerra - Price for a Supply of 50 ml & Price Per ml of Intravenous Solution (US$), June'2022
- Figure 9-22: Arzerra - Initial & Maintenance Dose for Relapsed CLL (mg)
- Figure 9-23: Arzerra - Minimum & Maximum Treatment Cost for Relapsed CLL (US$), June'2022
- Figure 9-24: Arzerra - Initial & Maintenance Dose for Refractory CLL (mg)
- Figure 9-25: Arzerra - Treatment Duration for Refractory CLL (Weeks)
- Figure 9-26: Arzerra - Minimum & Maximum Treatment Cost for Refractory CLL (US$), June'2022
- Figure 9-27: Gazyva - FDA Approval Year by Therapy
- Figure 9-28: US - Price for 40ml Supply & Price Per ml of Gazyva Intravenous Solution (US$), June'2022
- Figure 9-29: Gazyva - Recommended Dosing Schedule for Initial Treatment Cycle of CLL (mg)
- Figure 9-30: Gazyva - Duration of Single Treatment Cycle & Full Treatment of CLL (Week)
- Figure 9-31: Gazyva - Cost of Initial & Subsequent Treatment Cycle & Full Treatment Cost of CLL (US$), June'2022
- Figure 9-32: US- Price for 5ml & Price Per ml of Herceptin Hylecta Subcutaneous Solution for Injection (US$), June'2022
- Figure 9-33: Herceptin Hylecta - Duration of Single Treatment Cycle & Full Treatment (week)
- Figure 9-34: Herceptin Hylecta - Cost of Single Treatment Cycle & Full Treatment (US$), June'2022
- Figure 9-35: US- Price for various Supplies of Phesgo Subcutaneous Solution for Injection (US$), June'2022
- Figure 9-36: UK- Price for a Supply of 16ml & 10ml of Phesgo Solution for Injection (GBP/US$), June'2022
- Figure 9-37: Phesgo - Duration of Treatment by Type (Cycles)
- Figure 9-38: Sarclisa - FDA Approval by Type
- Figure 9-39: Sarclisa - FDA Approval & Patent Expiration Year
- Figure 9-40: US - Price for 5 ml Supply & Price Per ml of Sarclisa 20mg/ml Intravenous Solution (US$), June'2022
- Figure 9-41: US- Price for 25 ml Supply & Price Per ml of 20mg/ml Sarclisa Intravenous Solution (US$), June'2022
- Figure 9-42: UK- Price for a Supply of 25ml & 5ml of Phesgo Solution for Injection (GBP/US$), June'2022
- Figure 9-43: Sarclisa - Number of Dose Required in Initial & Subsequent Treatment Cycles (Weeks)
- Figure 9-44: Herceptin Combination - FDA Approval Year by Cancer Type
- Figure 9-45: Herceptin -Approval Year by Region
- Figure 9-46: US- Price for a Supply of 10 & Price for Single Herceptin 150mg Powder for Injection (US$), June'2022
- Figure 9-47: UK- Price for Single Herceptin 150mg Powder for Injection (GBP/US$), June'2022
- Figure 9-48: Herceptin Combination - Initial & Maintenance Dose for Breast Cancer, Gastric & Esophageal Carcinoma (mg/kg)
- Figure 9-49: Ogivri -Approval Year by Region
- Figure 9-50: Ogivri - Price for 150mg & 420mg Powder for Injection (US$), June'2022
- Figure 9-51: Ogivri - Initial & Maintenance Dose for Breast Cancer (mg/kg/Week)
- Figure 9-52: Ogivri - Average Cost of Initial Week, Maintenance Week & Annual (US$), June'2022
- Figure 9-53: Herzuma -Approval Year by Region
- Figure 9-54: US- Price for 150mg & 420mg Herzuma Powder for Injection (US$), June'2022
- Figure 9-55: UK- Price for 150mg & 420mg Herzuma Powder for Injection (GBP/US$), June'2022
- Figure 9-56: Herzuma - Initial & Maintenance Dose for Breast Cancer (mg/kg/Week)
- Figure 9-57: Herzuma - Average Cost of Initial Week, Maintenance Week & Annual (US$), June'2022
- Figure 9-58: Trazimera -Approval Year by Region
- Figure 9-59: US- Price for 150mg & 420mg Trazimera Powder for Injection (US$), June'2022
- Figure 9-60: UK- Price for 150mg & 420mg Trazimera Powder for Injection (GBP/US$), June'2022
- Figure 9-61: Trazimera - Initial & Maintenance Dose for Breast Cancer (mg/kg/Week)
- Figure 9-62: Trazimera - Average Cost of Initial Week, Maintenance Week & Annual treatment (US$), June'2022
- Figure 9-63: Kanjinti -Approval Year by Region
- Figure 9-64: US - Price for 150mg & 420mg Powder for Injection (US$), June'2022
- Figure 9-65: UK- Price for 150mg & 420mg Kanjinti Powder for Injection (GBP/US$), June'2022
- Figure 9-66: Kanjinti - Initial & Maintenance Dose for Breast Cancer (mg/kg/Week)
- Figure 9-67: Kanjinti - Average Cost of Initial Week, Maintenance Week & Annual Treatment of Breast Cancer (US$), June'2022
- Figure 9-68: UK- Price for Single Zercepac 150mg Powder for Injection (GBP/US$), June'2022
- Figure 9-69: Zercepac - Initial & Maintenance Dose for Breast Cancer (mg/kg/Week)
- Figure 9-70: Zercepac - Average Cost of Initial Week, Maintenance Week & Annual Treatment of Breast Cancer (US$), June'2022
- Figure 9-71: Darzalex Faspro - FDA Approval & Patent Expiration Year
- Figure 9-72: US - Price for 15 ml Supply & Price Per ml of Darzalex Faspro Subcutaneous Solution (US$), June'2022
- Figure 9-73: Darzalex Faspro - Duration of Dose Interval by Treatment Phase (Weeks)
- Figure 9-74: Tafasitamab Combination - Approval Year by Region
- Figure 9-75: Monjuvi - Number of Dose per Treatment Cycle by Phase
- Figure 9-76: Monjuvi - Duration of Single Treatment Cycle & Full Treatment (Weeks)
- Figure 9-77: Monjuvi - Cost of Single Dose, Single Treatment Cycle & Full Treatment (US$), June'2022
- Figure 9-78: Rituxan Combination - FDA Approval Year by Indication
- Figure 9-79: MabThera - Approval Year by Region
- Figure 9-80: US- Price for a Supply of 10 ml & Price Per ml of Rituxan Solution for Injection (US$), June'2022
- Figure 9-81: US - Price for a Supply of 50 ml & Price Per ml of Rituxan Solution for Injection (US$), June'2022
- Figure 9-82: US - Price for a Supply of 100 ml & Price Per ml of Solution Rituxan for Injection (US$), June'2022
- Figure 9-83: UK - Price for a Supply of 10 ml & Price Per ml of Rituxan Solution for Injection (GBP/US$), June'2022
- Figure 9-84: UK - Price for a Supply of 50 ml & Price Per ml of Rituxan Solution for Injection (GBP/US$), June'2022
- Figure 9-85: Rituxan Combination - Average Minimum & Maximum Cost for Refractory CD20+ B-Cell NHL Management (US$), June'2022
- Figure 9-86: Rituxan Combination - Average Cost for Single Dose & Cost of Full Maintenance Phase for CLL (US$), June'2022
- Figure 9-87: Truxima - Price for a Supply of 10 ml & Price Per ml of Solution for Injection (US$), June'2022
- Figure 9-88: Truxima - Price for a Supply of 50 ml & Price Per ml of Solution for Injection (US$), June'2022
- Figure 9-89: UK - Cost of 50ml Truxima 500mg/50ml Solution & Per Unit Cost of Solution (GBP/US$), June'2022
- Figure 9-90: UK - Cost of 2 Vials of Truxima 100mg/10ml Solution & Per Unit Cost of Vial (GBP/US$), June'2022
- Figure 9-91: Truxima - Average Minimum & Maximum Cost for Refractory CD20+ B-Cell NHL Management (US$), June'2022
- Figure 9-92: Truxima - Average Cost for Single Dose & Cost of Full Maintenance Phase for CLL (US$), June'2022
- Figure 9-93: Riabni - Cost of Supply of 10ml & Per Unit Price of 10mg/ml Intravenous Solution (US$), June'2022
- Figure 9-94: Riabni - Cost of Supply of 50ml & Per Unit Price of 10mg/ml Intravenous Solution (US$), June'2022
- Figure 9-95: Riabni - Cost of 8 Cycles, 4 Cycles & Single Cycle for Management of NHL (US$), June'2022
- Figure 9-96: Ruxience - Approval Year by Region
- Figure 9-97: US - Cost of Supply of 10ml & Per Unit Price of Ruxience 10mg/ml Intravenous Solution (US$), June'2022
- Figure 9-98: US - Cost of Supply of 50ml & Per Unit Price of Ruxience 10mg/ml Intravenous Solution (US$), June'2022
- Figure 9-99: UK - Cost of 50ml Ruxience 500mg/50ml Solution & Per Unit Cost of Solution (GBP/US$), June'2022
- Figure 9-100: UK - Cost of 10ml Ruxience 100mg/10ml Solution & Per Unit Cost of Solution (GBP/US$), June'2022
- Figure 9-101: Ruxience - Cost of 8 Cycles, 4 Cycles & Single Cycle for Management of NHL (US$), June'2022
- Figure 9-102: Rituxan Hycela - Price for 11.7 ml Supply & Price Per ml of 23,400 units-1,400mg/11.7 ml Subcutaneous Solution (US$), June'2022
- Figure 9-103: Rituxan Hycela - Price for 13.4 ml Supply & Price Per ml of 26,800 units-1,600 mg/13.4ml Subcutaneous Solution (US$), June'2022
- Figure 9-104: Rituxan Hycela -Minimum & Maximum Duration of Follicular lymphoma Treatment (Weeks)
- Figure 9-105: Rituxan Hycela - Average Minimum & Maximum Cost of Follicular lymphoma (US$), June'2022
- Figure 9-106: Rituxan Hycela - Duration of Single Treatment Cycle & Full Treatment of Previously Untreated Follicular lymphoma (weeks)
- Figure 9-107: Rituxan Hycela - Average Minimum & Maximum Cost of Previously Untreated Follicular lymphoma (US$), June'2022
- Figure 9-108: Rituxan Hycela - Average Minimum & Maximum Cost of Diffuse Large B-Cell Lymphoma (US$), June'2022
- Figure 9-109: Rituxan Hycela - Duration of CLL Treatment (Weeks)
- Figure 9-110: Rituxan Hycela - Cost of Single Treatment Cycle & Full Treatment of CLL (US$), June'2022
- Figure 9-111: Erbitux Combination - Approval Year by Cancer Type
- Figure 9-112: US - Price for a Supply of 50 ml & Per unit Price of Erbitux Intravenous Solution (US$), June'2022
- Figure 9-113: US - Price for a Supply of 100 ml & Per unit Price of Erbitux Intravenous Solution (US$), June'2022
- Figure 9-114: UK - Cost of 100ml, 20ml & Per Unit Cost of Erbitux Solution (GBP/US$), June'2022
- Figure 9-115: Cetuximab Combination - Initial & Maintenance Dose for Colorectal Cancer & Head and Neck Cancer (mg/ m2)
- Figure 9-116: Cetuximab - Recommended Dose & Reduced Dose (mg/ m2)
- Figure 9-117: Naxitamab - Cost of Supply of 10ml & Per Unit Cost of Intravenous Solution (US$), June'2022
- Figure 9-118: Empliciti - FDA Approval by Therapy Type
- Figure 9-119: Empliciti - Aooroval Year by Region
- Figure 9-120: Empliciti - Patent Issue & Expiration Year
- Figure 9-121: US - Price for 300mg & 400mg Supply of Empliciti Intravenous Powder for Injection (US$), June'2022
- Figure 9-122: UK - Price for 300mg & 400mg Supply of Empliciti Intravenous Powder for Injection (GBP/US$), June'2022
- Figure 9-123: Empliciti - Number of Dose Administration During Initial 2 Cycles & Subsequent Cycles
- Figure 9-124: Empliciti - Cost of Single Cycle during Initial 2 Cycles & Subsequent Cycles (US$), June'2022
- Figure 9-125: Vectibix - FDA Approval by Therapy Type
- Figure 9-126: Vectibix - FDA Approval & Patent Expiration Year
- Figure 9-127: Vectibix - Price for a Supply of 5 ml & Price Per ml of Intravenous Solution (US$), June'2022
- Figure 9-128: Vectibix - Price for a Supply of 20 ml & Price Per ml of Intravenous Solution (US$), June'2022
- Figure 9-129: UK - Cost of 20ml, 50ml & Per Unit Cost of Vectibix Solution (GBP/US$), June'2022
- Figure 9-130: Vectibix - Cost of Single Treatment Cycle & Annual Treatment Cost for Colorectal Cancer (US$), June'2022
- Figure 9-131: Avastin - Sales Value by Region (US$/CHF Million), Q1'2022
- Figure 9-132: Avastin - Sales Value by Region (%), Q1'2022
- Figure 9-133: Global - Avastin Sales Value (US$/CHF Million), 2019 - 2021
- Figure 9-134: US - Avastin Sales Value (US$/CHF Million), 2019 - 2021
- Figure 9-135: Europe - Avastin Sales Value (US$/CHF Million), 2019 - 2021
- Figure 9-136: Japan - Avastin Sales Value (US$/CHF Million), 2019 - 2021
- Figure 9-137: ROW - Avastin Sales Value (US$/CHF Million), 2019 - 2021
- Figure 9-138: Avastin - Sales Value by Region (US$/CHF Million), 2021
- Figure 9-139: Avastin - Sales Value by Region (%), 2021
- Figure 9-140: Global - Avastin Quarterly Sales Value (US$/CHF Million), 2021
- Figure 9-141: US - Avastin Quarterly Sales Value (US$/CHF Million), 2021
- Figure 9-142: Mvasi - Sales Value by Region (US$ Million), Q1'2022
- Figure 9-143: Mvasi - Sales Value by Region (%), Q1'2022
- Figure 9-144: Global - Mvasi Sales Value (US$ Million), 2019 - 2021
- Figure 9-145: US - Mvasi Sales Value (US$ Million), 2019 - 2021
- Figure 9-146: ROW - Mvasi Sales Value (US$ Million), 2019 - 2021
- Figure 9-147: Mvasi - Sales Value by Region (US$ Million), 2021
- Figure 9-148: Mvasi - Sales Value by Region (%), 2021
- Figure 9-149: Global - Mvasi Quarterly Sales (US$ Million), 2021
- Figure 9-150: US - Mvasi Quarterly Sales (US$ Million), 2021
- Figure 9-151: Global - Mvasi Quarterly Sales Value (US$ Million), 2020
- Figure 9-152: Zirabev - Sales Value by Region (US$ Million), Q1'2022
- Figure 9-153: Zirabev - Sales Value by Region (%), Q1'2022
- Figure 9-154: Global - Zirabev Sales (US$ Million), 2020 & 2021
- Figure 9-155: US - Zirabev Sales (US$ Million), 2020 & 2021
- Figure 9-156: Zirabev - Sales Value by Region (US$ Million), 2021
- Figure 9-157: Zirabev - Sales Value by Region (%), 2021
- Figure 9-158: Global - Zirabev Quarterly Sales (US$ Million), 2021
- Figure 9-159: US - Zirabev Quarterly Sales (US$ Million), 2021
- Figure 9-160: US - Zirabev Quarterly Sales (US$ Million), 2020
- Figure 9-161: Gazyva - Value by Region (US$/CHF Million), Q1'2022
- Figure 9-162: Global - Gazyva Sales Value (US$/CHF Million), 2018 - 2021
- Figure 9-163: US - Gazyva Sales Value (US$/CHF Million), 2019 - 2021
- Figure 9-164: Europe - Gazyva Sales Value (US$/CHF Million), 2019 - 2021
- Figure 9-165: Japan - Gazyva Sales Value (US$/CHF Million), 2019 - 2021
- Figure 9-166: ROW - Gazyva Sales Value (US$/CHF Million), 2019 - 2021
- Figure 9-167: Gazyva - Sales Value by Region (US$/CHF Million), 2021
- Figure 9-168: Gazyva - Sales Value by Region (%), 2021
- Figure 9-169: US - Gazyva Quarterly Sales Value (US$ Billion), 2021
- Figure 9-170: US - Gazyva Quarterly Sales Value (US$/CHF Million), 2020
- Figure 9-171: Phesgo - Sales Value by Region (US$/CHF Million), Q1'2022
- Figure 9-172: Phesgo - Sales Value by Region (%), Q1'2022
- Figure 9-173: Global - Phesgo Sales Value (US$/CHF Million), 2020 & 2021
- Figure 9-174: Phesgo - Sales Value by Region (US$/CHF Million), 2021
- Figure 9-175: Phesgo - Sales Value by Region (%), 2021
- Figure 9-176: Global - Phesgo Quarterly Sales Value (US$/CHF Million), 2021
- Figure 9-177: US - Phesgo Quarterly Sales Value (US$/CHF Million), 2021
- Figure 9-178: Europe - Phesgo Quarterly Sales Value (US$/CHF Million), 2021
- Figure 9-179: Herceptin - Sales Value by Region (US$/CHF Million), Q1'2022
- Figure 9-180: Herceptin - Sales Value by Region (%), Q1'2022
- Figure 9-181: Global - Herceptin Sales Value (US$/CHF Million), 2019 - 2021
- Figure 9-182: US - Herceptin Sales Value (US$/CHF Million), 2019 - 2021
- Figure 9-183: Europe - Herceptin Sales Value (US$/CHF Million), 2019 - 2021
- Figure 9-184: Japan - Herceptin Sales Value (US$/CHF Million), 2019 - 2021
- Figure 9-185: ROW - Herceptin Sales Value (US$/CHF Million), 2019 - 2021
- Figure 9-186: Herceptin - Sales Value by Region (US$/CHF Million), 2021
- Figure 9-187: Herceptin - Sales Value by Region (%), 2021
- Figure 9-188: Global - Herceptin Quarterly Sales Value (US$/CHF Million), 2021
- Figure 9-189: US - Herceptin Quarterly Sales Value (US$/CHF Million), 2021
- Figure 9-190: Sarclisa - Sales Value by Region (US$/Euro Million), Q1'2022
- Figure 9-191: Sarclisa - Sales Value by Region (%), Q1'2022
- Figure 9-192: Global - Sarclisa Sales Value (US$/EUR Million), 2020 & 2021
- Figure 9-193: US - Sarclisa Sales Value (US$/EUR Million), 2020 & 2021
- Figure 9-194: Sarclisa - Sales Value by Region (US$/Euro Million), 2021
- Figure 9-195: Sarclisa - Sales Value by Region (%), 2021
- Figure 9-196: Sarclisa - Sales Value by Region (US$/Euro Million), 2020
- Figure 9-197: Sarclisa - Sales Value by Region (%), 2020
- Figure 9-198: Sarclisa - Sales Quarterly Value by Region (US$/Euro Million), 2021
- Figure 9-199: US - Sales Quarterly Value by Region (US$/Euro Million), 2021
- Figure 9-200: US - Monjuvi Sales Value (US$ Million), Q1'2021 & Q1'2022
- Figure 9-201: US - Monjuvi Sales Value (US$ Million), 2020 & 2021
- Figure 9-202: US - Monjuvi Quarterly Sales Value (US$ Million), 2021
- Figure 9-203: US - Monjuvi Quarterly Sales Value (US$ Million), Q3 & Q4'2020
- Figure 9-204: Rituxan - Value by Region (US$/CHF Million), Q1'2022
- Figure 9-205: Global - Rituxan Sales Value (US$/CHF Million), 2018 - 2021
- Figure 9-206: US - Rituxan Sales Value (US$/CHF Million), 2018 - 2021
- Figure 9-207: Europe - Rituxan Sales Value (US$/CHF Million), 2018 - 2021
- Figure 9-208: Japan - Rituxan Sales Value (US$/CHF Million), 2018 - 2021
- Figure 9-209: ROW - Rituxan Sales Value (US$/CHF Million), 2018 - 2021
- Figure 9-210: Rituxan - Sales Value by Region (US$/CHF Million), 2021
- Figure 9-211: Rituxan - Sales Value by Region (%), 2021
- Figure 9-212: Global - Rituximab Quarterly Sales Value (US$ Billion), 2021
- Figure 9-213: Global - Rituxan Quarterly Sales Value (US$ Million), 2020
- Figure 9-214: Global - Empliciti Sales Value by Region (US$ Million), Q1'2022
- Figure 9-215: Global - Empliciti Sales Value by Region (%), Q1'2022
- Figure 9-216: Global - Empliciti Sales Value (US$ Million), 2018 - 2020
- Figure 9-217: US - Empliciti Sales Value (US$ Million), 2018 - 2020
- Figure 9-218: Global - Empliciti Sales Value by Region (US$ Million), 2021
- Figure 9-219: Global - Empliciti Sales Value by Region (%), 2021
- Figure 9-220: Global - Empliciti Quarterly Sales Value (US$ Million), 2021
- Figure 9-221: US - Empliciti Quarterly Sales Value (US$ Million), 2021
- Figure 9-222: Global - Empliciti Quarterly Sales Value (US$ Million), 2020
- Figure 9-223: US - Empliciti Quarterly Sales Value (US$ Million), 2020
- Figure 9-224: Global - Vectibix Sales Value by Region (US$ Million), Q1'2022
- Figure 9-225: Global - Vectibix Sales Value by Region (%), Q1'2022
- Figure 9-226: Global - Vectibix Sales (US$ Million), 2019 - 2021
- Figure 9-227: US - Vectibix Sales (US$ Million), 2019 - 2021
- Figure 9-228: Global - Vectibix Sales Value by Region (US$ Million), 2021
- Figure 9-229: Global - Vectibix Sales Value by Region (%), 2021
- Figure 9-230: Global - Vectibix Quarterly Sales (US$ Million), 2021
- Figure 9-231: US - Vectibix Quarterly Sales (US$ Million), 2021
- Figure 9-232: Global - Vectibix Quarterly Sales Value (US$ Million), 2020
- Figure 9-233: US - Vectibix Quarterly Sales Value (US$ Million), 2020
- Figure 9-234: Global - Kanjinti Sales Value by Region (US$ Million), Q1'2022
- Figure 9-235: Global - Kanjinti Sales Value by Region (%), Q1'2022
- Figure 9-236: Global - Kanjinti Sales Value (US$ Million), 2019 - 2021
- Figure 9-237: US - Kanjinti Sales Value (US$ Million), 2019 - 2021
- Figure 9-238: Kanjinti - Sales by Region (US$ Million), 2021
- Figure 9-239: Kanjinti - Sales Value by Region (%), 2021
- Figure 9-240: Global - Kanjinti Quarterly Sales (US$ Million), 2021
- Figure 9-241: US - Kanjinti Quarterly Sales (US$ Million), 2021
- Figure 9-242: Global - Kanjinti Quarterly Sales (US$ Million), 2020
- Figure 9-243: US - Kanjinti Quarterly Sales (US$ Million), 2020
- Figure 10-1: Global - Number of Combination Cancer Immunotherapies in Clinical Trials by Company, 2022 till 2028
- Figure 10-2: Global - Number of Combination Cancer Immunotherapies in Clinical Trials by Country, 2022 till 2028
- Figure 10-3: Global - Number of Combination Cancer Immunotherapies Clinical Trials by Disease Stage, 2022 till 2028
- Figure 10-4: Global - Number of Combination Cancer Immunotherapies in Clinical Trials by Phase, 2022 till 2028
“Global Combination Cancer Immunotherapy Market Opportunity & Clinical Trials Insight 2028” Report Highlights:
- Global & Regional Combination Cancer Immunotherapy Market Insight Till 2028
- Combination Cancer Immunotherapy Market Opportunity: > USD 15 Billion
- Combination Cancer Immunotherapy Market By 15 Different Cancers
- Insight On Clinically & Commercially Approved Cancer Immunotherapy Combinations
- Patent, Price & Dosage Analysis On Approved Combination Drugs
- Global & Regional Sales Insights On Approved Combination Drugs Till 2028
- Insight on 600 Combination Cancer Immunotherapy Drugs In Clinical Trials
- Insight on 45 Combination Cancer Immunotherapy Drugs Commercially Approved In Market
- Clinical Trials & Patent Insight By Company, Country, Indication & Phase
In recent years, cancer immunotherapy has emerged as an appealing strategy by overcoming the limitations of conventional therapies. The novel therapy aims to harness the ability of immune system to recognize, target, and destroy cancer cells. Cancer immunotherapy now encompasses several therapeutic agents including monoclonal antibodies, immune checkpoint inhibitors, vaccines, antibody drug conjugates, and others. All these novel approaches have their distinct target and mechanism of action. Although immunotherapies have shown significant improvement in clinical outcome of cancer patients, these are associated with several limitations. Tumor heterogeneity and development of resistance are the major challenges to current immunotherapeutic approaches.
This has pushed the research studies to evaluate immunotherapy in combination with other cancer targeting approaches including chemotherapy, radiotherapy, targeted drugs, and other immunotherapeutic approaches. The combination therapy aims to combine two or more drugs which have synergistic mechanism of action in targeting the disease. In comparison to monotherapy, combinational therapy aims to have more enhanced and additive effect in the targeting of cancer cells. Further, it also has the potential to overcome the drug resistance and enhance the overall survival rate in cancer patients. The conferred advantages associated with combinational therapies have drawn the interest of several pharmaceutical giants to invest in this segment.
Currently, several drugs such as Opdivo, Yervoy, Bevacizumab, and others have gained approval as combinational immunotherapy for the management of cancer cells In 2022, US FDA has granted approval to the fixed dose combination of relatlimab (LAG-3 inhibitor) plus nivolumab for the treatment of adult and pediatric patients who are 12 years of age or older and who have unresectable or metastatic melanoma. The novel combination has shown manageable safety with no new or unexpected safety signals. The combination is sold under the trade name Opdualag and is marketed by Bristol Myers Squibb.
In last few years, pharmaceutical companies have begun to embrace a more collaborative way of working to mitigate the obstacles of drug development. The manufacturers of antibody drug conjugates are increasingly collaborating or partnering with other companies to share technology, resources, product knowledge, and expand business. For instance, Gilead Sciences entered into two clinical trial collaboration and supply agreements with Merck to evaluate the combination of Trodelvy and Keytruda in first-line metastatic non-small cell lung cancer. Additionally, the companies recently established an agreement whereby Gilead will sponsor a phase-II signal seeking study evaluating combinations that include pembrolizumab in first line non-small cell lung cancer.
Triple combinational therapy is also gaining considerable momentum in the market. However, it is mainly confined to initial stages of clinical development. For instance, Zenith Pharmaceutical in collaboration with Bristol Myers Squibb is conducting clinical trial which is evaluating triple combination of ZEN-3694 (BET inhibitor), Opdio, and Yervoy. The trial will be conducted by NCI funded investigators and will evaluate the safety and activity of this combination in patients with solid tumors that have become resistant to other therapies. Apart from this, a triple combinational therapy of PD-1/PD-L1, BRAF, and MEK inhibitor is also ongoing in multiple myeloma patients.
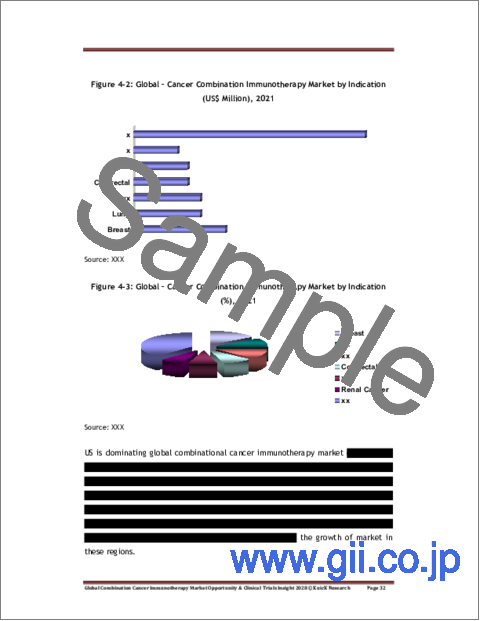
As per our report findings, the global combinational immunotherapy market is expected to surpass US$ 15 Billion by 2028. This is mainly attributed to rising geriatric population and surge in prevalence of various cancers. This possesses high medical needs for the development of targeted therapies in its management. In addition, rising investments by pharmaceutical companies due to promising response of combinational immunotherapy is also driving the growth of market. The major players in the global combinational immunotherapy market include Amgen, Roche, Macrogenics, Mylan, Seagen, AstraZeneca, Gilead Sciences, GlaxoSmithKline, and others.
Table of Contents
1. Combination Cancer Immunotherapy - New Era in Cancer Research
2. Need for Combination Cancer Immunotherapy
3. Clinically & Commercially Approved Combination Cancer Immunotherapy
4. Global Combination Cancer Immunotherapy Market Size & Trend Analysis
- 4.1. Current Market Scenario
- 4.2. Future Market Opportunity
5. Global Combination Cancer Immunotherapy Market Size & Trend Analysis by Indication
- 5.1. Breast Cancer
- 5.2. Kidney Cancer
- 5.3. Lung Cancer
- 5.4. Liver Cancer
- 5.5. Gastric Cancer
- 5.6. Lymphoma
- 5.7. Prostate Cancer
- 5.8. Melanoma
- 5.9. Colorectal Cancer
- 5.10. Leukemia
- 5.11. Cervical Cancer
- 5.12. Pancreatic Cancer
- 5.13. Ovarian Cancer
- 5.14. Head & Neck Cancer
- 5.15. Multiple Myeloma
6. Global Combination Cancer Immunotherapy Market Size & Trend Analysis by Region
- 6.1. US
- 6.2. Europe
- 6.3. China
- 6.4. Japan
- 6.5. Australia
- 6.6. South Korea
- 6.7. Canada
- 6.8. UK
7. Approved Immune Checkpoint Inhibitor In Combination Cancer Immunotherapy - Clinical & Commercial Insights
- 7.1. Patent, Price & Dosage Analysis
- 7.2. Global & Regional Sales Insights
8. Approved Antibody Drug Conjugate In Combination Cancer Immunotherapy - Clinical & Commercial Insights
- 8.1. Patent, Price & Dosage Analysis
- 8.2. Global & Regional Sales Insights
9. Approved Monoclonal Antibodies In Combination Cancer Immunotherapy - Clinical & Commercial Insights
- 9.1. Patent, Price & Dosage Analysis
- 9.2. Global & Regional Sales Insights
10. Combination Cancer Immunotherapy Clinical Trials Overview
- 10.1. By Company
- 10.2. By Country
- 10.3. By Patient Segment/Disease Stage
- 10.4. By Phase
11. Combination Cancer Immunotherapy Clinical Trials & Patent Insight By Company, Country, Indication & Phase
- 11.1. Research
- 11.2. Preclinical
- 11.3. Clinical
- 11.4. Phase-I
- 11.5. Phase-I/II
- 11.6. Phase-II
- 11.7. Phase-II/III
- 11.8. Phase-III
- 11.9. Preregistration
- 11.10. Registered
12. Marketed Combination Cancer Immunotherapy Clinical & Patent Insight By Company, Country, & Indication
13. Combination Strategies to Enhance Immune Checkpoint Inhibitors Efficacy
- 13.1. In Combination with Other Immune Checkpoint Blockade:
- 13.2. Ongoing Clinical Trials of ICI with Conventional Therapies; Chemotherapy & Radiation
- 13.3. ICI Trials with Other Targeted Therapies
- 13.4. Recent Trends in Market: Partnerships, Collaboration, & Investments
14. Combination of Therapeutic Antibodies in Clinical Oncology
- 14.1. Combination Trials of Monoclonal Antibodies
- 14.2. Clinical Trials of Bispecific Antibody Combination Therapy
- 14.3. Pharmaceutical Investments Boosting Market
15. Engaging Cancer Vaccines in Combination Therapy
- 15.1. Preclinical Studies Evaluating Vaccines in Combination Therapy
- 15.2. Clinical Trials Evaluating Cancer Vaccines in Combination Approach
- 15.3. Ongoing Research Agreement & Collaboration
16. Antibody Drug Conjugate in Combination Therapy
- 16.1. Ongoing Clinical Investigations
- 16.2. Pharmaceutical Collaborations & Supply Agreements
17. Combination Therapy with CAR T Cell Therapy
- 17.1. Preclinical Studies Combining CAR T cell Therapy
- 17.2. Clinical Trials Evaluating Combination Therapies with CAR T Cells
- 17.3. Ongoing Research & Development Activities
18. Oncolytic Virus Combination Therapy
- 18.1. OV Combination Immunotherapy
- 18.2. Oncolytic Virus in Combination with Other Regimens
- 18.3. Recent Trends in Market: Partnerships, Collaboration, & Investments
19. Competitive Landscape
- 19.1. AbbVie
- 19.2. Agenus
- 19.3. Akeso Pharmaceutical
- 19.4. Amgen
- 19.5. Arbutus Biopharma
- 19.6. AstraZeneca
- 19.7. AUM Bioscience
- 19.8. BeiGene
- 19.9. BioNTech
- 19.10. Bristol Myers Squibb
- 19.11. Candel Therapeutics
- 19.12. Eli Lilly
- 19.13. Elicio Therapeutics
- 19.14. Fate Therapeutics
- 19.15. GlaxoSmithKline
- 19.16. Harpoon Therapeutics
- 19.17. Immutep
- 19.18. Imugene
- 19.19. Intensity Therapeutics
- 19.20. Janssen Pharmaceuticals
- 19.21. Merck
- 19.22. MorphoSys
- 19.23. Novocure
- 19.24. Novartis
- 19.25. Nykode Therapeutics
- 19.26. Ono Pharmaceutical
- 19.27. Oxford Biotherapeutics
- 19.28. Pfizer
- 19.29. Regeneron*
- 19.30. Roche
- 19.31. Sanofi
- 19.32. Seagen
- 19.33. Shanghai Junshi Biosciences
- 19.34. Takeda Pharmaceuticals
- 19.35. Qurient