|
|
市場調査レポート
商品コード
1255884
バイオ医薬品受託製造の世界市場(2023年~2033年)Biopharmaceuticals Contract Manufacturing Market Report 2023-2033 |
||||||
|
|
|||||||
|
● お客様のご希望に応じて、既存データの加工や未掲載情報(例:国別セグメント)の追加などの対応が可能です。 詳細はお問い合わせください。 |
|||||||


| バイオ医薬品受託製造の世界市場(2023年~2033年) |
|
出版日: 2023年04月03日
発行: Visiongain Reports Ltd.
ページ情報: 英文 358 Pages
納期: 即日から翌営業日
|
- 全表示
- 概要
- 図表
- 目次
世界のバイオ医薬品受託製造の市場規模は、2033年までに10%のCAGRで成長すると予測されています。
当レポートでは、世界のバイオ医薬品受託製造市場について調査しており、市場概要、市場分析、企業プロファイルなど、包括的な情報を提供しています。
目次
第1章 レポートの概要
第2章 エグゼクティブサマリー
- バイオ医薬品における新たなアウトソーシングの動向
- コンタクトメーカーに収益機会をもたらすRNAベースのCOVID-19ワクチンの需要
- 研究開発の投資の増加
- アナリストの視点
第3章 市場概要
- 主な調査結果
- 市場力学
- 市場促進要因
- 市場抑制要因
- 市場機会
- COVID-19の影響分析
- SWOT分析
- 強み
- 弱み
- 機会
- 脅威
- ポーターのファイブフォース分析
- バイヤーの力
- サプライヤーの力
- 競争企業間の敵対関係
- 代替品の脅威
- 新規参入業者の脅威
- PEST分析
- 政治的要因
- 経済的要因
- 社会的要因
- 技術的要因
第4章 バイオ医薬品受託製造市場分析:供給源別
- 主な調査結果
- 供給源セグメント:市場魅力指数
- バイオ医薬品受託製造市場規模の推定と予測:供給源別
- 哺乳類
- 非哺乳類
第5章 バイオ医薬品受託製造市場分析:サービス別
- 主な調査結果
- サービスセグメント:市場魅力指数
- バイオ医薬品受託製造市場規模の推定と予測:サービス別
- プロセス開発
- 上流工程開発
- 下流工程開発
- 充填・仕上げ
- 分析・品質管理
- 包装
第6章 バイオ医薬品受託製造市場分析:製品別
- 主な調査結果
- 製品セグメント:市場魅力指数
- バイオ医薬品受託製造市場規模の推定と予測:製品別
- 生物製剤
- バイオシミラー
第7章 バイオ医薬品受託製造市場分析:事業規模別
- 主な調査結果
- 事業規模セグメント:市場魅力指数
- バイオ医薬品受託製造市場規模の推定と予測:事業規模別
- 臨床前
- 臨床
- 商用
第8章 バイオ医薬品受託製造市場分析:企業規模別
- 主な調査結果
- 企業規模セグメント:市場魅力指数
- バイオ医薬品受託製造市場規模の推定と予測:企業規模別
- 小規模
- 中規模
- 大規模
第9章 バイオ医薬品受託製造市場分析:地域別
- 主な調査結果
- 市場規模の推定と予測:地域別
第10章 北米の医薬品受託製造市場分析
第11章 欧州のバイオ医薬品受託製造市場分析
第12章 アジア太平洋のバイオ医薬品受託製造市場分析
第13章 ラテンアメリカのバイオ医薬品受託製造市場分析
第14章 中東・アフリカのバイオ医薬品受託製造市場分析
第15章 企業プロファイル
- AbbVie, Inc.
- AGC Biologics
- Avantor, Inc.
- Binex Co., Ltd.
- Boehringer Ingelheim GmbH
- FUJIFILM Diosynth Biotechnologies
- Lonza
- ProBioGen
- Rentschler Biopharma SE
- Samsung Biologics
- Sandoz
- TOYOBO CO., LTD.
- WuXi Biologics
- JRS PHARMA
- Thermo Fisher Scientific
- Cambrex Corporation
- Curia Global, Inc.
- Pfizer CentreOne
- Jubilant Pharma Limited
- Catalent, Inc
- KBI Biopharma
- Cytiva
第16章 結論と提言
- おわりに
- 市場関係者への推奨事項
List of Tables
- Table 1 Biopharmaceuticals Contract Manufacturing Market Snapshot, 2023 & 2033 (US$ million, CAGR %)
- Table 2 Biopharmaceuticals Contract Manufacturing Market Forecast by Region, 2023-2033 (US$ Million, AGR%, CAGR%): "V" Shaped Recovery
- Table 3 Biopharmaceuticals Contract Manufacturing Market Forecast by Region, 2023-2033 (US$ Million, AGR%, CAGR%): "U" Shaped Recovery
- Table 4 Biopharmaceuticals Contract Manufacturing Market Forecast by Region, 2023-2033 (US$ Million, AGR%, CAGR%): "W" Shaped Recovery
- Table 5 Biopharmaceuticals Contract Manufacturing Market Forecast by Region, 2023-2033 (US$ Million, AGR%, CAGR%): "L" Shaped Recovery
- Table 6 Biopharmaceuticals Contract Manufacturing Market Forecast by Source, 2023-2033 (US$ Million, AGR%, CAGR%)
- Table 7 Mammalian Segment Market Forecast by Region, 2023-2033 (US$ Mn, AGR%, CAGR%)
- Table 8 Non-mammalian Segment Market Forecast by Region, 2023-2033 (US$ Mn, AGR%, CAGR%)
- Table 9 Biopharmaceuticals Contract Manufacturing Market Forecast by Service, 2023-2033 (US$ Million, AGR%, CAGR%)
- Table 10 Process Development Segment Market Forecast by Region, 2023-2033 (US$ Mn, AGR%, CAGR%)
- Table 11 Biopharmaceuticals Contract Manufacturing Market Forecast by Process Development, 2023-2033 (US$ mn, AGR%, CAGR%)
- Table 12 Fill & Finish Operations Segment Market Forecast by Region, 2023-2033 (US$ Mn, AGR%, CAGR%)
- Table 13 Analytical & QC Studies Segment Market Forecast by Region, 2023-2033 (US$ Mn, AGR%, CAGR%)
- Table 14 Packaging Segment Market Forecast by Region, 2023-2033 (US$ Mn, AGR%, CAGR%)
- Table 15 Biopharmaceuticals Contract Manufacturing Market Forecast by Product, 2023-2033 (US$ Million, AGR%, CAGR%)
- Table 16 Biologics Segment Market Forecast by Region, 2023-2033 (US$ Mn, AGR%, CAGR%)
- Table 17 Biopharmaceuticals Contract Manufacturing Market Forecast by Application, 2023-2033 (US$ mn, AGR%, CAGR%)
- Table 18 Biosimilars Segment Market Forecast by Region, 2023-2033 (US$ Mn, AGR%, CAGR%)
- Table 19 Preclinical Segment Market Forecast by Region, 2023-2033 (US$ Mn, AGR%, CAGR%)
- Table 20 Clinical Segment Market Forecast by Region, 2023-2033 (US$ Mn, AGR%, CAGR%)
- Table 21 Commercial Segment Market Forecast by Region, 2023-2033 (US$ Mn, AGR%, CAGR%)
- Table 22 Biopharmaceuticals Contract Manufacturing Market Forecast by Company Size, 2023-2033 (US$ Million, AGR%, CAGR%)
- Table 23 Small Segment Market Forecast by Region, 2023-2033 (US$ Mn, AGR%, CAGR%)
- Table 24 Mid-sized Segment Market Forecast by Region, 2023-2033 (US$ Mn, AGR%, CAGR%)
- Table 25 Large Segment Market Forecast by Region, 2023-2033 (US$ Mn, AGR%, CAGR%)
- Table 26 Biopharmaceuticals Contract Manufacturing Market Forecast by Region, 2023-2033 (US$ Million, AGR%, CAGR%)
- Table 27 North America Biopharmaceuticals Contract Manufacturing Market Forecast by Country, 2023-2033 (US$ Million, AGR%, CAGR%)
- Table 28 North America Biopharmaceuticals Contract Manufacturing Market Forecast by Source, 2023-2033 (US$ Million, AGR%, CAGR%)
- Table 29 North America Biopharmaceuticals Contract Manufacturing Market Forecast by Service, 2023-2033 (US$ Million, AGR%, CAGR%)
- Table 30 North America Biopharmaceuticals Contract Manufacturing Market Forecast by Product, 2023-2033 (US$ Million, AGR%, CAGR%)
- Table 31 North America Biopharmaceuticals Contract Manufacturing Market Forecast by Scale of Operation, 2023-2033 (US$ Million, AGR%, CAGR%)
- Table 32 North America Biopharmaceuticals Contract Manufacturing Market Forecast by Company Size, 2023-2033 (US$ Million, AGR%, CAGR%)
- Table 33 U.S. Biopharmaceuticals Contract Manufacturing Market Forecast, 2023-2033 (US$ Million, AGR%, CAGR%)
- Table 34 Canada Biopharmaceuticals Contract Manufacturing Market Forecast, 2023-2033 (US$ Million, AGR%, CAGR%)
- Table 35 Europe Biopharmaceuticals Contract Manufacturing Market Forecast by Country, 2023-2033 (US$ Million, AGR%, CAGR%)
- Table 36 Europe Biopharmaceuticals Contract Manufacturing Market Forecast by Source, 2023-2033 (US$ Million, AGR%, CAGR%)
- Table 37 Europe Biopharmaceuticals Contract Manufacturing Market Forecast by Service, 2023-2033 (US$ Million, AGR%, CAGR%)
- Table 38 Europe Biopharmaceuticals Contract Manufacturing Market Forecast by Product, 2023-2033 (US$ Million, AGR%, CAGR%)
- Table 39 Europe Biopharmaceuticals Contract Manufacturing Market Forecast by Scale of Operation, 2023-2033 (US$ Million, AGR%, CAGR%)
- Table 40 Europe Biopharmaceuticals Contract Manufacturing Market Forecast by Company Size, 2023-2033 (US$ Million, AGR%, CAGR%)
- Table 41 Germany Biopharmaceuticals Contract Manufacturing Market Forecast, 2023-2033 (US$ Million, AGR%, CAGR%)
- Table 42 UK Biopharmaceuticals Contract Manufacturing Market Forecast, 2023-2033 (US$ Million, AGR%, CAGR%)
- Table 43 France Biopharmaceuticals Contract Manufacturing Market Forecast, 2023-2033 (US$ Million, AGR%, CAGR%)
- Table 44 Italy Biopharmaceuticals Contract Manufacturing Market Forecast, 2023-2033 (US$ Million, AGR%, CAGR%)
- Table 45 Spain Biopharmaceuticals Contract Manufacturing Market Forecast, 2023-2033 (US$ Million, AGR%, CAGR%)
- Table 46 Russia Biopharmaceuticals Contract Manufacturing Market Forecast, 2023-2033 (US$ Million, AGR%, CAGR%)
- Table 47 Rest of Europe Biopharmaceuticals Contract Manufacturing Market Forecast, 2023-2033 (US$ Million, AGR%, CAGR%)
- Table 48 Asia Pacific Biopharmaceuticals Contract Manufacturing Market Forecast by Country, 2023-2033 (US$ Million, AGR%, CAGR%)
- Table 49 Asia Pacific Biopharmaceuticals Contract Manufacturing Market Forecast by Source, 2023-2033 (US$ Million, AGR%, CAGR%)
- Table 50 Asia Pacific Biopharmaceuticals Contract Manufacturing Market Forecast by Service, 2023-2033 (US$ Million, AGR%, CAGR%)
- Table 51 Asia Pacific Biopharmaceuticals Contract Manufacturing Market Forecast by Product, 2023-2033 (US$ Million, AGR%, CAGR%)
- Table 52 Asia Pacific Biopharmaceuticals Contract Manufacturing Market Forecast by Scale of Operation, 2023-2033 (US$ Million, AGR%, CAGR%)
- Table 53 Asia Pacific Biopharmaceuticals Contract Manufacturing Market Forecast by Company Size, 2023-2033 (US$ Million, AGR%, CAGR%)
- Table 54 Japan Biopharmaceuticals Contract Manufacturing Market Forecast, 2023-2033 (US$ Million, AGR%, CAGR%)
- Table 55 China Biopharmaceuticals Contract Manufacturing Market Forecast, 2023-2033 (US$ Million, AGR%, CAGR%)
- Table 56 India Biopharmaceuticals Contract Manufacturing Market Forecast, 2023-2033 (US$ Million, AGR%, CAGR%)
- Table 57 Australia Biopharmaceuticals Contract Manufacturing Market Forecast, 2023-2033 (US$ Million, AGR%, CAGR%)
- Table 58 South-East Asia Biopharmaceuticals Contract Manufacturing Market Forecast, 2023-2033 (US$ Million, AGR%, CAGR%)
- Table 59 Rest of Asia Pacific Biopharmaceuticals Contract Manufacturing Market Forecast, 2023-2033 (US$ Million, AGR%, CAGR%)
- Table 60 Latin America Biopharmaceuticals Contract Manufacturing Market Forecast by Country, 2023-2033 (US$ Million, AGR%, CAGR%)
- Table 61 Latin America Biopharmaceuticals Contract Manufacturing Market Forecast by Source, 2023-2033 (US$ Million, AGR%, CAGR%)
- Table 62 Latin America Biopharmaceuticals Contract Manufacturing Market Forecast by Service, 2023-2033 (US$ Million, AGR%, CAGR%)
- Table 63 Latin America Biopharmaceuticals Contract Manufacturing Market Forecast by Product, 2023-2033 (US$ Million, AGR%, CAGR%)
- Table 64 Latin America Biopharmaceuticals Contract Manufacturing Market Forecast by Scale of Operation, 2023-2033 (US$ Million, AGR%, CAGR%)
- Table 65 Latin America Biopharmaceuticals Contract Manufacturing Market Forecast by Company Size, 2023-2033 (US$ Million, AGR%, CAGR%)
- Table 66 Brazil Biopharmaceuticals Contract Manufacturing Market Forecast, 2023-2033 (US$ Million, AGR%, CAGR%)
- Table 67 Mexico Biopharmaceuticals Contract Manufacturing Market Forecast, 2023-2033 (US$ Million, AGR%, CAGR%)
- Table 68 Argentina Biopharmaceuticals Contract Manufacturing Market Forecast, 2023-2033 (US$ Million, AGR%, CAGR%)
- Table 69 Colombia Biopharmaceuticals Contract Manufacturing Market Forecast, 2023-2033 (US$ Million, AGR%, CAGR%)
- Table 70 Rest of Latin America Biopharmaceuticals Contract Manufacturing Market Forecast, 2023-2033 (US$ Million, AGR%, CAGR%)
- Table 71 MEA Biopharmaceuticals Contract Manufacturing Market Forecast by Country, 2023-2033 (US$ Million, AGR%, CAGR%)
- Table 72 MEA Biopharmaceuticals Contract Manufacturing Market Forecast by Source, 2023-2033 (US$ Million, AGR%, CAGR%)
- Table 73 MEA Biopharmaceuticals Contract Manufacturing Market Forecast by Service, 2023-2033 (US$ Million, AGR%, CAGR%)
- Table 74 MEA Biopharmaceuticals Contract Manufacturing Market Forecast by Product, 2023-2033 (US$ Million, AGR%, CAGR%)
- Table 75 MEA Biopharmaceuticals Contract Manufacturing Market Forecast by Scale of Operation, 2023-2033 (US$ Million, AGR%, CAGR%)
- Table 76 MEA Biopharmaceuticals Contract Manufacturing Market Forecast by Company Size, 2023-2033 (US$ Million, AGR%, CAGR%)
- Table 77 GCC Biopharmaceuticals Contract Manufacturing Market Forecast, 2023-2033 (US$ Million, AGR%, CAGR%)
- Table 78 South Africa Biopharmaceuticals Contract Manufacturing Market Forecast, 2023-2033 (US$ Million, AGR%, CAGR%)
- Table 79 Rest of MEA Biopharmaceuticals Contract Manufacturing Market Forecast, 2023-2033 (US$ Million, AGR%, CAGR%)
- Table 80 AbbVie, Inc.: Key Details, (CEO, HQ, Revenue, Founded, No. of Employees, Company Type, Website, Business Segment)
- Table 81 AbbVie, Inc.: Service Benchmarking
- Table 82 AbbVie, Inc.: Strategic Outlook
- Table 83 AGC Biologics: Key Details, (CEO, HQ, Revenue, Founded, No. of Employees, Company Type, Website, Business Segment)
- Table 84 AGC Biologics: Service Benchmarking
- Table 85 AGC Biologics: Strategic Outlook
- Table 86 Avantor, Inc.: Key Details, (CEO, HQ, Revenue, Founded, No. of Employees, Company Type, Website, Business Segment)
- Table 87 Avantor, Inc.: Service Benchmarking
- Table 88 Avantor, Inc.: Strategic Outlook
- Table 89 Binex Co., Ltd.: Key Details, (CEO, HQ, Revenue, Founded, No. of Employees, Company Type, Website, Business Segment)
- Table 90 Binex Co., Ltd.: Service Benchmarking
- Table 91 Boehringer Ingelheim GmbH: Key Details, (CEO, HQ, Revenue, Founded, No. of Employees, Company Type, Website, Business Segment)
- Table 92 Boehringer Ingelheim GmbH: Service Benchmarking
- Table 93 Boehringer Ingelheim GmbH: Strategic Outlook
- Table 94 FUJIFILM Diosynth Biotechnologies: Key Details, (CEO, HQ, Revenue, Founded, No. of Employees, Company Type, Website, Business Segment)
- Table 95 FUJIFILM Diosynth Biotechnologies: Service Benchmarking
- Table 96 FUJIFILM Diosynth Biotechnologies: Strategic Outlook
- Table 97 Lonza: Key Details, (CEO, HQ, Revenue, Founded, No. of Employees, Company Type, Website, Business Segment)
- Table 98 Lonza: Service Benchmarking
- Table 99 Lonza: Strategic Outlook
- Table 100 ProBioGen: Key Details, (CEO, HQ, Revenue, Founded, No. of Employees, Company Type, Website, Business Segment)
- Table 101 ProBioGen: Service Benchmarking
- Table 102 ProBioGen: Strategic Outlook
- Table 103 Rentschler Biopharma SE: Key Details, (CEO, HQ, Revenue, Founded, No. of Employees, Company Type, Website, Business Segment)
- Table 104 Rentschler Biopharma SE: Service Benchmarking
- Table 105 Rentschler Biopharma SE: Strategic Outlook
- Table 106 Samsung Biologics: Key Details, (CEO, HQ, Revenue, Founded, No. of Employees, Company Type, Website, Business Segment)
- Table 107 Samsung Biologics: Service Benchmarking
- Table 108 Samsung Biologics: Strategic Outlook
- Table 109 Sandoz: Key Details, (CEO, HQ, Revenue, Founded, No. of Employees, Company Type, Website, Business Segment)
- Table 110 Sandoz: Service Benchmarking
- Table 111 Sandoz: Strategic Outlook
- Table 112 TOYOBO CO., LTD.: Key Details, (CEO, HQ, Revenue, Founded, No. of Employees, Company Type, Website, Business Segment)
- Table 113 TOYOBO CO., LTD.: Service Benchmarking
- Table 114 WuXi Biologics: Key Details, (CEO, HQ, Revenue, Founded, No. of Employees, Company Type, Website, Business Segment)
- Table 115 WuXi Biologics: Service Benchmarking
- Table 116 WuXi Biologics: Strategic Outlook
- Table 117 JRS PHARMA: Key Details, (CEO, HQ, Revenue, Founded, No. of Employees, Company Type, Website, Business Segment)
- Table 118 JRS PHARMA: Service Benchmarking
- Table 119 JRS PHARMA: Strategic Outlook
- Table 120 Thermo Fisher Scientific: Key Details, (CEO, HQ, Revenue, Founded, No. of Employees, Company Type, Website, Business Segment)
- Table 121 Thermo Fisher Scientific: Service Benchmarking
- Table 122 Cambrex Corporation: Key Details, (CEO, HQ, Revenue, Founded, No. of Employees, Company Type, Website, Business Segment)
- Table 123 Cambrex Corporation: Service Benchmarking
- Table 124 Cambrex Corporation: Strategic Outlook
- Table 125 Curia Global, Inc.: Key Details, (CEO, HQ, Revenue, Founded, No. of Employees, Company Type, Website, Business Segment)
- Table 126 Curia Global, Inc.: Service Benchmarking
- Table 127 Curia Global, Inc.: Strategic Outlook
- Table 128 Pfizer CentreOne: Key Details, (CEO, HQ, Revenue, Founded, No. of Employees, Company Type, Website, Business Segment)
- Table 129 Pfizer CentreOne: Service Benchmarking
- Table 130 Jubilant Pharma Limited: Key Details, (CEO, HQ, Revenue, Founded, No. of Employees, Company Type, Website, Business Segment)
- Table 131 Jubilant Pharma Limited: Service Benchmarking
- Table 132 Catalent, Inc: Key Details, (CEO, HQ, Revenue, Founded, No. of Employees, Company Type, Website, Business Segment)
- Table 133 Catalent, Inc: Service Benchmarking
- Table 134 Catalent, Inc: Strategic Outlook
- Table 135 KBI Biopharma: Key Details, (CEO, HQ, Revenue, Founded, No. of Employees, Company Type, Website, Business Segment)
- Table 136 KBI Biopharma: Service Benchmarking
- Table 137 KBI Biopharma: Strategic Outlook
- Table 138 Cytiva: Key Details, (CEO, HQ, Revenue, Founded, No. of Employees, Company Type, Website, Business Segment)
- Table 139 Cytiva: Service Benchmarking
- Table 140 Cytiva: Strategic Outlook
List of Figures
- Figure 1 Biopharmaceuticals Contract Manufacturing Market Segmentation
- Figure 2 Biopharmaceuticals Contract Manufacturing Market: Market Dynamics
- Figure 3 Biopharmaceuticals Contract Manufacturing Market by Region, 2023-2033 (US$ Mn, AGR %): "V" Shaped Recovery
- Figure 4 Biopharmaceuticals Contract Manufacturing Market by Region, 2023-2033 (US$ Mn, AGR %): "U" Shaped Recovery
- Figure 5 Biopharmaceuticals Contract Manufacturing Market by Region, 2023-2033 (US$ Mn, AGR %): "W" Shaped Recovery
- Figure 6 Biopharmaceuticals Contract Manufacturing Market by Region, 2023-2033 (US$ Mn, AGR %): "L" Shaped Recovery
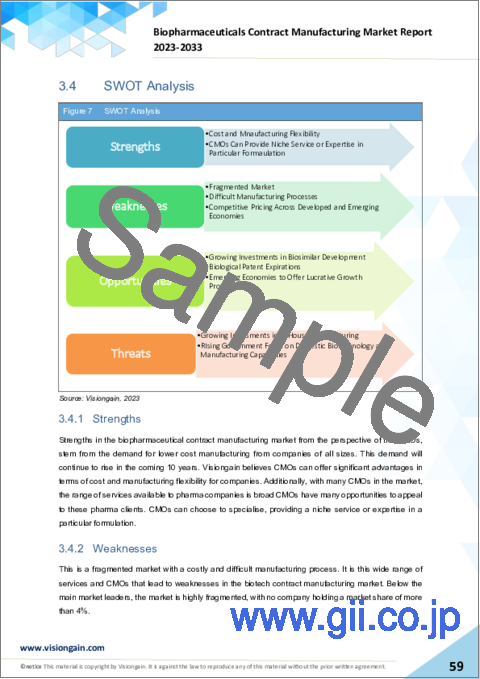
- Figure 7 SWOT Analysis
- Figure 8 Porter's Five Forces Analysis
- Figure 9 PEST Analysis
- Figure 10 Biopharmaceuticals Contract Manufacturing Market Attractiveness Index by Source
- Figure 11 Biopharmaceuticals Contract Manufacturing Market Forecast by Source, 2023-2033 (US$ Million, AGR %)
- Figure 12 Biopharmaceuticals Contract Manufacturing Market Share Forecast by Source, 2023, 2028, 2033 (%)
- Figure 13 Mammalian Segment Market Forecast by Region, 2023-2033 (US$ Million, AGR %)
- Figure 14 Mammalian Segment Market Share Forecast by Region, 2023 & 2033 (%)
- Figure 15 Non-mammalian Segment Market Forecast by Region, 2023-2033 (US$ Million, AGR %)
- Figure 16 Non-mammalian Segment Market Share Forecast by Region, 2023 & 2033 (%)
- Figure 17 Biopharmaceuticals Contract Manufacturing Market Attractiveness Index by Source
- Figure 18 Biopharmaceuticals Contract Manufacturing Market Forecast by Service, 2023-2033 (US$ Million, AGR %)
- Figure 19 Biopharmaceuticals Contract Manufacturing Market Share Forecast by Service, 2023, 2028, 2033 (%)
- Figure 20 Process Development Segment Market Forecast by Region, 2023-2033 (US$ Million, AGR %)
- Figure 21 Process Development Segment Market Share Forecast by Region, 2023 & 2033 (%)
- Figure 22 Process Development Segment Market Forecast by Type, 2023-2033 (US$ Million, AGR %)
- Figure 23 Fill & Finish Operations Segment Market Forecast by Region, 2023-2033 (US$ Million, AGR %)
- Figure 24 Fill & Finish Operations Segment Market Share Forecast by Region, 2023 & 2033 (%)
- Figure 25 Analytical & QC Studies Segment Market Forecast by Region, 2023-2033 (US$ Million, AGR %)
- Figure 26 Analytical & QC Studies Segment Market Share Forecast by Region, 2023 & 2033 (%)
- Figure 27 Packaging Segment Market Forecast by Region, 2023-2033 (US$ Million, AGR %)
- Figure 28 Packaging Segment Market Share Forecast by Region, 2023 & 2033 (%)
- Figure 29 Biopharmaceuticals Contract Manufacturing Market Attractiveness Index by Product
- Figure 30 Biopharmaceuticals Contract Manufacturing Market Forecast by Product, 2023-2033 (US$ Million, AGR %)
- Figure 31 Biopharmaceuticals Contract Manufacturing Market Share Forecast by Product, 2023, 2028, 2033 (%)
- Figure 32 Biologics Segment Market Forecast by Region, 2023-2033 (US$ Million, AGR %)
- Figure 33 Biologics Segment Market Share Forecast by Region, 2023 & 2033 (%)
- Figure 34 Biologics Segment Market Forecast by Type, 2023-2033 (US$ Million, AGR %)
- Figure 35 Biosimilars Segment Market Forecast by Region, 2023-2033 (US$ Million, AGR %)
- Figure 36 Biosimilars Segment Market Share Forecast by Region, 2023 & 2033 (%)
- Figure 37 Biopharmaceuticals Contract Manufacturing Market Attractiveness Index by Scale of Operation
- Figure 38 Biopharmaceuticals Contract Manufacturing Market Forecast by Scale of Operation, 2023-2033 (US$ Million, AGR %)
- Figure 39 Biopharmaceuticals Contract Manufacturing Market Share Forecast by Scale of Operation, 2023, 2028, 2033 (%)
- Figure 40 Preclinical Segment Market Forecast by Region, 2023-2033 (US$ Million, AGR %)
- Figure 41 Preclinical Segment Market Share Forecast by Region, 2023 & 2033 (%)
- Figure 42 Clinical Segment Market Forecast by Region, 2023-2033 (US$ Million, AGR %)
- Figure 43 Clinical Segment Market Share Forecast by Region, 2023 & 2033 (%)
- Figure 44 Commercial Segment Market Forecast by Region, 2023-2033 (US$ Million, AGR %)
- Figure 45 Commercial Segment Market Share Forecast by Region, 2023 & 2033 (%)
- Figure 46 Biopharmaceuticals Contract Manufacturing Market Attractiveness Index by Company Size
- Figure 47 Biopharmaceuticals Contract Manufacturing Market Forecast by Company Size, 2023-2033 (US$ Million, AGR %)
- Figure 48 Biopharmaceuticals Contract Manufacturing Market Share Forecast by Company Size, 2023, 2028, 2033 (%)
- Figure 49 Small Segment Market Forecast by Region, 2023-2033 (US$ Million, AGR %)
- Figure 50 Small Segment Market Share Forecast by Region, 2023 & 2033 (%)
- Figure 51 Mid-sized Segment Market Forecast by Region, 2023-2033 (US$ Million, AGR %)
- Figure 52 Mid-sized Segment Market Share Forecast by Region, 2023 & 2033 (%)
- Figure 53 Large Segment Market Forecast by Region, 2023-2033 (US$ Million, AGR %)
- Figure 54 Large Segment Market Share Forecast by Region, 2023 & 2033 (%)
- Figure 55 Biopharmaceuticals Contract Manufacturing Market Forecast by Region 2023, 2028, 2033 (Revenue, CAGR%)
- Figure 56 Biopharmaceuticals Contract Manufacturing Market Share Forecast by Region 2023, 2028, 2033 (%)
- Figure 57 Biopharmaceuticals Contract Manufacturing Market by Region, 2023-2033 (US$ Mn)
- Figure 58 North America Biopharmaceuticals Contract Manufacturing Market Attractiveness Index
- Figure 59 North America Biopharmaceuticals Contract Manufacturing Market by Region, 2023, 2028 & 2033 (US$ million)
- Figure 60 North America Biopharmaceuticals Contract Manufacturing Market Forecast by Country, 2023-2033 (US$ Million, AGR %)
- Figure 61 North America Biopharmaceuticals Contract Manufacturing Market Share Forecast by Country, 2023 & 2033 (%)
- Figure 62 North America Biopharmaceuticals Contract Manufacturing Market Forecast by Source, 2023-2033 (US$ Million, AGR %)
- Figure 63 North America Biopharmaceuticals Contract Manufacturing Market Share Forecast by Source, 2023 & 2033 (%)
- Figure 64 North America Biopharmaceuticals Contract Manufacturing Market Forecast by Service, 2023-2033 (US$ Million, AGR %)
- Figure 65 North America Biopharmaceuticals Contract Manufacturing Market Share Forecast by Service, 2023 & 2033 (%)
- Figure 66 North America Biopharmaceuticals Contract Manufacturing Market Forecast by Product, 2023-2033 (US$ Million, AGR %)
- Figure 67 North America Biopharmaceuticals Contract Manufacturing Market Share Forecast by Product, 2023 & 2033 (%)
- Figure 68 North America Biopharmaceuticals Contract Manufacturing Market Forecast by Scale of Operation, 2023-2033 (US$ Million, AGR %)
- Figure 69 North America Biopharmaceuticals Contract Manufacturing Market Share Forecast by Scale of Operation, 2023 & 2033 (%)
- Figure 70 North America Biopharmaceuticals Contract Manufacturing Market Forecast by Company Size, 2023-2033 (US$ Million, AGR %)
- Figure 71 North America Biopharmaceuticals Contract Manufacturing Market Share Forecast by Company Size, 2023 & 2033 (%)
- Figure 72 U.S. Biopharmaceuticals Contract Manufacturing Market Forecast, 2023-2033 (US$ Million, AGR %)
- Figure 73 Canada Biopharmaceuticals Contract Manufacturing Market Forecast, 2023-2033 (US$ Million, AGR %)
- Figure 74 Europe Biopharmaceuticals Contract Manufacturing Market Attractiveness Index
- Figure 75 Europe Biopharmaceuticals Contract Manufacturing Market by Region, 2023, 2028 & 2033 (US$ million)
- Figure 76 Europe Biopharmaceuticals Contract Manufacturing Market Share Forecast by Country, 2023 & 2033 (%)
- Figure 77 Europe Biopharmaceuticals Contract Manufacturing Market Forecast by Source, 2023-2033 (US$ Million, AGR %)
- Figure 78 Europe Biopharmaceuticals Contract Manufacturing Market Share Forecast by Source, 2023 & 2033 (%)
- Figure 79 Europe Biopharmaceuticals Contract Manufacturing Market Forecast by Service, 2023-2033 (US$ Million, AGR %)
- Figure 80 Europe Biopharmaceuticals Contract Manufacturing Market Share Forecast by Service, 2023 & 2033 (%)
- Figure 81 Europe Biopharmaceuticals Contract Manufacturing Market Forecast by Product, 2023-2033 (US$ Million, AGR %)
- Figure 82 Europe Biopharmaceuticals Contract Manufacturing Market Share Forecast by Product, 2023 & 2033 (%)
- Figure 83 Europe Biopharmaceuticals Contract Manufacturing Market Forecast by Scale of Operation, 2023-2033 (US$ Million, AGR %)
- Figure 84 Europe Biopharmaceuticals Contract Manufacturing Market Share Forecast by Scale of Operation, 2023 & 2033 (%)
- Figure 85 Europe Biopharmaceuticals Contract Manufacturing Market Forecast by Company Size, 2023-2033 (US$ Million, AGR %)
- Figure 86 Europe Biopharmaceuticals Contract Manufacturing Market Share Forecast by Company Size, 2023 & 2033 (%)
- Figure 87 Germany Biopharmaceuticals Contract Manufacturing Market Forecast, 2023-2033 (US$ million, AGR %)
- Figure 88 UK Biopharmaceuticals Contract Manufacturing Market Forecast, 2023-2033 (US$ million, AGR %)
- Figure 89 France Biopharmaceuticals Contract Manufacturing Market Forecast, 2023-2033 (US$ million, AGR %)
- Figure 90 Italy Biopharmaceuticals Contract Manufacturing Market Forecast, 2023-2033 (US$ million, AGR %)
- Figure 91 Spain Biopharmaceuticals Contract Manufacturing Market Forecast, 2023-2033 (US$ million, AGR %)
- Figure 92 Russia Biopharmaceuticals Contract Manufacturing Market Forecast, 2023-2033 (US$ million, AGR %)
- Figure 93 Rest of Europe Biopharmaceuticals Contract Manufacturing Market Forecast, 2023-2033 (US$ million, AGR %)
- Figure 94 Asia Pacific Biopharmaceuticals Contract Manufacturing Market Attractiveness Index
- Figure 95 Asia Pacific Biopharmaceuticals Contract Manufacturing Market by Region, 2023, 2028 & 2033 (US$ million)
- Figure 96 Asia Pacific Biopharmaceuticals Contract Manufacturing Market Forecast by Country, 2023-2033 (US$ Million, AGR %)
- Figure 97 Asia Pacific Biopharmaceuticals Contract Manufacturing Market Share Forecast by Country, 2023 & 2033 (%)
- Figure 98 Asia Pacific Biopharmaceuticals Contract Manufacturing Market Forecast by Source, 2023-2033 (US$ Million, AGR %)
- Figure 99 Asia Pacific Biopharmaceuticals Contract Manufacturing Market Share Forecast by Source, 2023 & 2033 (%)
- Figure 100 Asia Pacific Biopharmaceuticals Contract Manufacturing Market Forecast by Service, 2023-2033 (US$ Million, AGR %)
- Figure 101 Asia Pacific Biopharmaceuticals Contract Manufacturing Market Share Forecast by Service, 2023 & 2033 (%)
- Figure 102 Asia Pacific Biopharmaceuticals Contract Manufacturing Market Forecast by Product, 2023-2033 (US$ Million, AGR %)
- Figure 103 Asia Pacific Biopharmaceuticals Contract Manufacturing Market Share Forecast by Product, 2023 & 2033 (%)
- Figure 104 Asia Pacific Biopharmaceuticals Contract Manufacturing Market Forecast by Scale of Operation, 2023-2033 (US$ Million, AGR %)
- Figure 105 Asia Pacific Biopharmaceuticals Contract Manufacturing Market Share Forecast by Scale of Operation, 2023 & 2033 (%)
- Figure 106 Asia Pacific Biopharmaceuticals Contract Manufacturing Market Forecast by Company Size, 2023-2033 (US$ Million, AGR %)
- Figure 107 Asia Pacific Biopharmaceuticals Contract Manufacturing Market Share Forecast by Company Size, 2023 & 2033 (%)
- Figure 108 Japan Biopharmaceuticals Contract Manufacturing Market Forecast, 2023-2033 (US$ million, AGR %)
- Figure 109 China Biopharmaceuticals Contract Manufacturing Market Forecast, 2023-2033 (US$ million, AGR %)
- Figure 110 India Biopharmaceuticals Contract Manufacturing Market Forecast, 2023-2033 (US$ million, AGR %)
- Figure 111 Australia Biopharmaceuticals Contract Manufacturing Market Forecast, 2023-2033 (US$ million, AGR %)
- Figure 112 South-East Asia Biopharmaceuticals Contract Manufacturing Market Forecast, 2023-2033 (US$ million, AGR %)
- Figure 113 Rest of Asia Pacific Biopharmaceuticals Contract Manufacturing Market Forecast, 2023-2033 (US$ million, AGR %)
- Figure 114 Latin America Biopharmaceuticals Contract Manufacturing Market Attractiveness Index
- Figure 115 Latin America Biopharmaceuticals Contract Manufacturing Market by Region, 2023, 2028 & 2033 (US$ million)
- Figure 116 Latin America Biopharmaceuticals Contract Manufacturing Market Share Forecast by Country, 2023 & 2033 (%)
- Figure 117 Latin America Biopharmaceuticals Contract Manufacturing Market Forecast by Source, 2023-2033 (US$ Million, AGR %)
- Figure 118 Latin America Biopharmaceuticals Contract Manufacturing Market Share Forecast by Source, 2023 & 2033 (%)
- Figure 119 Latin America Biopharmaceuticals Contract Manufacturing Market Forecast by Service, 2023-2033 (US$ Million, AGR %)
- Figure 120 Latin America Biopharmaceuticals Contract Manufacturing Market Share Forecast by Service, 2023 & 2033 (%)
- Figure 121 Latin America Biopharmaceuticals Contract Manufacturing Market Forecast by Product, 2023-2033 (US$ Million, AGR %)
- Figure 122 Latin America Biopharmaceuticals Contract Manufacturing Market Share Forecast by Product, 2023 & 2033 (%)
- Figure 123 Latin America Biopharmaceuticals Contract Manufacturing Market Forecast by Scale of Operation, 2023-2033 (US$ Million, AGR %)
- Figure 124 Latin America Biopharmaceuticals Contract Manufacturing Market Share Forecast by Scale of Operation, 2023 & 2033 (%)
- Figure 125 Latin America Biopharmaceuticals Contract Manufacturing Market Forecast by Company Size, 2023-2033 (US$ Million, AGR %)
- Figure 126 Latin America Biopharmaceuticals Contract Manufacturing Market Share Forecast by Company Size, 2023 & 2033 (%)
- Figure 127 Brazil Biopharmaceuticals Contract Manufacturing Market Forecast, 2023-2033 (US$ million, AGR %)
- Figure 128 Mexico Biopharmaceuticals Contract Manufacturing Market Forecast, 2023-2033 (US$ million, AGR %)
- Figure 129 Argentina Biopharmaceuticals Contract Manufacturing Market Forecast, 2023-2033 (US$ million, AGR %)
- Figure 130 Colombia Biopharmaceuticals Contract Manufacturing Market Forecast, 2023-2033 (US$ million, AGR %)
- Figure 131 Rest of Latin America Biopharmaceuticals Contract Manufacturing Market Forecast, 2023-2033 (US$ million, AGR %)
- Figure 132 MEA Biopharmaceuticals Contract Manufacturing Market Attractiveness Index
- Figure 133 MEA Biopharmaceuticals Contract Manufacturing Market by Region, 2023, 2028 & 2033 (US$ million)
- Figure 134 MEA Biopharmaceuticals Contract Manufacturing Market Forecast by Country, 2023-2033 (US$ Million, AGR %)
- Figure 135 MEA Biopharmaceuticals Contract Manufacturing Market Share Forecast by Country, 2023 & 2033 (%)
- Figure 136 MEA Biopharmaceuticals Contract Manufacturing Market Forecast by Source, 2023-2033 (US$ Million, AGR %)
- Figure 137 MEA Biopharmaceuticals Contract Manufacturing Market Share Forecast by Source, 2023 & 2033 (%)
- Figure 138 MEA Biopharmaceuticals Contract Manufacturing Market Forecast by Service, 2023-2033 (US$ Million, AGR %)
- Figure 139 MEA Biopharmaceuticals Contract Manufacturing Market Share Forecast by Service, 2023 & 2033 (%)
- Figure 140 MEA Biopharmaceuticals Contract Manufacturing Market Forecast by Product, 2023-2033 (US$ Million, AGR %)
- Figure 141 MEA Biopharmaceuticals Contract Manufacturing Market Share Forecast by Product, 2023 & 2033 (%)
- Figure 142 MEA Biopharmaceuticals Contract Manufacturing Market Forecast by Scale of Operation, 2023-2033 (US$ Million, AGR %)
- Figure 143 MEA Biopharmaceuticals Contract Manufacturing Market Share Forecast by Scale of Operation, 2023 & 2033 (%)
- Figure 144 MEA Biopharmaceuticals Contract Manufacturing Market Forecast by Company Size, 2023-2033 (US$ Million, AGR %)
- Figure 145 MEA Biopharmaceuticals Contract Manufacturing Market Share Forecast by Company Size, 2023 & 2033 (%)
- Figure 146 GCC Biopharmaceuticals Contract Manufacturing Market Forecast, 2023-2033 (US$ million, AGR %)
- Figure 147 South Africa Biopharmaceuticals Contract Manufacturing Market Forecast, 2023-2033 (US$ million, AGR %)
- Figure 148 Rest of MEA Biopharmaceuticals Contract Manufacturing Market Forecast, 2023-2033 (US$ million, AGR %)
- Figure 149 AbbVie, Inc.: Net Revenue, 2015-2022 (US$ million, AGR%)
- Figure 150 AbbVie, Inc.: R&D Expenses, 2015-2022 (US$ million, AGR%)
- Figure 151 AbbVie, Inc.: Regional Market Shares, 2022 (%)
- Figure 152 Avantor, Inc.: Net Revenue, 2017-2022 (US$ million, AGR%)
- Figure 153 Avantor, Inc.: Regional Market Share (AGR%)
- Figure 154 Boehringer Ingelheim GmbH: Net Revenue, 2015-2021 (US$ million, AGR%)
- Figure 155 Lonza: Net Revenue, 2015-2022 (US$ million, AGR%)
- Figure 156 Lonza: R&D Expenses, 2017-2021 (US$ million, AGR%)
- Figure 157 Sandoz: Net Revenue, 2015-2022 (US$ million, AGR%)
- Figure 158 Sandoz: Regional Market Share (AGR%)
- Figure 159 WuXi Biologics: Net Revenue, 2015-2022 (US$ million, AGR%)
- Figure 160 WuXi Biologics: Regional Market Shares, 2022 (%)
- Figure 161 Thermo Fisher Scientific: Net Revenue, 2015-2022 (US$ million, AGR%)
- Figure 162 Thermo Fisher Scientific: R&D, 2015-2022 (US$ million, AGR%)
- Figure 163 Thermo Fisher Scientific: Regional Market Shares, 2022 (%)
- Figure 164 Pfizer CentreOne: Net Revenue, 2015-2022 (US$ million, AGR%)
- Figure 165 Pfizer CentreOne: R&D, 2015-2022 (US$ million, AGR%)
- Figure 166 Pfizer CentreOne: Regional Market Shares, 2022 (%)
- Figure 167 Catalent, Inc: Net Revenue, 2015-2022 (US$ million, AGR%)
The global Biopharmaceuticals Contract Manufacturing market is projected to grow at a CAGR of 10% by 2033.
“The Biopharmaceuticals Contract Manufacturing Market Report 2023-2033”: This report will prove invaluable to leading firms striving for new revenue pockets if they wish to better understand the industry and its underlying dynamics. It will be useful for companies that would like to expand into different industries or to expand their existing operations in a new region.
Every year, new and unique drug products and technologies come out. This changes the way biopharma works and what kinds of treatments are possible. This is partly because outsourcing gives them the ability and freedom to do so. Emerging and virtual companies that are driving the future pipeline depend heavily on external development partners, and not just for hard-to-make products. Even more well-known companies are signing contracts with CDMOs to get access to their resources and certain skills. In cell and gene therapy (CGT), many of the chemistry, manufacturing, and control (CMC) jobs, such as process development, analytical development, testing, manufacturing, and filling and finishing, are done by outside companies. Outsourcing can happen at almost any point in the life cycle of a treatment, all the way up until it goes on the market.
CGTs have problems that require expensive and hard-to-find consumables, tools, space, and talent. This could lead a company to think about outsourcing clinical through commercial manufacturing processes. Big companies have the means to develop and make products, but they may need help with certain tasks, such as specialised analytical assays or studies to improve the way a process works. Small companies, which make up most of the advanced biotherapeutic developers right now, don't have a lot of internal development and manufacturing capacity or experience, so they tend to outsource process development, process scaling up, and manufacturing.
What Questions Should You Ask before Buying a Market Research Report?
- How is the biopharmaceuticals contract manufacturing market evolving?
- What is driving and restraining the biopharmaceuticals contract manufacturing market?
- How will each biopharmaceuticals contract manufacturing submarket segment grow over the forecast period and how much revenue will these submarkets account for in 2033?
- How will the market shares for each biopharmaceuticals contract manufacturing submarket develop from 2023 to 2033?
- What will be the main driver for the overall market from 2023 to 2033?
- Will leading biopharmaceuticals contract manufacturing markets broadly follow the macroeconomic dynamics, or will individual national markets outperform others?
- How will the market shares of the national markets change by 2033 and which geographical region will lead the market in 2033?
- Who are the leading players and what are their prospects over the forecast period?
- What are the biopharmaceuticals contract manufacturing projects for these leading companies?
- How will the industry evolve during the period between 2023 and 2033? What are the implications of biopharmaceuticals contract manufacturing projects taking place now and over the next 10 years?
- Is there a greater need for product commercialisation to further scale the biopharmaceuticals contract manufacturing market?
- Where is the biopharmaceuticals contract manufacturing market heading and how can you ensure you are at the forefront of the market?
- What are the best investment options for new product and service lines?
- What are the key prospects for moving companies into a new growth path and C-suite?
You need to discover how this will impact the biopharmaceuticals contract manufacturing market today, and over the next 10 years:
- Our 358-page report provides 140 tables and 167 charts/graphs exclusively to you
- The report highlights key lucrative areas in the industry so you can target them - NOW
- It contains in-depth analysis of global, regional and national sales and growth
- It highlights for you the key successful trends, changes and revenue projections made by your competitors.
This report tells you TODAY how the biopharmaceuticals contract manufacturing market will develop in the next 10 years, and in line with the variations in COVID-19 economic recession and bounce. This market is more critical now than at any point over the last 10 years.
Forecasts to 2033 and other analyses reveal commercial prospects
- In addition to revenue forecasting to 2033, our new study provides you with recent results, growth rates, and market shares
- You will find original analyses, with business outlooks and developments
- Discover qualitative analyses (including market dynamics, drivers, opportunities, and restraints), Porter's Five Forces Analysis, PEST Analysis and recent developments.
This report includes data analysis and invaluable insight into how COVID-19 will affect the industry and your company. Four COVID-19 recovery patterns and their impact, namely, ""V" ", "L", "W" and "U" are discussed in this report.
Segments Covered in the Report:
Source
- Mammalian
- Non-mammalian
Service
- Process Development
- Fill & Finish Operations
- Analytical & QC Studies
- Packaging
Product
- Biologics
- Biosimilars
Company Size
- Small
- Mid-sized
- Large
Scale of Operations
- Preclinical
- Clinical
- Commercial
In addition to the revenue predictions for the overall world market and segments, you will also find revenue forecasts for five regional and 23 leading national markets:
North America
- U.S
- Canada
Europe
- Germany
- UK
- France
- Italy
- Spain
- Russia
- Rest of Europe
Asia Pacific
- Japan
- China
- India
- Australia
- South-East Asia
- Rest of Asia Pacific
Latin America
- Brazil
- Mexico
- Argentina
- Colombia
- Rest of Latin America
MEA
- GCC
- South Africa
- Rest of MEA
The report also includes profiles and for some of the leading companies in the Biopharmaceuticals Contract Manufacturing Market, 2023 to 2033, with a focus on this segment of these companies' operations.
Leading companies and the potential for market growth:
|
|
Overall world revenue for Biopharmaceuticals Contract Manufacturing Market, 2023 to 2033 in terms of value the market will surpass US$15,280.0 million in 2023, our work calculates. We predict strong revenue growth through to 2033. Our work identifies which organizations hold the greatest potential. Discover their capabilities, progress, and commercial prospects, helping you stay ahead.
How will the Biopharmaceuticals Contract Manufacturing Market, 2023 to 2033 report help you?
In summary, our 350+ page report provides you with the following knowledge:
- Revenue forecasts to 2033 for Biopharmaceuticals Contract Manufacturing Market, 2023 to 2033 Market, with forecasts for Source, service, product, company size, and scale of operations, each forecast at a global and regional level - discover the industry's prospects, finding the most lucrative places for investments and revenues.
- Revenue forecasts to 2033 for five regional and 23 key national markets - See forecasts for the Biopharmaceuticals Contract Manufacturing Market, 2023 to 2033 market in North America, Europe, Asia-Pacific, Latin America, and MEA. Also forecasted is the market in the US, Canada, Mexico, Brazil, Germany, France, UK, Italy, China, India, Japan, and Australia among other prominent economies.
- Prospects for established firms and those seeking to enter the market - including company profiles for 22 of the major companies involved in the Biopharmaceuticals Contract Manufacturing Market, 2023 to 2033.
Find quantitative and qualitative analyses with independent predictions. Receive information that only our report contains, staying informed with invaluable business intelligence.
Information found nowhere else
With our new report, you are less likely to fall behind in knowledge or miss out on opportunities. See how our work could benefit your research, analyses, and decisions. Our study is for everybody needing commercial analyses for the Biopharmaceuticals Contract Manufacturing Market, 2023 to 2033, market-leading companies. You will find data, trends and predictions.
Table of Contents
1 Report Overview
- 1.1 Objectives of the Study
- 1.2 Introduction to Biopharmaceuticals Contract Manufacturing Market
- 1.3 What This Report Delivers
- 1.4 Why You Should Read This Report
- 1.5 Key Questions Answered by This Analytical Report Include:
- 1.6 Who is This Report For?
- 1.7 Methodology
- 1.7.1 Market Definitions
- 1.7.2 Market Evaluation & Forecasting Methodology
- 1.7.3 Data Validation
- 1.7.3.1 Primary Research
- 1.7.3.2 Secondary Research
- 1.8 Frequently Asked Questions (FAQs)
- 1.9 Associated Reports
- 1.10 About
2 Executive Summary
- 2.1 Emerging Outsourcing Trends in Biopharmaceuticals
- 2.2 Demand for RNA-based COVID-19 Vaccines Creates Revenue Opportunities for Contact Manufacturers
- 2.3 Increase in Investment in Research & Development
- 2.4 Analyst Viewpoint
3 Market Overview
- 3.1 Key Findings
- 3.2 Market Dynamics
- 3.2.1 Market Driving Factors
- 3.2.1.1 Rise in Investment by CMOs for Capacity Expansion
- 3.2.1.2 Cost and Time Saving Benefits Offered by Contract Services
- 3.2.1.3 Outsourcing as a Driver for Market Growth
- 3.2.1.4 Growing Investments in Orphan Drugs
- 3.2.2 Market Restraining Factors
- 3.2.2.1 Pricing Pressure to Impede Market Growth
- 3.2.2.2 Regulatory Scenarios
- 3.2.2.3 Overcapacity Likely to Challenge Market Growth
- 3.2.3 Market Opportunities
- 3.2.3.1 Expansion of Fill and Finish CMOs
- 3.2.3.2 Emergence of Single-Use Bioprocessing Equipment & Solutions
- 3.2.3.3 Emerging Economies to Offer Lucrative Growth Opportunities
- 3.2.1 Market Driving Factors
- 3.3 COVID-19 Impact Analysis
- 3.4 SWOT Analysis
- 3.4.1 Strengths
- 3.4.2 Weaknesses
- 3.4.3 Opportunities
- 3.4.4 Threats
- 3.5 Porter's Five Forces Analysis
- 3.5.1 Buyer Power
- 3.5.2 Supplier Power
- 3.5.3 Competitive Rivalry
- 3.5.4 Threat of Substitute
- 3.5.5 Threat of New Entrants
- 3.6 PEST Analysis
- 3.6.1 Political Factors Impacting Biopharmaceuticals Contract Manufacturing Market
- 3.6.2 Economic Factors Impacting Biopharmaceuticals Contract Manufacturing Market
- 3.6.3 Social Factors Impacting Biopharmaceuticals Contract Manufacturing Market
- 3.6.4 Technological Factors Impacting Biopharmaceuticals Contract Manufacturing Market
4 Biopharmaceuticals Contract Manufacturing Market Analysis by Source
- 4.1 Key Findings
- 4.2 Source Segment: Market Attractiveness Index
- 4.3 Biopharmaceuticals Contract Manufacturing Market Size Estimation and Forecast by Source
- 4.4 Mammalian
- 4.4.1 Market Forecast by Region, 2023-2033 (US$ Mn)
- 4.4.2 Market Share by Region, 2023 & 2033 (%)
- 4.5 Non-mammalian
- 4.5.1 Market Forecast by Region, 2023-2033 (US$ Mn)
- 4.5.2 Market Share by Region, 2023 & 2033 (%)
5 Biopharmaceuticals Contract Manufacturing Market Analysis by Service
- 5.1 Key Findings
- 5.2 Service Segment: Market Attractiveness Index
- 5.3 Biopharmaceuticals Contract Manufacturing Market Size Estimation and Forecast by Service
- 5.4 Process Development
- 5.4.1 Upstream Process Development
- 5.4.2 Downstream Process Development
- 5.4.3 Market Forecast by Region, 2023-2033 (US$ Mn)
- 5.4.4 Market Share by Region, 2023 & 2033 (%)
- 5.4.4.1 Market Forecast by Type, 2023-2033 (US$ Mn)
- 5.5 Fill & Finish Operations
- 5.5.1 Market Forecast by Region, 2023-2033 (US$ Mn)
- 5.5.2 Market Share by Region, 2023 & 2033 (%)
- 5.6 Analytical & QC Studies
- 5.6.1 Market Forecast by Region, 2023-2033 (US$ Mn)
- 5.6.2 Market Share by Region, 2023 & 2033 (%)
- 5.7 Packaging
- 5.7.1 Market Forecast by Region, 2023-2033 (US$ Mn)
- 5.7.2 Market Share by Region, 2023 & 2033 (%)
6 Biopharmaceuticals Contract Manufacturing Market Analysis by Product
- 6.1 Key Findings
- 6.2 Product Segment: Market Attractiveness Index
- 6.3 Biopharmaceuticals Contract Manufacturing Market Size Estimation and Forecast by Product
- 6.4 Biologics
- 6.4.1 Market Forecast by Region, 2023-2033 (US$ Mn)
- 6.4.2 Market Share by Region, 2023 & 2033 (%)
- 6.4.2.1 Market Forecast by Type, 2023-2033 (US$ Mn)
- 6.5 Biosimilars
- 6.5.1 Market Forecast by Region, 2023-2033 (US$ Mn)
- 6.5.2 Market Share by Region, 2023 & 2033 (%)
7 Biopharmaceuticals Contract Manufacturing Market Analysis by Scale of Operation
- 7.1 Key Findings
- 7.2 Scale of Operation Segment: Market Attractiveness Index
- 7.3 Biopharmaceuticals Contract Manufacturing Market Size Estimation and Forecast by Scale of Operation
- 7.4 Preclinical
- 7.4.1 Market Forecast by Region, 2023-2033 (US$ Mn)
- 7.4.2 Market Share by Region, 2023 & 2033 (%)
- 7.5 Clinical
- 7.5.1 Market Forecast by Region, 2023-2033 (US$ Mn)
- 7.5.2 Market Share by Region, 2023 & 2033 (%)
- 7.6 Commercial
- 7.6.1 Market Forecast by Region, 2023-2033 (US$ Mn)
- 7.6.2 Market Share by Region, 2023 & 2033 (%)
8 Biopharmaceuticals Contract Manufacturing Market Analysis by Company Size
- 8.1 Key Findings
- 8.2 Company Size Segment: Market Attractiveness Index
- 8.3 Biopharmaceuticals Contract Manufacturing Market Size Estimation and Forecast by Company Size
- 8.4 Small
- 8.4.1 Market Forecast by Region, 2023-2033 (US$ Mn)
- 8.4.2 Market Share by Region, 2023 & 2033 (%)
- 8.5 Mid-sized
- 8.5.1 Market Forecast by Region, 2023-2033 (US$ Mn)
- 8.5.2 Market Share by Region, 2023 & 2033 (%)
- 8.6 Large
- 8.6.1 Market Forecast by Region, 2023-2033 (US$ Mn)
- 8.6.2 Market Share by Region, 2023 & 2033 (%)
9 Biopharmaceuticals Contract Manufacturing Market Analysis by Region
- 9.1 Key Findings
- 9.2 Regional Market Size Estimation and Forecast
10 North America Biopharmaceuticals Contract Manufacturing Market Analysis
- 10.1 Key Findings
- 10.2 North America Biopharmaceuticals Contract Manufacturing Market Attractiveness Index
- 10.3 Market Size by Country, 2023, 2028 & 2033 (US$ Mn)
- 10.4 Market Size Estimation and Forecast by Country, 2023-2033 (US$ Mn)
- 10.5 Market Size Estimation and Forecast by Source, 2023-2033 (US$ Mn)
- 10.6 Market Size Estimation and Forecast by Service, 2023-2033 (US$ Mn)
- 10.7 Market Size Estimation and Forecast by Product, 2023-2033 (US$ Mn)
- 10.8 Market Size Estimation and Forecast by Scale of Operation, 2023-2033 (US$ Mn)
- 10.9 Market Size Estimation and Forecast by Company Size, 2023-2033 (US$ Mn)
- 10.10 U.S. Biopharmaceuticals Contract Manufacturing Market Analysis
- 10.11 Canada Biopharmaceuticals Contract Manufacturing Market Analysis
11 Europe Biopharmaceuticals Contract Manufacturing Market Analysis
- 11.1 Key Findings
- 11.2 Europe Biopharmaceuticals Contract Manufacturing Market Attractiveness Index
- 11.3 Market Size by Country, 2023, 2028 & 2033 (US$ Mn)
- 11.4 Market Size Estimation and Forecast by Country, 2023-2033 (US$ Mn)
- 11.5 Market Size Estimation and Forecast by Source, 2023-2033 (US$ Mn)
- 11.6 Market Size Estimation and Forecast by Service, 2023-2033 (US$ Mn)
- 11.7 Market Size Estimation and Forecast by Product, 2023-2033 (US$ Mn)
- 11.8 Market Size Estimation and Forecast by Scale of Operation, 2023-2033 (US$ Mn)
- 11.9 Market Size Estimation and Forecast by Company Size, 2023-2033 (US$ Mn)
- 11.10 Germany Biopharmaceuticals Contract Manufacturing Market Analysis
- 11.11 UK Biopharmaceuticals Contract Manufacturing Market Analysis
- 11.12 France Biopharmaceuticals Contract Manufacturing Market Analysis
- 11.13 Italy Biopharmaceuticals Contract Manufacturing Market Analysis
- 11.13.1 Role of CDMO Business Across Italy
- 11.13.2 Investment by Major Players to Fuel Market Expansion
- 11.14 Spain Biopharmaceuticals Contract Manufacturing Market Analysis
- 11.15 Russia Biopharmaceuticals Contract Manufacturing Market Analysis
- 11.16 Rest of Europe Biopharmaceuticals Contract Manufacturing Market Analysis
12 Asia Pacific Biopharmaceuticals Contract Manufacturing Market Analysis
- 12.1 Key Findings
- 12.2 Asia Pacific Biopharmaceuticals Contract Manufacturing Market Attractiveness Index
- 12.3 Market Size by Country, 2023, 2028 & 2033 (US$ Mn)
- 12.4 Market Size Estimation and Forecast by Country, 2023-2033 (US$ Mn)
- 12.5 Market Size Estimation and Forecast by Source, 2023-2033 (US$ Mn)
- 12.6 Market Size Estimation and Forecast by Service, 2023-2033 (US$ Mn)
- 12.7 Market Size Estimation and Forecast by Product, 2023-2033 (US$ Mn)
- 12.8 Market Size Estimation and Forecast by Scale of Operation, 2023-2033 (US$ Mn)
- 12.9 Market Size Estimation and Forecast by Company Size, 2023-2033 (US$ Mn)
- 12.10 Japan Biopharmaceuticals Contract Manufacturing Market Analysis
- 12.11 China Biopharmaceuticals Contract Manufacturing Market Analysis
- 12.12 India Biopharmaceuticals Contract Manufacturing Market Analysis
- 12.12.1 The COVID-19 pandemic has brought India's biotechnology industry, especially biopharmaceuticals into the limelight
- 12.12.2 Piramal Pharma Ltd. Invests Minority Stake in CDMO Yapan Bio
- 12.12.3 Stelis Biopharma Limited Receives EU-GMP for Two of its Manufacturing Facilities
- 12.13 Australia Biopharmaceuticals Contract Manufacturing Market Analysis
- 12.14 South-East Asia Biopharmaceuticals Contract Manufacturing Market Analysis
- 12.15 Rest of Asia Pacific Biopharmaceuticals Contract Manufacturing Market Analysis
13 Latin America Biopharmaceuticals Contract Manufacturing Market Analysis
- 13.1 Key Findings
- 13.2 Latin America Biopharmaceuticals Contract Manufacturing Market Attractiveness Index
- 13.3 Market Size by Country, 2023, 2028 & 2033 (US$ Mn)
- 13.4 Market Size Estimation and Forecast by Country, 2023-2033 (US$ Mn)
- 13.5 Market Size Estimation and Forecast by Source, 2023-2033 (US$ Mn)
- 13.6 Market Size Estimation and Forecast by Service, 2023-2033 (US$ Mn)
- 13.7 Market Size Estimation and Forecast by Product, 2023-2033 (US$ Mn)
- 13.8 Market Size Estimation and Forecast by Scale of Operation, 2023-2033 (US$ Mn)
- 13.9 Market Size Estimation and Forecast by Company Size, 2023-2033 (US$ Mn)
- 13.10 Brazil Biopharmaceuticals Contract Manufacturing Market Analysis
- 13.11 Mexico Biopharmaceuticals Contract Manufacturing Market Analysis
- 13.12 Argentina Biopharmaceuticals Contract Manufacturing Market Analysis
- 13.13 Colombia Biopharmaceuticals Contract Manufacturing Market Analysis
- 13.14 Rest of Latin America Biopharmaceuticals Contract Manufacturing Market Analysis
14 MEA Biopharmaceuticals Contract Manufacturing Market Analysis
- 14.1 Key Findings
- 14.2 MEA Biopharmaceuticals Contract Manufacturing Market Attractiveness Index
- 14.3 Market Size by Country, 2023, 2028 & 2033 (US$ Mn)
- 14.4 Market Size Estimation and Forecast by Country, 2023-2033 (US$ Mn)
- 14.5 Market Size Estimation and Forecast by Source, 2023-2033 (US$ Mn)
- 14.6 Market Size Estimation and Forecast by Service, 2023-2033 (US$ Mn)
- 14.7 Market Size Estimation and Forecast by Product, 2023-2033 (US$ Mn)
- 14.8 Market Size Estimation and Forecast by Scale of Operation, 2023-2033 (US$ Mn)
- 14.9 Market Size Estimation and Forecast by Company Size, 2023-2033 (US$ Mn)
- 14.10 GCC Biopharmaceuticals Contract Manufacturing Market Analysis
- 14.11 South Africa Biopharmaceuticals Contract Manufacturing Market Analysis
- 14.12 Rest of MEA Biopharmaceuticals Contract Manufacturing Market Analysis
15 Company Profiles
- 15.1 AbbVie, Inc.
- 15.1.1 Company Snapshot
- 15.1.2 Company Overview
- 15.1.3 Financial Analysis
- 15.1.3.1 Net Revenue, 2015-2022
- 15.1.3.2 R&D Expenses, 2015-2022
- 15.1.3.3 Regional Market Shares, 2022
- 15.1.4 Service Benchmarking
- 15.1.5 Strategic Outlook
- 15.2 AGC Biologics
- 15.2.1 Company Snapshot
- 15.2.2 Company Overview
- 15.2.3 Service Benchmarking
- 15.2.4 Strategic Outlook
- 15.3 Avantor, Inc.
- 15.3.1 Company Snapshot
- 15.3.2 Company Overview
- 15.3.3 Financial Analysis
- 15.3.3.1 Net Revenue, 2017-2022
- 15.3.3.2 Regional Market Shares, 2021
- 15.3.4 Service Benchmarking
- 15.3.5 Strategic Outlook
- 15.4 Binex Co., Ltd.
- 15.4.1 Company Snapshot
- 15.4.2 Company Overview
- 15.4.3 Service Benchmarking
- 15.5 Boehringer Ingelheim GmbH
- 15.5.1 Company Snapshot
- 15.5.2 Company Overview
- 15.5.3 Financial Analysis
- 15.5.3.1 Net Revenue, 2015-2021
- 15.5.4 Service Benchmarking
- 15.5.5 Strategic Outlook
- 15.6 FUJIFILM Diosynth Biotechnologies
- 15.6.1 Company Snapshot
- 15.6.2 Company Overview
- 15.6.3 Service Benchmarking
- 15.6.4 Strategic Outlook
- 15.7 Lonza
- 15.7.1 Company Snapshot
- 15.7.2 Company Overview
- 15.7.3 Financial Analysis
- 15.7.3.1 Net Revenue, 2015-2022
- 15.7.3.2 R&D Expenses, 2017-2021
- 15.7.4 Service Benchmarking
- 15.7.5 Strategic Outlook
- 15.8 ProBioGen
- 15.8.1 Company Snapshot
- 15.8.2 Company Overview
- 15.8.3 Service Benchmarking
- 15.8.4 Strategic Outlook
- 15.9 Rentschler Biopharma SE
- 15.9.1 Company Snapshot
- 15.9.2 Company Overview
- 15.9.3 Service Benchmarking
- 15.9.4 Strategic Outlook
- 15.10 Samsung Biologics
- 15.10.1 Company Snapshot
- 15.10.2 Company Overview
- 15.10.3 Service Benchmarking
- 15.10.4 Strategic Outlook
- 15.11 Sandoz
- 15.11.1 Company Snapshot
- 15.11.2 Company Overview
- 15.11.3 Financial Analysis
- 15.11.3.1 Net Revenue, 2015-2022
- 15.11.3.2 Regional Market Shares, 2021
- 15.11.4 Service Benchmarking
- 15.11.5 Strategic Outlook
- 15.12 TOYOBO CO., LTD.
- 15.12.1 Company Snapshot
- 15.12.2 Company Overview
- 15.12.3 Service Benchmarking
- 15.13 WuXi Biologics
- 15.13.1 Company Snapshot
- 15.13.2 Company Overview
- 15.13.3 Financial Analysis
- 15.13.3.1 Net Revenue, 2015-2022
- 15.13.3.2 Regional Market Shares, 2022
- 15.13.4 Service Benchmarking
- 15.13.5 Strategic Outlook
- 15.14 JRS PHARMA
- 15.14.1 Company Snapshot
- 15.14.2 Company Overview
- 15.14.3 Service Benchmarking
- 15.14.4 Strategic Outlook
- 15.15 Thermo Fisher Scientific
- 15.15.1 Company Snapshot
- 15.15.2 Company Overview
- 15.15.3 Financial Analysis
- 15.15.3.1 Net Revenue, 2015-2022
- 15.15.3.2 R&D, 2015-2022
- 15.15.3.3 Regional Market Shares, 2022
- 15.15.4 Service Benchmarking
- 15.16 Cambrex Corporation
- 15.16.1 Company Snapshot
- 15.16.2 Company Overview
- 15.16.3 Service Benchmarking
- 15.16.4 Strategic Outlook
- 15.17 Curia Global, Inc.
- 15.17.1 Company Snapshot
- 15.17.2 Company Overview
- 15.17.3 Service Benchmarking
- 15.17.4 Strategic Outlook
- 15.18 Pfizer CentreOne
- 15.18.1 Company Snapshot
- 15.18.2 Company Overview
- 15.18.3 Financial Analysis
- 15.18.3.1 Net Revenue, 2015-2022
- 15.18.3.2 R&D, 2015-2022
- 15.18.3.3 Regional Market Shares, 2022
- 15.18.4 Service Benchmarking
- 15.19 Jubilant Pharma Limited
- 15.19.1 Company Snapshot
- 15.19.2 Company Overview
- 15.19.3 Service Benchmarking
- 15.20 Catalent, Inc
- 15.20.1 Company Snapshot
- 15.20.2 Company Overview
- 15.20.3 Financial Analysis
- 15.20.3.1 Net Revenue, 2015-2022
- 15.20.4 Service Benchmarking
- 15.20.5 Strategic Outlook
- 15.21 KBI Biopharma
- 15.21.1 Company Snapshot
- 15.21.2 Company Overview
- 15.21.3 Service Benchmarking
- 15.21.4 Strategic Outlook
- 15.22 Cytiva
- 15.22.1 Company Snapshot
- 15.22.2 Company Overview
- 15.22.3 Service Benchmarking
- 15.22.4 Strategic Outlook
16 Conclusion and Recommendations
- 16.1 Concluding Remarks from
- 16.2 Recommendations for Market Players