|
|
市場調査レポート
商品コード
1104591
米国の作物保護企業のチャネル・インセンティブの有効性:概要と分析Effectiveness of U.S. Crop Protection Company Channel Incentives: An Overview and Analysis |
||||||
価格
詳細については [お見積] ボタンよりお問い合わせ下さい。
お知らせ: こちらの商品は発行元の方針により価格が非公開になっております。
| 米国の作物保護企業のチャネル・インセンティブの有効性:概要と分析 |
|
出版日: 2022年09月05日
発行: Kline & Company, Inc.
ページ情報: 英文 71 Pages
納期: 即日から翌営業日
|
- 全表示
- 概要
- 目次
概要
当レポートでは、米国国内の作物保護サプライヤーが現在展開している販売チャネル向けインセンティブ戦略について分析し、流通業者・小売業者・生産者の3者の観点から、主要サプライヤーのプログラムの評価・ランキングを調査すると共に、各社のインセンティブプログラムの有効性や潜在的機会について考察しております。
当レポートの範囲
- 基礎農薬およびジェネリック農薬サプライヤーが提供する2021年チャネルインセンティブの詳細な概要と評価
- 顧客の意見に基づく上位10-12社のAg Chemサプライヤーのランキング
- 販売量の約80%を占めるプログラムの調査
- 2022年に価格、供給、プログラムが大きく変わる製品のハイライト
- 動的サプライチェーンを踏まえてサプライヤーがいかに2022年プログラムを調整するか
- 現在のプログラムの価値
- キャッシュコスト
- プログラムが売上に占める割合
- インセンティブプログラムに対する業界再編の影響
- 対象者別のプログラム詳細
- ディストリビューター
- 小売業者
- 生産者
※EXCEL ベースのデータ結果を含む
当レポートの利点
本レポートは、作物保護メーカーがディストリビューター、小売業者、生産者のインセンティブプランを開発・実行するための優れたリソースとなり、以下を提供します。
- 主要農薬メーカーの競争力のあるインセンティブプログラムに関する信頼性の高い独立した評価
- マーケティング担当者がプログラムの効果を高めるために役立つ、現在の農薬インセンティブプランに関する好き嫌いや提案の評価
- 競争の激しい市場で今後のインセンティブプログラムを計画する際のメーカーへの支援
目次
イントロダクション
サプライヤーのランキング:プログラムの有効性別
販売・プログラムの内訳:企業別
- 販売・プログラムの内訳:企業別
- 総売上高:サプライヤー別・農薬の種類別
- サプライヤー・インセンティブ・プログラムの金額:農薬の種類別
- サプライヤープログラム:販売に占める比率、農薬の種類別
- 流通業者・小売業者・生産者プログラムの種類:米国の代表的な作物保護サプライヤーの場合
各種プログラムの概略と事例
- 流通業者
- 各々のレベルで、プログラムはどのように見えるのか?
- 流通業者の本社は、現場とどのようにやり取り/通信しているのか?
- ディーラー
- 再販業者(シングルステップセグメント)
- 生産者 (栽培農家)
プログラムの価値
- 現金コスト、販売に対する割合:メーカーが提示する各種プログラム別
- 既存プログラムの明らかな効果
- プログラムに対する考え方 (好き、嫌い、提案):対象顧客別
プログラムの管理:チャネルメンバー別
- トラッキングシステムの採用
- プログラム運営に従事する人員
- コミュニケーション
プログラムへの影響 (2022年)
現在のAg経済がインセンティブプログラムに与える影響
サプライヤーインセンティブの詳細:サプライヤー別
目次
Product Code: Y801B
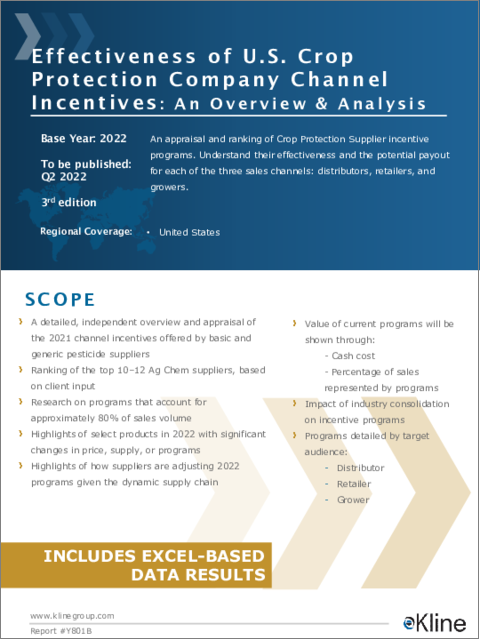
An appraisal and ranking of Crop Protection Supplier incentive programs. Understand their effectiveness and the potential payout for each of the three sales channels: distributors, retailers, and growers.
Regional Coverage: United States.
Scope
- A detailed, independent overview and appraisal of the 2021 channel incentives offered by basic and generic pesticide suppliers
- Ranking of the top 10-12 Ag Chem suppliers, based on client input
- Research on programs that account for approximately 80% of sales volume
- Highlights of select products in 2022 with significant changes in price, supply, or programs
- Highlights of how suppliers are adjusting 2022 programs given the dynamic supply chain
- Value of current programs will be shown through:
- Cash cost
- Percentage of sales represented by programs
- Impact of industry consolidation on incentive programs
- Programs detailed by target audience:
- Distributor
- Retailer
- Grower
INCLUDES EXCEL-BASED DATA RESULTS
Report Benefits
This report serves as an excellent resource for crop protection manufacturers for developing and executing distributor, retailer, and grower incentive plans, providing:
- A highly reliable and independent assessment of competitive incentive programs of the major crop protection suppliers
- An assessment of likes, dislikes, and suggestions relating to current crop protection incentive plans to help marketers increase the effectiveness of their programs
- Assistance for manufacturers in planning future incentive programs in the highly competitive marketplace
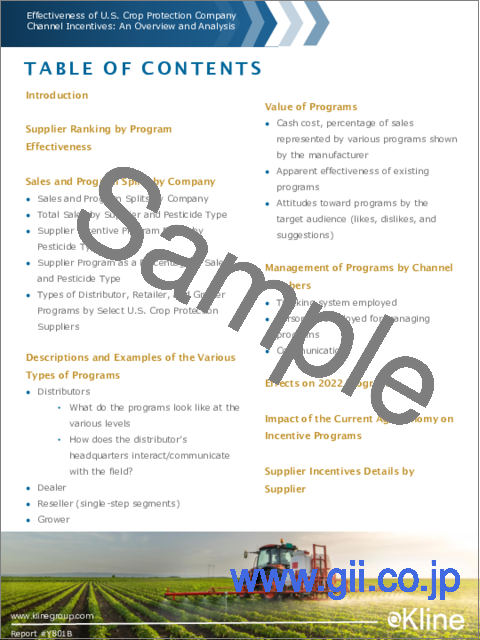
Table of Contents
Introduction
Supplier Ranking by Program Effectiveness
Sale and Program Splits by Company
- Sales and Program Splits by Company
- Total Sales by Supplier and Pesticide Type
- Supplier Incentive Program Dollar by Pesticide Type
- Supplier Program as a Percentage of Sales and Pesticide Type
- Types of Distributor, Retailer, and Grower Programs by Select U.S. Crop Protection Suppliers
Descriptions and Examples of the Various Types of Programs
- Distributors
- What do the programs look like at the various levels?
- How does the distributor's headquarters interact/communicate with the field?
- Dealer
- Reseller (single step segments)
- Grower
Value of Programs
- Cash cost, percentage of sales represented by various programs shown by the manufacturer
- Apparent effectiveness of existing programs
- Attitudes toward programs by the target audience (likes, dislikes, and suggestions)
Management of Programs by Channel Members
- Tracking system employed
- Personnel employed for managing programs
- Communications
Effects on 2022 Programs
Impact of the Current Ag Economy on Incentive Programs
Supplier Incentive Details by Supplier
お電話でのお問い合わせ
044-952-0102
( 土日・祝日を除く )


