|
|
市場調査レポート
商品コード
1102115
不凍タンパク質の世界市場-市場規模、シェア、業界動向:タイプ別(タイプⅠ、タイプⅢ、不凍糖タンパク質)、形態別(固体、液体)、供給源別(魚、その他)、最終用途別、地域別-展望および予測(2022年~2028年)Global Antifreeze Protein Market Size, Share & Industry Trends Analysis Report By Type (Type I, Type III, Antifreeze Glycoprotein), By Form (Solid and Liquid), By Source (Fish and Others), By End-use, By Regional Outlook and Forecast, 2022 - 2028 |
||||||
|
|
|||||||


| 不凍タンパク質の世界市場-市場規模、シェア、業界動向:タイプ別(タイプⅠ、タイプⅢ、不凍糖タンパク質)、形態別(固体、液体)、供給源別(魚、その他)、最終用途別、地域別-展望および予測(2022年~2028年) |
|
出版日: 2022年06月30日
発行: KBV Research
ページ情報: 英文 228 Pages
納期: 即納可能
|
- 全表示
- 概要
- 図表
- 目次
世界の不凍タンパク質の市場規模は、予測期間中に25.7%のCAGRで成長し、2028年には2,900万米ドルに達すると予測されます。
不凍タンパク質の利点に対する認知度の向上、新興国における市場の拡大は、不凍タンパク質市場の成長を促進しています。しかし、食品への応用が限定的であることが、市場の成長を抑制しています。
当レポートでは、世界の不凍タンパク質市場について調査しており、市場概要、市場分析、企業プロファイルなど、包括的な情報を提供しています。
目次
第1章 市場の範囲と調査手法
第2章 市場概要
- イントロダクション
- 市場に影響を与える主な要因
第3章 世界の不凍タンパク質市場:タイプ別
- 世界のタイプⅠ市場:地域別
- 世界のタイプⅢ市場:地域別
- 世界の不凍糖タンパク質市場:地域別
- 世界のその他市場:地域別
第4章 世界の不凍タンパク質市場:形態別
- 世界の固体市場:地域別
- 世界の液体市場:地域別
第5章 世界の不凍タンパク質市場:供給源別
- 世界の魚市場:地域別
- 世界のその他市場:地域別
第6章 世界の不凍タンパク質市場:最終用途別
- 世界の医療市場:地域別
- 世界の食品市場:地域別
- 世界の化粧品市場:地域別
- 世界のその他市場:地域別
第7章 世界の不凍タンパク質市場:地域別
- 北米の不凍タンパク質市場
- 欧州の不凍タンパク質市場
- アジア太平洋の不凍タンパク質市場
- ラテンアメリカ・中東・アフリカの不凍タンパク質市場
第8章 企業プロファイル
- Kaneka Corporation
- Unilever PLC
- Nichirei Corporation
- A/F Protein Canada, Inc.
- Sirona Biochem Corporation
- Protokinetix, Inc.
- Shanghai Yu Tao Industrial Co., Ltd.
- Kodera Herb Garden Co., Ltd.
- Rishon Biochem Co., Ltd.
- MyBioSource, Inc.
LIST OF TABLES
- TABLE 1 Global Antifreeze Protein Market, 2018 - 2021, USD Thousands
- TABLE 2 Global Antifreeze Protein Market, 2022 - 2028, USD Thousands
- TABLE 3 Global Antifreeze Protein Market by Type, 2018 - 2021, USD Thousands
- TABLE 4 Global Antifreeze Protein Market by Type, 2022 - 2028, USD Thousands
- TABLE 5 Global Type I Market by Region, 2018 - 2021, USD Thousands
- TABLE 6 Global Type I Market by Region, 2022 - 2028, USD Thousands
- TABLE 7 Global Type III Market by Region, 2018 - 2021, USD Thousands
- TABLE 8 Global Type III Market by Region, 2022 - 2028, USD Thousands
- TABLE 9 Global Antifreeze Glycoprotein Market by Region, 2018 - 2021, USD Thousands
- TABLE 10 Global Antifreeze Glycoprotein Market by Region, 2022 - 2028, USD Thousands
- TABLE 11 Global Others Market by Region, 2018 - 2021, USD Thousands
- TABLE 12 Global Others Market by Region, 2022 - 2028, USD Thousands
- TABLE 13 Global Antifreeze Protein Market by Form, 2018 - 2021, USD Thousands
- TABLE 14 Global Antifreeze Protein Market by Form, 2022 - 2028, USD Thousands
- TABLE 15 Global Solid Market by Region, 2018 - 2021, USD Thousands
- TABLE 16 Global Solid Market by Region, 2022 - 2028, USD Thousands
- TABLE 17 Global Liquid Market by Region, 2018 - 2021, USD Thousands
- TABLE 18 Global Liquid Market by Region, 2022 - 2028, USD Thousands
- TABLE 19 Global Antifreeze Protein Market by Source, 2018 - 2021, USD Thousands
- TABLE 20 Global Antifreeze Protein Market by Source, 2022 - 2028, USD Thousands
- TABLE 21 Global Fish Market by Region, 2018 - 2021, USD Thousands
- TABLE 22 Global Fish Market by Region, 2022 - 2028, USD Thousands
- TABLE 23 Global Others Market by Region, 2018 - 2021, USD Thousands
- TABLE 24 Global Others Market by Region, 2022 - 2028, USD Thousands
- TABLE 25 Global Antifreeze Protein Market by End-use, 2018 - 2021, USD Thousands
- TABLE 26 Global Antifreeze Protein Market by End-use, 2022 - 2028, USD Thousands
- TABLE 27 Global Medical Market by Region, 2018 - 2021, USD Thousands
- TABLE 28 Global Medical Market by Region, 2022 - 2028, USD Thousands
- TABLE 29 Global Food Market by Region, 2018 - 2021, USD Thousands
- TABLE 30 Global Food Market by Region, 2022 - 2028, USD Thousands
- TABLE 31 Global Cosmetics Market by Region, 2018 - 2021, USD Thousands
- TABLE 32 Global Cosmetics Market by Region, 2022 - 2028, USD Thousands
- TABLE 33 Global Others Market by Region, 2018 - 2021, USD Thousands
- TABLE 34 Global Antifreeze Protein Market by Region, 2018 - 2021, USD Thousands
- TABLE 35 Global Antifreeze Protein Market by Region, 2022 - 2028, USD Thousands
- TABLE 36 North America Antifreeze Protein Market, 2018 - 2021, USD Thousands
- TABLE 37 North America Antifreeze Protein Market, 2022 - 2028, USD Thousands
- TABLE 38 North America Antifreeze Protein Market by Type, 2018 - 2021, USD Thousands
- TABLE 39 North America Antifreeze Protein Market by Type, 2022 - 2028, USD Thousands
- TABLE 40 North America Type I Market by Country, 2018 - 2021, USD Thousands
- TABLE 41 North America Type I Market by Country, 2022 - 2028, USD Thousands
- TABLE 42 North America Type III Market by Country, 2018 - 2021, USD Thousands
- TABLE 43 North America Type III Market by Country, 2022 - 2028, USD Thousands
- TABLE 44 North America Antifreeze Glycoprotein Market by Country, 2018 - 2021, USD Thousands
- TABLE 45 North America Antifreeze Glycoprotein Market by Country, 2022 - 2028, USD Thousands
- TABLE 46 North America Others Market by Country, 2018 - 2021, USD Thousands
- TABLE 47 North America Others Market by Country, 2022 - 2028, USD Thousands
- TABLE 48 North America Antifreeze Protein Market by Form, 2018 - 2021, USD Thousands
- TABLE 49 North America Antifreeze Protein Market by Form, 2022 - 2028, USD Thousands
- TABLE 50 North America Solid Market by Country, 2018 - 2021, USD Thousands
- TABLE 51 North America Solid Market by Country, 2022 - 2028, USD Thousands
- TABLE 52 North America Liquid Market by Country, 2018 - 2021, USD Thousands
- TABLE 53 North America Liquid Market by Country, 2022 - 2028, USD Thousands
- TABLE 54 North America Antifreeze Protein Market by Source, 2018 - 2021, USD Thousands
- TABLE 55 North America Antifreeze Protein Market by Source, 2022 - 2028, USD Thousands
- TABLE 56 North America Fish Market by Country, 2018 - 2021, USD Thousands
- TABLE 57 North America Fish Market by Country, 2022 - 2028, USD Thousands
- TABLE 58 North America Others Market by Country, 2018 - 2021, USD Thousands
- TABLE 59 North America Others Market by Country, 2022 - 2028, USD Thousands
- TABLE 60 North America Antifreeze Protein Market by End-use, 2018 - 2021, USD Thousands
- TABLE 61 North America Antifreeze Protein Market by End-use, 2022 - 2028, USD Thousands
- TABLE 62 North America Medical Market by Country, 2018 - 2021, USD Thousands
- TABLE 63 North America Medical Market by Country, 2022 - 2028, USD Thousands
- TABLE 64 North America Food Market by Country, 2018 - 2021, USD Thousands
- TABLE 65 North America Food Market by Country, 2022 - 2028, USD Thousands
- TABLE 66 North America Cosmetics Market by Country, 2018 - 2021, USD Thousands
- TABLE 67 North America Cosmetics Market by Country, 2022 - 2028, USD Thousands
- TABLE 68 North America Others Market by Country, 2018 - 2021, USD Thousands
- TABLE 69 North America Others Market by Country, 2022 - 2028, USD Thousands
- TABLE 70 North America Antifreeze Protein Market by Country, 2018 - 2021, USD Thousands
- TABLE 71 North America Antifreeze Protein Market by Country, 2022 - 2028, USD Thousands
- TABLE 72 US Antifreeze Protein Market, 2018 - 2021, USD Thousands
- TABLE 73 US Antifreeze Protein Market, 2022 - 2028, USD Thousands
- TABLE 74 US Antifreeze Protein Market by Type, 2018 - 2021, USD Thousands
- TABLE 75 US Antifreeze Protein Market by Type, 2022 - 2028, USD Thousands
- TABLE 76 US Antifreeze Protein Market by Form, 2018 - 2021, USD Thousands
- TABLE 77 US Antifreeze Protein Market by Form, 2022 - 2028, USD Thousands
- TABLE 78 US Antifreeze Protein Market by Source, 2018 - 2021, USD Thousands
- TABLE 79 US Antifreeze Protein Market by Source, 2022 - 2028, USD Thousands
- TABLE 80 US Antifreeze Protein Market by End-use, 2018 - 2021, USD Thousands
- TABLE 81 US Antifreeze Protein Market by End-use, 2022 - 2028, USD Thousands
- TABLE 82 Canada Antifreeze Protein Market, 2018 - 2021, USD Thousands
- TABLE 83 Canada Antifreeze Protein Market, 2022 - 2028, USD Thousands
- TABLE 84 Canada Antifreeze Protein Market by Type, 2018 - 2021, USD Thousands
- TABLE 85 Canada Antifreeze Protein Market by Type, 2022 - 2028, USD Thousands
- TABLE 86 Canada Antifreeze Protein Market by Form, 2018 - 2021, USD Thousands
- TABLE 87 Canada Antifreeze Protein Market by Form, 2022 - 2028, USD Thousands
- TABLE 88 Canada Antifreeze Protein Market by Source, 2018 - 2021, USD Thousands
- TABLE 89 Canada Antifreeze Protein Market by Source, 2022 - 2028, USD Thousands
- TABLE 90 Canada Antifreeze Protein Market by End-use, 2018 - 2021, USD Thousands
- TABLE 91 Canada Antifreeze Protein Market by End-use, 2022 - 2028, USD Thousands
- TABLE 92 Mexico Antifreeze Protein Market, 2018 - 2021, USD Thousands
- TABLE 93 Mexico Antifreeze Protein Market, 2022 - 2028, USD Thousands
- TABLE 94 Mexico Antifreeze Protein Market by Type, 2018 - 2021, USD Thousands
- TABLE 95 Mexico Antifreeze Protein Market by Type, 2022 - 2028, USD Thousands
- TABLE 96 Mexico Antifreeze Protein Market by Form, 2018 - 2021, USD Thousands
- TABLE 97 Mexico Antifreeze Protein Market by Form, 2022 - 2028, USD Thousands
- TABLE 98 Mexico Antifreeze Protein Market by Source, 2018 - 2021, USD Thousands
- TABLE 99 Mexico Antifreeze Protein Market by Source, 2022 - 2028, USD Thousands
- TABLE 100 Mexico Antifreeze Protein Market by End-use, 2018 - 2021, USD Thousands
- TABLE 101 Mexico Antifreeze Protein Market by End-use, 2022 - 2028, USD Thousands
- TABLE 102 Rest of North America Antifreeze Protein Market, 2018 - 2021, USD Thousands
- TABLE 103 Rest of North America Antifreeze Protein Market, 2022 - 2028, USD Thousands
- TABLE 104 Rest of North America Antifreeze Protein Market by Type, 2018 - 2021, USD Thousands
- TABLE 105 Rest of North America Antifreeze Protein Market by Type, 2022 - 2028, USD Thousands
- TABLE 106 Rest of North America Antifreeze Protein Market by Form, 2018 - 2021, USD Thousands
- TABLE 107 Rest of North America Antifreeze Protein Market by Form, 2022 - 2028, USD Thousands
- TABLE 108 Rest of North America Antifreeze Protein Market by Source, 2018 - 2021, USD Thousands
- TABLE 109 Rest of North America Antifreeze Protein Market by Source, 2022 - 2028, USD Thousands
- TABLE 110 Rest of North America Antifreeze Protein Market by End-use, 2018 - 2021, USD Thousands
- TABLE 111 Rest of North America Antifreeze Protein Market by End-use, 2022 - 2028, USD Thousands
- TABLE 112 Europe Antifreeze Protein Market, 2018 - 2021, USD Thousands
- TABLE 113 Europe Antifreeze Protein Market, 2022 - 2028, USD Thousands
- TABLE 114 Europe Antifreeze Protein Market by Type, 2018 - 2021, USD Thousands
- TABLE 115 Europe Antifreeze Protein Market by Type, 2022 - 2028, USD Thousands
- TABLE 116 Europe Type I Market by Country, 2018 - 2021, USD Thousands
- TABLE 117 Europe Type I Market by Country, 2022 - 2028, USD Thousands
- TABLE 118 Europe Type III Market by Country, 2018 - 2021, USD Thousands
- TABLE 119 Europe Type III Market by Country, 2022 - 2028, USD Thousands
- TABLE 120 Europe Antifreeze Glycoprotein Market by Country, 2018 - 2021, USD Thousands
- TABLE 121 Europe Antifreeze Glycoprotein Market by Country, 2022 - 2028, USD Thousands
- TABLE 122 Europe Others Market by Country, 2018 - 2021, USD Thousands
- TABLE 123 Europe Others Market by Country, 2022 - 2028, USD Thousands
- TABLE 124 Europe Antifreeze Protein Market by Form, 2018 - 2021, USD Thousands
- TABLE 125 Europe Antifreeze Protein Market by Form, 2022 - 2028, USD Thousands
- TABLE 126 Europe Solid Market by Country, 2018 - 2021, USD Thousands
- TABLE 127 Europe Solid Market by Country, 2022 - 2028, USD Thousands
- TABLE 128 Europe Liquid Market by Country, 2018 - 2021, USD Thousands
- TABLE 129 Europe Liquid Market by Country, 2022 - 2028, USD Thousands
- TABLE 130 Europe Antifreeze Protein Market by Source, 2018 - 2021, USD Thousands
- TABLE 131 Europe Antifreeze Protein Market by Source, 2022 - 2028, USD Thousands
- TABLE 132 Europe Fish Market by Country, 2018 - 2021, USD Thousands
- TABLE 133 Europe Fish Market by Country, 2022 - 2028, USD Thousands
- TABLE 134 Europe Others Market by Country, 2018 - 2021, USD Thousands
- TABLE 135 Europe Others Market by Country, 2022 - 2028, USD Thousands
- TABLE 136 Europe Antifreeze Protein Market by End-use, 2018 - 2021, USD Thousands
- TABLE 137 Europe Antifreeze Protein Market by End-use, 2022 - 2028, USD Thousands
- TABLE 138 Europe Medical Market by Country, 2018 - 2021, USD Thousands
- TABLE 139 Europe Medical Market by Country, 2022 - 2028, USD Thousands
- TABLE 140 Europe Food Market by Country, 2018 - 2021, USD Thousands
- TABLE 141 Europe Food Market by Country, 2022 - 2028, USD Thousands
- TABLE 142 Europe Cosmetics Market by Country, 2018 - 2021, USD Thousands
- TABLE 143 Europe Cosmetics Market by Country, 2022 - 2028, USD Thousands
- TABLE 144 Europe Others Market by Country, 2018 - 2021, USD Thousands
- TABLE 145 Europe Others Market by Country, 2022 - 2028, USD Thousands
- TABLE 146 Europe Antifreeze Protein Market by Country, 2018 - 2021, USD Thousands
- TABLE 147 Europe Antifreeze Protein Market by Country, 2022 - 2028, USD Thousands
- TABLE 148 Germany Antifreeze Protein Market, 2018 - 2021, USD Thousands
- TABLE 149 Germany Antifreeze Protein Market, 2022 - 2028, USD Thousands
- TABLE 150 Germany Antifreeze Protein Market by Type, 2018 - 2021, USD Thousands
- TABLE 151 Germany Antifreeze Protein Market by Type, 2022 - 2028, USD Thousands
- TABLE 152 Germany Antifreeze Protein Market by Form, 2018 - 2021, USD Thousands
- TABLE 153 Germany Antifreeze Protein Market by Form, 2022 - 2028, USD Thousands
- TABLE 154 Germany Antifreeze Protein Market by Source, 2018 - 2021, USD Thousands
- TABLE 155 Germany Antifreeze Protein Market by Source, 2022 - 2028, USD Thousands
- TABLE 156 Germany Antifreeze Protein Market by End-use, 2018 - 2021, USD Thousands
- TABLE 157 Germany Antifreeze Protein Market by End-use, 2022 - 2028, USD Thousands
- TABLE 158 UK Antifreeze Protein Market, 2018 - 2021, USD Thousands
- TABLE 159 UK Antifreeze Protein Market, 2022 - 2028, USD Thousands
- TABLE 160 UK Antifreeze Protein Market by Type, 2018 - 2021, USD Thousands
- TABLE 161 UK Antifreeze Protein Market by Type, 2022 - 2028, USD Thousands
- TABLE 162 UK Antifreeze Protein Market by Form, 2018 - 2021, USD Thousands
- TABLE 163 UK Antifreeze Protein Market by Form, 2022 - 2028, USD Thousands
- TABLE 164 UK Antifreeze Protein Market by Source, 2018 - 2021, USD Thousands
- TABLE 165 UK Antifreeze Protein Market by Source, 2022 - 2028, USD Thousands
- TABLE 166 UK Antifreeze Protein Market by End-use, 2018 - 2021, USD Thousands
- TABLE 167 UK Antifreeze Protein Market by End-use, 2022 - 2028, USD Thousands
- TABLE 168 France Antifreeze Protein Market, 2018 - 2021, USD Thousands
- TABLE 169 France Antifreeze Protein Market, 2022 - 2028, USD Thousands
- TABLE 170 France Antifreeze Protein Market by Type, 2018 - 2021, USD Thousands
- TABLE 171 France Antifreeze Protein Market by Type, 2022 - 2028, USD Thousands
- TABLE 172 France Antifreeze Protein Market by Form, 2018 - 2021, USD Thousands
- TABLE 173 France Antifreeze Protein Market by Form, 2022 - 2028, USD Thousands
- TABLE 174 France Antifreeze Protein Market by Source, 2018 - 2021, USD Thousands
- TABLE 175 France Antifreeze Protein Market by Source, 2022 - 2028, USD Thousands
- TABLE 176 France Antifreeze Protein Market by End-use, 2018 - 2021, USD Thousands
- TABLE 177 France Antifreeze Protein Market by End-use, 2022 - 2028, USD Thousands
- TABLE 178 Russia Antifreeze Protein Market, 2018 - 2021, USD Thousands
- TABLE 179 Russia Antifreeze Protein Market, 2022 - 2028, USD Thousands
- TABLE 180 Russia Antifreeze Protein Market by Type, 2018 - 2021, USD Thousands
- TABLE 181 Russia Antifreeze Protein Market by Type, 2022 - 2028, USD Thousands
- TABLE 182 Russia Antifreeze Protein Market by Form, 2018 - 2021, USD Thousands
- TABLE 183 Russia Antifreeze Protein Market by Form, 2022 - 2028, USD Thousands
- TABLE 184 Russia Antifreeze Protein Market by Source, 2018 - 2021, USD Thousands
- TABLE 185 Russia Antifreeze Protein Market by Source, 2022 - 2028, USD Thousands
- TABLE 186 Russia Antifreeze Protein Market by End-use, 2018 - 2021, USD Thousands
- TABLE 187 Russia Antifreeze Protein Market by End-use, 2022 - 2028, USD Thousands
- TABLE 188 Spain Antifreeze Protein Market, 2018 - 2021, USD Thousands
- TABLE 189 Spain Antifreeze Protein Market, 2022 - 2028, USD Thousands
- TABLE 190 Spain Antifreeze Protein Market by Type, 2018 - 2021, USD Thousands
- TABLE 191 Spain Antifreeze Protein Market by Type, 2022 - 2028, USD Thousands
- TABLE 192 Spain Antifreeze Protein Market by Form, 2018 - 2021, USD Thousands
- TABLE 193 Spain Antifreeze Protein Market by Form, 2022 - 2028, USD Thousands
- TABLE 194 Spain Antifreeze Protein Market by Source, 2018 - 2021, USD Thousands
- TABLE 195 Spain Antifreeze Protein Market by Source, 2022 - 2028, USD Thousands
- TABLE 196 Spain Antifreeze Protein Market by End-use, 2018 - 2021, USD Thousands
- TABLE 197 Spain Antifreeze Protein Market by End-use, 2022 - 2028, USD Thousands
- TABLE 198 Italy Antifreeze Protein Market, 2018 - 2021, USD Thousands
- TABLE 199 Italy Antifreeze Protein Market, 2022 - 2028, USD Thousands
- TABLE 200 Italy Antifreeze Protein Market by Type, 2018 - 2021, USD Thousands
- TABLE 201 Italy Antifreeze Protein Market by Type, 2022 - 2028, USD Thousands
- TABLE 202 Italy Antifreeze Protein Market by Form, 2018 - 2021, USD Thousands
- TABLE 203 Italy Antifreeze Protein Market by Form, 2022 - 2028, USD Thousands
- TABLE 204 Italy Antifreeze Protein Market by Source, 2018 - 2021, USD Thousands
- TABLE 205 Italy Antifreeze Protein Market by Source, 2022 - 2028, USD Thousands
- TABLE 206 Italy Antifreeze Protein Market by End-use, 2018 - 2021, USD Thousands
- TABLE 207 Italy Antifreeze Protein Market by End-use, 2022 - 2028, USD Thousands
- TABLE 208 Rest of Europe Antifreeze Protein Market, 2018 - 2021, USD Thousands
- TABLE 209 Rest of Europe Antifreeze Protein Market, 2022 - 2028, USD Thousands
- TABLE 210 Rest of Europe Antifreeze Protein Market by Type, 2018 - 2021, USD Thousands
- TABLE 211 Rest of Europe Antifreeze Protein Market by Type, 2022 - 2028, USD Thousands
- TABLE 212 Rest of Europe Antifreeze Protein Market by Form, 2018 - 2021, USD Thousands
- TABLE 213 Rest of Europe Antifreeze Protein Market by Form, 2022 - 2028, USD Thousands
- TABLE 214 Rest of Europe Antifreeze Protein Market by Source, 2018 - 2021, USD Thousands
- TABLE 215 Rest of Europe Antifreeze Protein Market by Source, 2022 - 2028, USD Thousands
- TABLE 216 Rest of Europe Antifreeze Protein Market by End-use, 2018 - 2021, USD Thousands
- TABLE 217 Rest of Europe Antifreeze Protein Market by End-use, 2022 - 2028, USD Thousands
- TABLE 218 Asia Pacific Antifreeze Protein Market, 2018 - 2021, USD Thousands
- TABLE 219 Asia Pacific Antifreeze Protein Market, 2022 - 2028, USD Thousands
- TABLE 220 Asia Pacific Antifreeze Protein Market by Type, 2018 - 2021, USD Thousands
- TABLE 221 Asia Pacific Antifreeze Protein Market by Type, 2022 - 2028, USD Thousands
- TABLE 222 Asia Pacific Type I Market by Country, 2018 - 2021, USD Thousands
- TABLE 223 Asia Pacific Type I Market by Country, 2022 - 2028, USD Thousands
- TABLE 224 Asia Pacific Type III Market by Country, 2018 - 2021, USD Thousands
- TABLE 225 Asia Pacific Type III Market by Country, 2022 - 2028, USD Thousands
- TABLE 226 Asia Pacific Antifreeze Glycoprotein Market by Country, 2018 - 2021, USD Thousands
- TABLE 227 Asia Pacific Antifreeze Glycoprotein Market by Country, 2022 - 2028, USD Thousands
- TABLE 228 Asia Pacific Others Market by Country, 2018 - 2021, USD Thousands
- TABLE 229 Asia Pacific Others Market by Country, 2022 - 2028, USD Thousands
- TABLE 230 Asia Pacific Antifreeze Protein Market by Form, 2018 - 2021, USD Thousands
- TABLE 231 Asia Pacific Antifreeze Protein Market by Form, 2022 - 2028, USD Thousands
- TABLE 232 Asia Pacific Solid Market by Country, 2018 - 2021, USD Thousands
- TABLE 233 Asia Pacific Solid Market by Country, 2022 - 2028, USD Thousands
- TABLE 234 Asia Pacific Liquid Market by Country, 2018 - 2021, USD Thousands
- TABLE 235 Asia Pacific Liquid Market by Country, 2022 - 2028, USD Thousands
- TABLE 236 Asia Pacific Antifreeze Protein Market by Source, 2018 - 2021, USD Thousands
- TABLE 237 Asia Pacific Antifreeze Protein Market by Source, 2022 - 2028, USD Thousands
- TABLE 238 Asia Pacific Fish Market by Country, 2018 - 2021, USD Thousands
- TABLE 239 Asia Pacific Fish Market by Country, 2022 - 2028, USD Thousands
- TABLE 240 Asia Pacific Others Market by Country, 2018 - 2021, USD Thousands
- TABLE 241 Asia Pacific Others Market by Country, 2022 - 2028, USD Thousands
- TABLE 242 Asia Pacific Antifreeze Protein Market by End-use, 2018 - 2021, USD Thousands
- TABLE 243 Asia Pacific Antifreeze Protein Market by End-use, 2022 - 2028, USD Thousands
- TABLE 244 Asia Pacific Medical Market by Country, 2018 - 2021, USD Thousands
- TABLE 245 Asia Pacific Medical Market by Country, 2022 - 2028, USD Thousands
- TABLE 246 Asia Pacific Food Market by Country, 2018 - 2021, USD Thousands
- TABLE 247 Asia Pacific Food Market by Country, 2022 - 2028, USD Thousands
- TABLE 248 Asia Pacific Cosmetics Market by Country, 2018 - 2021, USD Thousands
- TABLE 249 Asia Pacific Cosmetics Market by Country, 2022 - 2028, USD Thousands
- TABLE 250 Asia Pacific Others Market by Country, 2018 - 2021, USD Thousands
- TABLE 251 Asia Pacific Others Market by Country, 2022 - 2028, USD Thousands
- TABLE 252 Asia Pacific Antifreeze Protein Market by Country, 2018 - 2021, USD Thousands
- TABLE 253 Asia Pacific Antifreeze Protein Market by Country, 2022 - 2028, USD Thousands
- TABLE 254 China Antifreeze Protein Market, 2018 - 2021, USD Thousands
- TABLE 255 China Antifreeze Protein Market, 2022 - 2028, USD Thousands
- TABLE 256 China Antifreeze Protein Market by Type, 2018 - 2021, USD Thousands
- TABLE 257 China Antifreeze Protein Market by Type, 2022 - 2028, USD Thousands
- TABLE 258 China Antifreeze Protein Market by Form, 2018 - 2021, USD Thousands
- TABLE 259 China Antifreeze Protein Market by Form, 2022 - 2028, USD Thousands
- TABLE 260 China Antifreeze Protein Market by Source, 2018 - 2021, USD Thousands
- TABLE 261 China Antifreeze Protein Market by Source, 2022 - 2028, USD Thousands
- TABLE 262 China Antifreeze Protein Market by End-use, 2018 - 2021, USD Thousands
- TABLE 263 China Antifreeze Protein Market by End-use, 2022 - 2028, USD Thousands
- TABLE 264 Japan Antifreeze Protein Market, 2018 - 2021, USD Thousands
- TABLE 265 Japan Antifreeze Protein Market, 2022 - 2028, USD Thousands
- TABLE 266 Japan Antifreeze Protein Market by Type, 2018 - 2021, USD Thousands
- TABLE 267 Japan Antifreeze Protein Market by Type, 2022 - 2028, USD Thousands
- TABLE 268 Japan Antifreeze Protein Market by Form, 2018 - 2021, USD Thousands
- TABLE 269 Japan Antifreeze Protein Market by Form, 2022 - 2028, USD Thousands
- TABLE 270 Japan Antifreeze Protein Market by Source, 2018 - 2021, USD Thousands
- TABLE 271 Japan Antifreeze Protein Market by Source, 2022 - 2028, USD Thousands
- TABLE 272 Japan Antifreeze Protein Market by End-use, 2018 - 2021, USD Thousands
- TABLE 273 Japan Antifreeze Protein Market by End-use, 2022 - 2028, USD Thousands
- TABLE 274 India Antifreeze Protein Market, 2018 - 2021, USD Thousands
- TABLE 275 India Antifreeze Protein Market, 2022 - 2028, USD Thousands
- TABLE 276 India Antifreeze Protein Market by Type, 2018 - 2021, USD Thousands
- TABLE 277 India Antifreeze Protein Market by Type, 2022 - 2028, USD Thousands
- TABLE 278 India Antifreeze Protein Market by Form, 2018 - 2021, USD Thousands
- TABLE 279 India Antifreeze Protein Market by Form, 2022 - 2028, USD Thousands
- TABLE 280 India Antifreeze Protein Market by Source, 2018 - 2021, USD Thousands
- TABLE 281 India Antifreeze Protein Market by Source, 2022 - 2028, USD Thousands
- TABLE 282 India Antifreeze Protein Market by End-use, 2018 - 2021, USD Thousands
- TABLE 283 India Antifreeze Protein Market by End-use, 2022 - 2028, USD Thousands
- TABLE 284 South Korea Antifreeze Protein Market, 2018 - 2021, USD Thousands
- TABLE 285 South Korea Antifreeze Protein Market, 2022 - 2028, USD Thousands
- TABLE 286 South Korea Antifreeze Protein Market by Type, 2018 - 2021, USD Thousands
- TABLE 287 South Korea Antifreeze Protein Market by Type, 2022 - 2028, USD Thousands
- TABLE 288 South Korea Antifreeze Protein Market by Form, 2018 - 2021, USD Thousands
- TABLE 289 South Korea Antifreeze Protein Market by Form, 2022 - 2028, USD Thousands
- TABLE 290 South Korea Antifreeze Protein Market by Source, 2018 - 2021, USD Thousands
- TABLE 291 South Korea Antifreeze Protein Market by Source, 2022 - 2028, USD Thousands
- TABLE 292 South Korea Antifreeze Protein Market by End-use, 2018 - 2021, USD Thousands
- TABLE 293 South Korea Antifreeze Protein Market by End-use, 2022 - 2028, USD Thousands
- TABLE 294 Singapore Antifreeze Protein Market, 2018 - 2021, USD Thousands
- TABLE 295 Singapore Antifreeze Protein Market, 2022 - 2028, USD Thousands
- TABLE 296 Singapore Antifreeze Protein Market by Type, 2018 - 2021, USD Thousands
- TABLE 297 Singapore Antifreeze Protein Market by Type, 2022 - 2028, USD Thousands
- TABLE 298 Singapore Antifreeze Protein Market by Form, 2018 - 2021, USD Thousands
- TABLE 299 Singapore Antifreeze Protein Market by Form, 2022 - 2028, USD Thousands
- TABLE 300 Singapore Antifreeze Protein Market by Source, 2018 - 2021, USD Thousands
- TABLE 301 Singapore Antifreeze Protein Market by Source, 2022 - 2028, USD Thousands
- TABLE 302 Singapore Antifreeze Protein Market by End-use, 2018 - 2021, USD Thousands
- TABLE 303 Singapore Antifreeze Protein Market by End-use, 2022 - 2028, USD Thousands
- TABLE 304 Malaysia Antifreeze Protein Market, 2018 - 2021, USD Thousands
- TABLE 305 Malaysia Antifreeze Protein Market, 2022 - 2028, USD Thousands
- TABLE 306 Malaysia Antifreeze Protein Market by Type, 2018 - 2021, USD Thousands
- TABLE 307 Malaysia Antifreeze Protein Market by Type, 2022 - 2028, USD Thousands
- TABLE 308 Malaysia Antifreeze Protein Market by Form, 2018 - 2021, USD Thousands
- TABLE 309 Malaysia Antifreeze Protein Market by Form, 2022 - 2028, USD Thousands
- TABLE 310 Malaysia Antifreeze Protein Market by Source, 2018 - 2021, USD Thousands
- TABLE 311 Malaysia Antifreeze Protein Market by Source, 2022 - 2028, USD Thousands
- TABLE 312 Malaysia Antifreeze Protein Market by End-use, 2018 - 2021, USD Thousands
- TABLE 313 Malaysia Antifreeze Protein Market by End-use, 2022 - 2028, USD Thousands
- TABLE 314 Rest of Asia Pacific Antifreeze Protein Market, 2018 - 2021, USD Thousands
- TABLE 315 Rest of Asia Pacific Antifreeze Protein Market, 2022 - 2028, USD Thousands
- TABLE 316 Rest of Asia Pacific Antifreeze Protein Market by Type, 2018 - 2021, USD Thousands
- TABLE 317 Rest of Asia Pacific Antifreeze Protein Market by Type, 2022 - 2028, USD Thousands
- TABLE 318 Rest of Asia Pacific Antifreeze Protein Market by Form, 2018 - 2021, USD Thousands
- TABLE 319 Rest of Asia Pacific Antifreeze Protein Market by Form, 2022 - 2028, USD Thousands
- TABLE 320 Rest of Asia Pacific Antifreeze Protein Market by Source, 2018 - 2021, USD Thousands
- TABLE 321 Rest of Asia Pacific Antifreeze Protein Market by Source, 2022 - 2028, USD Thousands
- TABLE 322 Rest of Asia Pacific Antifreeze Protein Market by End-use, 2018 - 2021, USD Thousands
- TABLE 323 Rest of Asia Pacific Antifreeze Protein Market by End-use, 2022 - 2028, USD Thousands
- TABLE 324 LAMEA Antifreeze Protein Market, 2018 - 2021, USD Thousands
- TABLE 325 LAMEA Antifreeze Protein Market, 2022 - 2028, USD Thousands
- TABLE 326 LAMEA Antifreeze Protein Market by Type, 2018 - 2021, USD Thousands
- TABLE 327 LAMEA Antifreeze Protein Market by Type, 2022 - 2028, USD Thousands
- TABLE 328 LAMEA Type I Market by Country, 2018 - 2021, USD Thousands
- TABLE 329 LAMEA Type I Market by Country, 2022 - 2028, USD Thousands
- TABLE 330 LAMEA Type III Market by Country, 2018 - 2021, USD Thousands
- TABLE 331 LAMEA Type III Market by Country, 2022 - 2028, USD Thousands
- TABLE 332 LAMEA Antifreeze Glycoprotein Market by Country, 2018 - 2021, USD Thousands
- TABLE 333 LAMEA Antifreeze Glycoprotein Market by Country, 2022 - 2028, USD Thousands
- TABLE 334 LAMEA Others Market by Country, 2018 - 2021, USD Thousands
- TABLE 335 LAMEA Others Market by Country, 2022 - 2028, USD Thousands
- TABLE 336 LAMEA Antifreeze Protein Market by Form, 2018 - 2021, USD Thousands
- TABLE 337 LAMEA Antifreeze Protein Market by Form, 2022 - 2028, USD Thousands
- TABLE 338 LAMEA Solid Market by Country, 2018 - 2021, USD Thousands
- TABLE 339 LAMEA Solid Market by Country, 2022 - 2028, USD Thousands
- TABLE 340 LAMEA Liquid Market by Country, 2018 - 2021, USD Thousands
- TABLE 341 LAMEA Liquid Market by Country, 2022 - 2028, USD Thousands
- TABLE 342 LAMEA Antifreeze Protein Market by Source, 2018 - 2021, USD Thousands
- TABLE 343 LAMEA Antifreeze Protein Market by Source, 2022 - 2028, USD Thousands
- TABLE 344 LAMEA Fish Market by Country, 2018 - 2021, USD Thousands
- TABLE 345 LAMEA Fish Market by Country, 2022 - 2028, USD Thousands
- TABLE 346 LAMEA Others Market by Country, 2018 - 2021, USD Thousands
- TABLE 347 LAMEA Others Market by Country, 2022 - 2028, USD Thousands
- TABLE 348 LAMEA Antifreeze Protein Market by End-use, 2018 - 2021, USD Thousands
- TABLE 349 LAMEA Antifreeze Protein Market by End-use, 2022 - 2028, USD Thousands
- TABLE 350 LAMEA Medical Market by Country, 2018 - 2021, USD Thousands
- TABLE 351 LAMEA Medical Market by Country, 2022 - 2028, USD Thousands
- TABLE 352 LAMEA Food Market by Country, 2018 - 2021, USD Thousands
- TABLE 353 LAMEA Food Market by Country, 2022 - 2028, USD Thousands
- TABLE 354 LAMEA Cosmetics Market by Country, 2018 - 2021, USD Thousands
- TABLE 355 LAMEA Cosmetics Market by Country, 2022 - 2028, USD Thousands
- TABLE 356 LAMEA Others Market by Country, 2018 - 2021, USD Thousands
- TABLE 357 LAMEA Others Market by Country, 2022 - 2028, USD Thousands
- TABLE 358 LAMEA Antifreeze Protein Market by Country, 2018 - 2021, USD Thousands
- TABLE 359 LAMEA Antifreeze Protein Market by Country, 2022 - 2028, USD Thousands
- TABLE 360 Brazil Antifreeze Protein Market, 2018 - 2021, USD Thousands
- TABLE 361 Brazil Antifreeze Protein Market, 2022 - 2028, USD Thousands
- TABLE 362 Brazil Antifreeze Protein Market by Type, 2018 - 2021, USD Thousands
- TABLE 363 Brazil Antifreeze Protein Market by Type, 2022 - 2028, USD Thousands
- TABLE 364 Brazil Antifreeze Protein Market by Form, 2018 - 2021, USD Thousands
- TABLE 365 Brazil Antifreeze Protein Market by Form, 2022 - 2028, USD Thousands
- TABLE 366 Brazil Antifreeze Protein Market by Source, 2018 - 2021, USD Thousands
- TABLE 367 Brazil Antifreeze Protein Market by Source, 2022 - 2028, USD Thousands
- TABLE 368 Brazil Antifreeze Protein Market by End-use, 2018 - 2021, USD Thousands
- TABLE 369 Brazil Antifreeze Protein Market by End-use, 2022 - 2028, USD Thousands
- TABLE 370 Argentina Antifreeze Protein Market, 2018 - 2021, USD Thousands
- TABLE 371 Argentina Antifreeze Protein Market, 2022 - 2028, USD Thousands
- TABLE 372 Argentina Antifreeze Protein Market by Type, 2018 - 2021, USD Thousands
- TABLE 373 Argentina Antifreeze Protein Market by Type, 2022 - 2028, USD Thousands
- TABLE 374 Argentina Antifreeze Protein Market by Form, 2018 - 2021, USD Thousands
- TABLE 375 Argentina Antifreeze Protein Market by Form, 2022 - 2028, USD Thousands
- TABLE 376 Argentina Antifreeze Protein Market by Source, 2018 - 2021, USD Thousands
- TABLE 377 Argentina Antifreeze Protein Market by Source, 2022 - 2028, USD Thousands
- TABLE 378 Argentina Antifreeze Protein Market by End-use, 2018 - 2021, USD Thousands
- TABLE 379 Argentina Antifreeze Protein Market by End-use, 2022 - 2028, USD Thousands
- TABLE 380 UAE Antifreeze Protein Market, 2018 - 2021, USD Thousands
- TABLE 381 UAE Antifreeze Protein Market, 2022 - 2028, USD Thousands
- TABLE 382 UAE Antifreeze Protein Market by Type, 2018 - 2021, USD Thousands
- TABLE 383 UAE Antifreeze Protein Market by Type, 2022 - 2028, USD Thousands
- TABLE 384 UAE Antifreeze Protein Market by Form, 2018 - 2021, USD Thousands
- TABLE 385 UAE Antifreeze Protein Market by Form, 2022 - 2028, USD Thousands
- TABLE 386 UAE Antifreeze Protein Market by Source, 2018 - 2021, USD Thousands
- TABLE 387 UAE Antifreeze Protein Market by Source, 2022 - 2028, USD Thousands
- TABLE 388 UAE Antifreeze Protein Market by End-use, 2018 - 2021, USD Thousands
- TABLE 389 UAE Antifreeze Protein Market by End-use, 2022 - 2028, USD Thousands
- TABLE 390 Saudi Arabia Antifreeze Protein Market, 2018 - 2021, USD Thousands
- TABLE 391 Saudi Arabia Antifreeze Protein Market, 2022 - 2028, USD Thousands
- TABLE 392 Saudi Arabia Antifreeze Protein Market by Type, 2018 - 2021, USD Thousands
- TABLE 393 Saudi Arabia Antifreeze Protein Market by Type, 2022 - 2028, USD Thousands
- TABLE 394 Saudi Arabia Antifreeze Protein Market by Form, 2018 - 2021, USD Thousands
- TABLE 395 Saudi Arabia Antifreeze Protein Market by Form, 2022 - 2028, USD Thousands
- TABLE 396 Saudi Arabia Antifreeze Protein Market by Source, 2018 - 2021, USD ThousandS
- TABLE 397 Saudi Arabia Antifreeze Protein Market by Source, 2022 - 2028, USD Thousands
- TABLE 398 Saudi Arabia Antifreeze Protein Market by End-use, 2018 - 2021, USD Thousands
- TABLE 399 Saudi Arabia Antifreeze Protein Market by End-use, 2022 - 2028, USD Thousands
- TABLE 400 South Africa Antifreeze Protein Market, 2018 - 2021, USD Thousands
- TABLE 401 South Africa Antifreeze Protein Market, 2022 - 2028, USD Thousands
- TABLE 402 South Africa Antifreeze Protein Market by Type, 2018 - 2021, USD Thousands
- TABLE 403 South Africa Antifreeze Protein Market by Type, 2022 - 2028, USD Thousands
- TABLE 404 South Africa Antifreeze Protein Market by Form, 2018 - 2021, USD Thousands
- TABLE 405 South Africa Antifreeze Protein Market by Form, 2022 - 2028, USD Thousands
- TABLE 406 South Africa Antifreeze Protein Market by Source, 2018 - 2021, USD Thousands
- TABLE 407 South Africa Antifreeze Protein Market by Source, 2022 - 2028, USD Thousands
- TABLE 408 South Africa Antifreeze Protein Market by End-use, 2018 - 2021, USD Thousands
- TABLE 409 South Africa Antifreeze Protein Market by End-use, 2022 - 2028, USD Thousands
- TABLE 410 Nigeria Antifreeze Protein Market, 2018 - 2021, USD Thousands
- TABLE 411 Nigeria Antifreeze Protein Market, 2022 - 2028, USD Thousands
- TABLE 412 Nigeria Antifreeze Protein Market by Type, 2018 - 2021, USD Thousands
- TABLE 413 Nigeria Antifreeze Protein Market by Type, 2022 - 2028, USD Thousands
- TABLE 414 Nigeria Antifreeze Protein Market by Form, 2018 - 2021, USD Thousands
- TABLE 415 Nigeria Antifreeze Protein Market by Form, 2022 - 2028, USD Thousands
- TABLE 416 Nigeria Antifreeze Protein Market by Source, 2018 - 2021, USD Thousands
- TABLE 417 Nigeria Antifreeze Protein Market by Source, 2022 - 2028, USD Thousands
- TABLE 418 Nigeria Antifreeze Protein Market by End-use, 2018 - 2021, USD Thousands
- TABLE 419 Nigeria Antifreeze Protein Market by End-use, 2022 - 2028, USD Thousands
- TABLE 420 Rest of LAMEA Antifreeze Protein Market, 2018 - 2021, USD Thousands
- TABLE 421 Rest of LAMEA Antifreeze Protein Market, 2022 - 2028, USD Thousands
- TABLE 422 Rest of LAMEA Antifreeze Protein Market by Type, 2018 - 2021, USD Thousands
- TABLE 423 Rest of LAMEA Antifreeze Protein Market by Type, 2022 - 2028, USD Thousands
- TABLE 424 Rest of LAMEA Antifreeze Protein Market by Form, 2018 - 2021, USD Thousands
- TABLE 425 Rest of LAMEA Antifreeze Protein Market by Form, 2022 - 2028, USD Thousands
- TABLE 426 Rest of LAMEA Antifreeze Protein Market by Source, 2018 - 2021, USD Thousands
- TABLE 427 Rest of LAMEA Antifreeze Protein Market by Source, 2022 - 2028, USD Thousands
- TABLE 428 Rest of LAMEA Antifreeze Protein Market by End-use, 2018 - 2021, USD Thousands
- TABLE 429 Rest of LAMEA Antifreeze Protein Market by End-use, 2022 - 2028, USD Thousands
- TABLE 430 Key Information - Kaneka Corporation
- TABLE 431 Key Information - Unilever PLC
- TABLE 432 Key Information - Nichirei Corporation
- TABLE 433 Key Information - A/F Protein Canada, Inc.
- TABLE 434 Key Information - Sirona Biochem Corporation
- TABLE 435 Key Information - Protokinetix, Inc.
- TABLE 436 Key Information - Shanghai Yu Tao Industrial Co., Ltd.
- TABLE 437 Key Information - Kodera Herb Garden Co., Ltd.
- TABLE 438 Key Information - Rishon Biochem Co., Ltd.
- TABLE 439 Key Information - MyBioSource, Inc.
List of Figures
- FIG 1 Methodology for the research
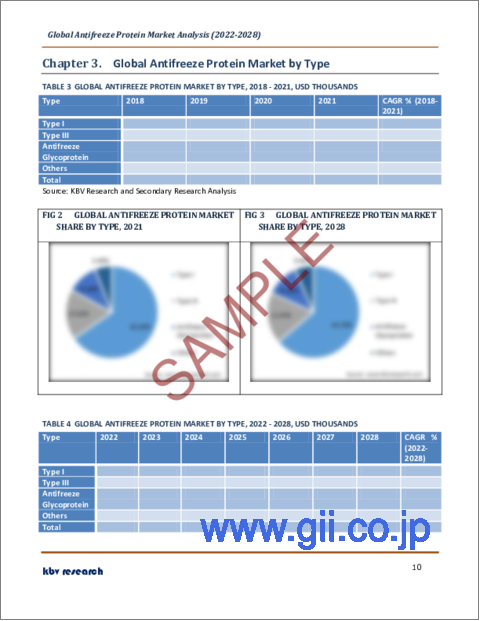
- FIG 2 Global Antifreeze Protein Market share by Type, 2021
- FIG 3 Global Antifreeze Protein Market share by Type, 2028
- FIG 4 Global Antifreeze Protein Market by Type, 2018 - 2028, USD Thousands
- FIG 5 Global Antifreeze Protein Market share by Form, 2021
- FIG 6 Global Antifreeze Protein Market share by Form, 2028
- FIG 7 Global Antifreeze Protein Market by Form, 2018 - 2028, USD Thousands
- FIG 8 Global Antifreeze Protein Market share by Source, 2021
- FIG 9 Global Antifreeze Protein Market share by Source, 2028
- FIG 10 Global Antifreeze Protein Market by Source, 2018 - 2028, USD Thousands
- FIG 11 Global Antifreeze Protein Market share by End-use, 2021
- FIG 12 Global Antifreeze Protein Market share by End-use, 2028
- FIG 13 Global Antifreeze Protein Market by End-use, 2018 - 2028, USD Thousands
- FIG 14 Global Antifreeze Protein Market share by Region, 2021
- FIG 15 Global Antifreeze Protein Market share by Region, 2028
- FIG 16 Global Antifreeze Protein Market by Region, 2018 - 2028, USD Thousands
The Global Antifreeze Protein Market size is expected to reach $29 million by 2028, rising at a market growth of 25.7% CAGR during the forecast period.
Antifreeze proteins (AFPs) are biological antifreezes with distinct characteristics such as thermal hysteresis (TH), ice re-crystallization inhibition (IRI), and contact with membranes and/or membrane proteins. These characteristics have been used to keep biological samples safe at low temperatures.
The market is being augmented by increased investments from some aquaculture firms in order to buy frozen products. The firms are concentrating on the premium taste of smoked fish combined with the ideal texture. Consumer demand for aurora salmon in many regions is rapidly increasing, moving the business forward. In addition, important firms are concentrating on launching low-cost organic salmon food products. As a result, the market is predicted to increase significantly over the forecast period.
Improved aquaculture practices in cold regions, refined freeze tolerance growth of plants, extended harvest season in cold climates, and improved cryosurgery procedures will all boost industry sales. In addition, the increasing use of antifreeze proteins in yogurts and ice creams is expected to boost the need for antifreeze protein. High investments by key firms in the food industry to develop new frozen goods are likely to enhance industry sales even more. The antifreeze protein market would benefit from the rising applications of antifreeze proteins in the pharmaceutical industry, as well as increased R&D efforts. Antifreeze protein is used to increase the bio-availability of medications due to different bio-active effects such as antibacterial action and physiological benefits that can underpin overall human health, in addition to dietary uses.
Moreover, Antifreeze proteins (AFPs) or ice structuring proteins (ISPs) are polypeptides that enable plants, animals, fungi, and bacteria to live in temperatures below freezing. AFPs bind to little ice crystals, preventing them from growing and recrystallizing, which would be devastating otherwise. AFPs may potentially interact with mammalian cell membranes to protect them from cold damage. This is revealed that AFPs are involved in cold acclimation.
COVID-19 Impact
The COVID-19 pandemic's expansion has far-reaching consequences for the fruit and vegetable industry. There were attempts made to ensure supply consistency and continuity at points of sale; nonetheless, new costs and hurdles had to be overcome. These new costs were incurred as a result of variables such as social distancing measures causing inefficiencies in the orchard and pack house operations, increased logistical costs owing to trucks returning empty to their bases, and additional safety procedures and delays. Market pressures and product losses were also factors. As a result, there is a growing demand for effective storage methods at key trade ports and markets to protect the safety of fruits and vegetables while also ensuring a steady supply to retail markets.
Market Growth Factors
Increased awareness of the advantages of antifreeze proteins
Antifreeze proteins prevent ice crystal development caused by freezing, which decreases texture quality significantly. These antifreeze proteins can be added to fish, yeast, vegetables, and fruits using trans-genesis procedures and protocols to offer these organisms new useful qualities. Along with that, the applications offer certified advantages that result in high-quality food production and distribution. As a response, the market demand is growing. One of the main advantages of antifreeze proteins is that it keeps the biological samples safe from any risk of pilferage.
Growing markets in developing regions
In emerging countries, rising living standards and changing lifestyles contribute to increased demand for ready meals, cosmetics, and immunizations, all of which have an indirect impact on the market. Emerging markets are likely to provide considerable market growth potential for the key market players. AFPs work by lowering the freezing point of water and preventing the formation of ice crystals in the frozen state. The medical associations of various developing regions are investing a tremendous amount of money into creating and implementing innovations like antifreeze proteins.
Market Restraining Factors
Food applications are limited
Antifreeze proteins have a restricted number of commercial applications in the food business, which limits the antifreeze proteins market's potential. Cosmetics, healthcare, and frozen foods industries, on the other hand, use them. The majority of companies are still in the research and development phase when it comes to finding new uses for antifreeze proteins in the food industry. With the limited application of antifreeze proteins in the food business, the market is having limited prospects to grow. Even though, the research and development team is working on finding new applications to grow the market.
Type Outlook
Based on Type, the market is segmented into Type I, Type III, Antifreeze Glycoprotein, and Others. The Type III segment garnered a significant revenue share in the antifreeze protein market in 2021. This is because of its increasing use in the pharmaceutical industry. Type III antifreeze proteins have superior cryo-preservation than any other antifreeze protein. Various medical firms and hospital units are seeking for proper type III outlook.
Form Outlook
Based on Form, the market is segmented into Solid and Liquid. The solid segment witnessed the maximum revenue share in the antifreeze protein market in 2021. This is due to the convenience of availability in solid form from the source of origin. Frozen foods, ice cream goods, frozen seafood, and meats are all examples of where they're used. In addition, the solid form has a longer shelf life than the liquid version, making it more suitable for usage in frozen foods.
Source Outlook
Based on Source, the market is segmented into Fish and Others. The other segment procured a substantial revenue share in the antifreeze protein market in 2021. Fungi, bacteria, plants, and insects are all included in this category. This is because of the extreme earthly winter temperatures, the insect source has more effective proteins than the fish source. As a result, the others segment is likely to increase significantly.
End-use Outlook
Based on End-use, the market is segmented into Medical, Food, Cosmetics, and Others. The medical segment acquired the highest revenue share in the antifreeze protein market in 2021. This is due to increased research and development from biotechnology and pharmaceutical businesses, as well as ongoing research on COVID-19 vaccines. The healthcare units are showing enhanced interest in the inclusion of antifreeze protein elements.
Regional Outlook
Based on Regions, the market is segmented into North America, Europe, Asia Pacific, and Latin America, Middle East & Africa. Asia Pacific emerged as the leading region in the antifreeze protein market with the largest revenue share in 2021. This can be attributed to the fact that the majority of marine capture and aquaculture production occurs in the region. Antifreeze proteins are in high demand in the pharmaceutical and cosmetics industries. This is because antifreeze proteins are widely used in vaccine manufacturing, and the existence of world-leading vaccine makers in this region is boosting the market growth.
The market research report covers the analysis of key stake holders of the market. Key companies profiled in the report include Kaneka Corporation, Unilever PLC, Nichirei Corporation, A/F Protein Canada Inc., Sirona Biochem, Protokinetix, Inc., Shanghai Yu Tao Industrial Co., Ltd., Kodera herb garden co., ltd., Rishon Biochem Co., Ltd., and Mybiosource, Inc.
Scope of the Study
Market Segments covered in the Report:
By Type
- Type I
- Type III
- Antifreeze Glycoprotein
- Others
By Form
- Solid
- Liquid
By Source
- Fish
- Others
By End Use
- Medical
- Food
- Cosmetics
- Others
By Geography
- North America
- US
- Canada
- Mexico
- Rest of North America
- Europe
- Germany
- UK
- France
- Russia
- Spain
- Italy
- Rest of Europe
- Asia Pacific
- China
- Japan
- India
- South Korea
- Singapore
- Malaysia
- Rest of Asia Pacific
- LAMEA
- Brazil
- Argentina
- UAE
- Saudi Arabia
- South Africa
- Nigeria
- Rest of LAMEA
Companies Profiled
- Kaneka Corporation
- Unilever PLC
- Nichirei Corporation
- A/F Protein Canada Inc.
- Sirona Biochem
- Protokinetix, Inc.
- Shanghai Yu Tao Industrial Co., Ltd.
- Kodera herb garden co., ltd.
- Rishon biochem co., ltd
- Mybiosource, Inc.
Unique Offerings from KBV Research
- Exhaustive coverage
- Highest number of market tables and figures
- Subscription based model available
- Guaranteed best price
- Assured post sales research support with 10% customization free
Table of Contents
Chapter 1. Market Scope & Methodology
- 1.1 Market Definition
- 1.2 Objectives
- 1.3 Market Scope
- 1.4 Segmentation
- 1.4.1 Global Antifreeze Protein Market, by Type
- 1.4.2 Global Antifreeze Protein Market, by Form
- 1.4.3 Global Antifreeze Protein Market, by Source
- 1.4.4 Global Antifreeze Protein Market, by End Use
- 1.4.5 Global Antifreeze Protein Market, by Geography
- 1.5 Methodology for the research
Chapter 2. Market Overview
- 2.1 Introduction
- 2.1.1 Overview
- 2.1.1.1 Market Composition and Scenario
- 2.1.1 Overview
- 2.2 Key Factors Impacting the Market
- 2.2.1 Market Drivers
- 2.2.2 Market Restraints
Chapter 3. Global Antifreeze Protein Market by Type
- 3.1 Global Type I Market by Region
- 3.2 Global Type III Market by Region
- 3.3 Global Antifreeze Glycoprotein Market by Region
- 3.4 Global Others Market by Region
Chapter 4. Global Antifreeze Protein Market by Form
- 4.1 Global Solid Market by Region
- 4.2 Global Liquid Market by Region
Chapter 5. Global Antifreeze Protein Market by Source
- 5.1 Global Fish Market by Region
- 5.2 Global Others Market by Region
Chapter 6. Global Antifreeze Protein Market by End-use
- 6.1 Global Medical Market by Region
- 6.2 Global Food Market by Region
- 6.3 Global Cosmetics Market by Region
- 6.4 Global Others Market by Region
Chapter 7. Global Antifreeze Protein Market by Region
- 7.1 North America Antifreeze Protein Market
- 7.1.1 North America Antifreeze Protein Market by Type
- 7.1.1.1 North America Type I Market by Country
- 7.1.1.2 North America Type III Market by Country
- 7.1.1.3 North America Antifreeze Glycoprotein Market by Country
- 7.1.1.4 North America Others Market by Country
- 7.1.2 North America Antifreeze Protein Market by Form
- 7.1.2.1 North America Solid Market by Country
- 7.1.2.2 North America Liquid Market by Country
- 7.1.3 North America Antifreeze Protein Market by Source
- 7.1.3.1 North America Fish Market by Country
- 7.1.3.2 North America Others Market by Country
- 7.1.4 North America Antifreeze Protein Market by End-use
- 7.1.4.1 North America Medical Market by Country
- 7.1.4.2 North America Food Market by Country
- 7.1.4.3 North America Cosmetics Market by Country
- 7.1.4.4 North America Others Market by Country
- 7.1.5 North America Antifreeze Protein Market by Country
- 7.1.5.1 US Antifreeze Protein Market
- 7.1.5.1.1 US Antifreeze Protein Market by Type
- 7.1.5.1.2 US Antifreeze Protein Market by Form
- 7.1.5.1.3 US Antifreeze Protein Market by Source
- 7.1.5.1.4 US Antifreeze Protein Market by End-use
- 7.1.5.2 Canada Antifreeze Protein Market
- 7.1.5.2.1 Canada Antifreeze Protein Market by Type
- 7.1.5.2.2 Canada Antifreeze Protein Market by Form
- 7.1.5.2.3 Canada Antifreeze Protein Market by Source
- 7.1.5.2.4 Canada Antifreeze Protein Market by End-use
- 7.1.5.3 Mexico Antifreeze Protein Market
- 7.1.5.3.1 Mexico Antifreeze Protein Market by Type
- 7.1.5.3.2 Mexico Antifreeze Protein Market by Form
- 7.1.5.3.3 Mexico Antifreeze Protein Market by Source
- 7.1.5.3.4 Mexico Antifreeze Protein Market by End-use
- 7.1.5.4 Rest of North America Antifreeze Protein Market
- 7.1.5.4.1 Rest of North America Antifreeze Protein Market by Type
- 7.1.5.4.2 Rest of North America Antifreeze Protein Market by Form
- 7.1.5.4.3 Rest of North America Antifreeze Protein Market by Source
- 7.1.5.4.4 Rest of North America Antifreeze Protein Market by End-use
- 7.1.5.1 US Antifreeze Protein Market
- 7.1.1 North America Antifreeze Protein Market by Type
- 7.2 Europe Antifreeze Protein Market
- 7.2.1 Europe Antifreeze Protein Market by Type
- 7.2.1.1 Europe Type I Market by Country
- 7.2.1.2 Europe Type III Market by Country
- 7.2.1.3 Europe Antifreeze Glycoprotein Market by Country
- 7.2.1.4 Europe Others Market by Country
- 7.2.2 Europe Antifreeze Protein Market by Form
- 7.2.2.1 Europe Solid Market by Country
- 7.2.2.2 Europe Liquid Market by Country
- 7.2.3 Europe Antifreeze Protein Market by Source
- 7.2.3.1 Europe Fish Market by Country
- 7.2.3.2 Europe Others Market by Country
- 7.2.4 Europe Antifreeze Protein Market by End-use
- 7.2.4.1 Europe Medical Market by Country
- 7.2.4.2 Europe Food Market by Country
- 7.2.4.3 Europe Cosmetics Market by Country
- 7.2.4.4 Europe Others Market by Country
- 7.2.5 Europe Antifreeze Protein Market by Country
- 7.2.5.1 Germany Antifreeze Protein Market
- 7.2.5.1.1 Germany Antifreeze Protein Market by Type
- 7.2.5.1.2 Germany Antifreeze Protein Market by Form
- 7.2.5.1.3 Germany Antifreeze Protein Market by Source
- 7.2.5.1.4 Germany Antifreeze Protein Market by End-use
- 7.2.5.2 UK Antifreeze Protein Market
- 7.2.5.2.1 UK Antifreeze Protein Market by Type
- 7.2.5.2.2 UK Antifreeze Protein Market by Form
- 7.2.5.2.3 UK Antifreeze Protein Market by Source
- 7.2.5.2.4 UK Antifreeze Protein Market by End-use
- 7.2.5.3 France Antifreeze Protein Market
- 7.2.5.3.1 France Antifreeze Protein Market by Type
- 7.2.5.3.2 France Antifreeze Protein Market by Form
- 7.2.5.3.3 France Antifreeze Protein Market by Source
- 7.2.5.3.4 France Antifreeze Protein Market by End-use
- 7.2.5.4 Russia Antifreeze Protein Market
- 7.2.5.4.1 Russia Antifreeze Protein Market by Type
- 7.2.5.4.2 Russia Antifreeze Protein Market by Form
- 7.2.5.4.3 Russia Antifreeze Protein Market by Source
- 7.2.5.4.4 Russia Antifreeze Protein Market by End-use
- 7.2.5.5 Spain Antifreeze Protein Market
- 7.2.5.5.1 Spain Antifreeze Protein Market by Type
- 7.2.5.5.2 Spain Antifreeze Protein Market by Form
- 7.2.5.5.3 Spain Antifreeze Protein Market by Source
- 7.2.5.5.4 Spain Antifreeze Protein Market by End-use
- 7.2.5.6 Italy Antifreeze Protein Market
- 7.2.5.6.1 Italy Antifreeze Protein Market by Type
- 7.2.5.6.2 Italy Antifreeze Protein Market by Form
- 7.2.5.6.3 Italy Antifreeze Protein Market by Source
- 7.2.5.6.4 Italy Antifreeze Protein Market by End-use
- 7.2.5.7 Rest of Europe Antifreeze Protein Market
- 7.2.5.7.1 Rest of Europe Antifreeze Protein Market by Type
- 7.2.5.7.2 Rest of Europe Antifreeze Protein Market by Form
- 7.2.5.7.3 Rest of Europe Antifreeze Protein Market by Source
- 7.2.5.7.4 Rest of Europe Antifreeze Protein Market by End-use
- 7.2.5.1 Germany Antifreeze Protein Market
- 7.2.1 Europe Antifreeze Protein Market by Type
- 7.3 Asia Pacific Antifreeze Protein Market
- 7.3.1 Asia Pacific Antifreeze Protein Market by Type
- 7.3.1.1 Asia Pacific Type I Market by Country
- 7.3.1.2 Asia Pacific Type III Market by Country
- 7.3.1.3 Asia Pacific Antifreeze Glycoprotein Market by Country
- 7.3.1.4 Asia Pacific Others Market by Country
- 7.3.2 Asia Pacific Antifreeze Protein Market by Form
- 7.3.2.1 Asia Pacific Solid Market by Country
- 7.3.2.2 Asia Pacific Liquid Market by Country
- 7.3.3 Asia Pacific Antifreeze Protein Market by Source
- 7.3.3.1 Asia Pacific Fish Market by Country
- 7.3.3.2 Asia Pacific Others Market by Country
- 7.3.4 Asia Pacific Antifreeze Protein Market by End-use
- 7.3.4.1 Asia Pacific Medical Market by Country
- 7.3.4.2 Asia Pacific Food Market by Country
- 7.3.4.3 Asia Pacific Cosmetics Market by Country
- 7.3.4.4 Asia Pacific Others Market by Country
- 7.3.5 Asia Pacific Antifreeze Protein Market by Country
- 7.3.5.1 China Antifreeze Protein Market
- 7.3.5.1.1 China Antifreeze Protein Market by Type
- 7.3.5.1.2 China Antifreeze Protein Market by Form
- 7.3.5.1.3 China Antifreeze Protein Market by Source
- 7.3.5.1.4 China Antifreeze Protein Market by End-use
- 7.3.5.2 Japan Antifreeze Protein Market
- 7.3.5.2.1 Japan Antifreeze Protein Market by Type
- 7.3.5.2.2 Japan Antifreeze Protein Market by Form
- 7.3.5.2.3 Japan Antifreeze Protein Market by Source
- 7.3.5.2.4 Japan Antifreeze Protein Market by End-use
- 7.3.5.3 India Antifreeze Protein Market
- 7.3.5.3.1 India Antifreeze Protein Market by Type
- 7.3.5.3.2 India Antifreeze Protein Market by Form
- 7.3.5.3.3 India Antifreeze Protein Market by Source
- 7.3.5.3.4 India Antifreeze Protein Market by End-use
- 7.3.5.4 South Korea Antifreeze Protein Market
- 7.3.5.4.1 South Korea Antifreeze Protein Market by Type
- 7.3.5.4.2 South Korea Antifreeze Protein Market by Form
- 7.3.5.4.3 South Korea Antifreeze Protein Market by Source
- 7.3.5.4.4 South Korea Antifreeze Protein Market by End-use
- 7.3.5.5 Singapore Antifreeze Protein Market
- 7.3.5.5.1 Singapore Antifreeze Protein Market by Type
- 7.3.5.5.2 Singapore Antifreeze Protein Market by Form
- 7.3.5.5.3 Singapore Antifreeze Protein Market by Source
- 7.3.5.5.4 Singapore Antifreeze Protein Market by End-use
- 7.3.5.6 Malaysia Antifreeze Protein Market
- 7.3.5.6.1 Malaysia Antifreeze Protein Market by Type
- 7.3.5.6.2 Malaysia Antifreeze Protein Market by Form
- 7.3.5.6.3 Malaysia Antifreeze Protein Market by Source
- 7.3.5.6.4 Malaysia Antifreeze Protein Market by End-use
- 7.3.5.7 Rest of Asia Pacific Antifreeze Protein Market
- 7.3.5.7.1 Rest of Asia Pacific Antifreeze Protein Market by Type
- 7.3.5.7.2 Rest of Asia Pacific Antifreeze Protein Market by Form
- 7.3.5.7.3 Rest of Asia Pacific Antifreeze Protein Market by Source
- 7.3.5.7.4 Rest of Asia Pacific Antifreeze Protein Market by End-use
- 7.3.5.1 China Antifreeze Protein Market
- 7.3.1 Asia Pacific Antifreeze Protein Market by Type
- 7.4 LAMEA Antifreeze Protein Market
- 7.4.1 LAMEA Antifreeze Protein Market by Type
- 7.4.1.1 LAMEA Type I Market by Country
- 7.4.1.2 LAMEA Type III Market by Country
- 7.4.1.3 LAMEA Antifreeze Glycoprotein Market by Country
- 7.4.1.4 LAMEA Others Market by Country
- 7.4.2 LAMEA Antifreeze Protein Market by Form
- 7.4.2.1 LAMEA Solid Market by Country
- 7.4.2.2 LAMEA Liquid Market by Country
- 7.4.3 LAMEA Antifreeze Protein Market by Source
- 7.4.3.1 LAMEA Fish Market by Country
- 7.4.3.2 LAMEA Others Market by Country
- 7.4.4 LAMEA Antifreeze Protein Market by End-use
- 7.4.4.1 LAMEA Medical Market by Country
- 7.4.4.2 LAMEA Food Market by Country
- 7.4.4.3 LAMEA Cosmetics Market by Country
- 7.4.4.4 LAMEA Others Market by Country
- 7.4.5 LAMEA Antifreeze Protein Market by Country
- 7.4.5.1 Brazil Antifreeze Protein Market
- 7.4.5.1.1 Brazil Antifreeze Protein Market by Type
- 7.4.5.1.2 Brazil Antifreeze Protein Market by Form
- 7.4.5.1.3 Brazil Antifreeze Protein Market by Source
- 7.4.5.1.4 Brazil Antifreeze Protein Market by End-use
- 7.4.5.2 Argentina Antifreeze Protein Market
- 7.4.5.2.1 Argentina Antifreeze Protein Market by Type
- 7.4.5.2.2 Argentina Antifreeze Protein Market by Form
- 7.4.5.2.3 Argentina Antifreeze Protein Market by Source
- 7.4.5.2.4 Argentina Antifreeze Protein Market by End-use
- 7.4.5.3 UAE Antifreeze Protein Market
- 7.4.5.3.1 UAE Antifreeze Protein Market by Type
- 7.4.5.3.2 UAE Antifreeze Protein Market by Form
- 7.4.5.3.3 UAE Antifreeze Protein Market by Source
- 7.4.5.3.4 UAE Antifreeze Protein Market by End-use
- 7.4.5.4 Saudi Arabia Antifreeze Protein Market
- 7.4.5.4.1 Saudi Arabia Antifreeze Protein Market by Type
- 7.4.5.4.2 Saudi Arabia Antifreeze Protein Market by Form
- 7.4.5.4.3 Saudi Arabia Antifreeze Protein Market by Source
- 7.4.5.4.4 Saudi Arabia Antifreeze Protein Market by End-use
- 7.4.5.5 South Africa Antifreeze Protein Market
- 7.4.5.5.1 South Africa Antifreeze Protein Market by Type
- 7.4.5.5.2 South Africa Antifreeze Protein Market by Form
- 7.4.5.5.3 South Africa Antifreeze Protein Market by Source
- 7.4.5.5.4 South Africa Antifreeze Protein Market by End-use
- 7.4.5.6 Nigeria Antifreeze Protein Market
- 7.4.5.6.1 Nigeria Antifreeze Protein Market by Type
- 7.4.5.6.2 Nigeria Antifreeze Protein Market by Form
- 7.4.5.6.3 Nigeria Antifreeze Protein Market by Source
- 7.4.5.6.4 Nigeria Antifreeze Protein Market by End-use
- 7.4.5.7 Rest of LAMEA Antifreeze Protein Market
- 7.4.5.7.1 Rest of LAMEA Antifreeze Protein Market by Type
- 7.4.5.7.2 Rest of LAMEA Antifreeze Protein Market by Form
- 7.4.5.7.3 Rest of LAMEA Antifreeze Protein Market by Source
- 7.4.5.7.4 Rest of LAMEA Antifreeze Protein Market by End-use
- 7.4.5.1 Brazil Antifreeze Protein Market
- 7.4.1 LAMEA Antifreeze Protein Market by Type
Chapter 8. Company Profiles
- 8.1 Kaneka Corporation
- 8.1.1 Company Overview
- 8.1.2 Financial Analysis
- 8.1.3 Segmental and Regional Analysis
- 8.2 Unilever PLC
- 8.2.1 Company Overview
- 8.2.2 Financial Analysis
- 8.2.3 Segmental and Regional Analysis
- 8.2.4 Research & Development Expense
- 8.3 Nichirei Corporation
- 8.3.1 Company Overview
- 8.3.2 Financial Analysis
- 8.3.3 Segmental and Regional Analysis
- 8.3.4 Research & Development Expenses
- 8.4 A/F Protein Canada, Inc.
- 8.4.1 Company Overview
- 8.5 Sirona Biochem Corporation
- 8.5.1 Company Overview
- 8.5.2 Financial Analysis
- 8.5.3 Regional Analysis
- 8.5.4 Research & Development Expenses
- 8.6 Protokinetix, Inc.
- 8.6.1 Company Overview
- 8.7 Shanghai Yu Tao Industrial Co., Ltd.
- 8.7.1 Company Overview
- 8.8 Kodera Herb Garden Co., Ltd.
- 8.8.1 Company Overview
- 8.9 Rishon Biochem Co., Ltd.
- 8.9.1 Company Overview
- 8.10. MyBioSource, Inc.
- 8.10.1 Company Overview