|
|
市場調査レポート
商品コード
1093110
世界のSOC as a Serviceの市場規模、シェア、産業動向分析:タイプ別、業界別、コンポーネント別、提供形態別、組織規模別、用途別、地域別の展望と予測(2022年~2028年)Global SOC as a Service Market Size, Share & Industry Trends Analysis Report By Type, By Vertical, By Component, By Offering Type, By Organization Size, By Application, By Regional Outlook and Forecast, 2022 - 2028 |
||||||
|
|
|||||||


| 世界のSOC as a Serviceの市場規模、シェア、産業動向分析:タイプ別、業界別、コンポーネント別、提供形態別、組織規模別、用途別、地域別の展望と予測(2022年~2028年) |
|
出版日: 2022年05月31日
発行: KBV Research
ページ情報: 英文 354 Pages
納期: 即納可能
|
- 全表示
- 概要
- 図表
- 目次
世界のSOC as a Serviceの市場規模は、2028年までに109億米ドルに達し、予測期間中にCAGR10.2%で成長すると予測されています。
当レポートでは、世界のSOC as a Service市場について調査し、市場概要、競合分析、セグメント・地域別の市場分析、主要企業のプロファイルなどの情報を提供しています。
目次
第1章 市場の範囲と調査手法
第2章 市場概要
- イントロダクション
- 市場に影響を与える主な要因
第3章 世界の競合分析
- KBVカーディナルマトリックス
- 最近の業界全体の戦略的開発
- 市場シェア分析(2021年)
- 主な成功戦略
第4章 世界のSOC as a Service市場:タイプ別
- 脆弱性評価・脅威検出
- インシデント対応
第5章 世界のSOC as a Service市場:業界別
- BFSI
- IT・ITeS
- 製造
- 電気通信
- 政府・公共部門
- ヘルスケア・ライフサイエンス
- 輸送・物流
- エネルギー・公益事業
- その他
第6章 世界のSOC as a Service市場:コンポーネント別
- プロフェッショナルサービス
- ソリューション
第7章 世界のSOC as a Service市場:提供形態別
- 共同管理
- 完全管理
第8章 世界のSOC as a Service市場:組織規模別
- 大企業
- 中小企業
第9章 世界のSOC as a Service市場:用途別
- エンドポイントセキュリティ
- ネットワークセキュリティ
- クラウドセキュリティ
- その他
第10章 世界のSOC as a Service市場:地域別
- 北米
- 欧州
- アジア太平洋
- ラテンアメリカ・中東・アフリカ
第11章 企業プロファイル
- AT&T, Inc.
- IBM Corporation
- NTT Data Corporation
- Verizon Communications, Inc.
- Cloudflare, Inc.
- Fortinet, Inc.
- Check Point Software Technologies Ltd.
- Atos Group
- Tata Consultancy Services Ltd.
- Profico
LIST OF TABLES
- TABLE 1 Global SOC as a Service Market, 2018 - 2021, USD Million
- TABLE 2 Global SOC as a Service Market, 2022 - 2028, USD Million
- TABLE 3 Partnerships, Collaborations and Agreements - SOC as a Service Market
- TABLE 4 Product Launches And Product Expansions - SOC as a Service Market
- TABLE 5 Acquisition and Mergers - SOC as a Service Market
- TABLE 6 Geographical Expansions - SOC as a Service Market
- TABLE 7 Global SOC as a Service Market by Type, 2018 - 2021, USD Million
- TABLE 8 Global SOC as a Service Market by Type, 2022 - 2028, USD Million
- TABLE 9 Global Vulnerability Assessment & Threat Detection Market by Region, 2018 - 2021, USD Million
- TABLE 10 Global Vulnerability Assessment & Threat Detection Market by Region, 2022 - 2028, USD Million
- TABLE 11 Global Incident Response Market by Region, 2018 - 2021, USD Million
- TABLE 12 Global Incident Response Market by Region, 2022 - 2028, USD Million
- TABLE 13 Global SOC as a Service Market by Vertical, 2018 - 2021, USD Million
- TABLE 14 Global SOC as a Service Market by Vertical, 2022 - 2028, USD Million
- TABLE 15 Global BFSI Market by Region, 2018 - 2021, USD Million
- TABLE 16 Global BFSI Market by Region, 2022 - 2028, USD Million
- TABLE 17 Global IT & ITeS Market by Region, 2018 - 2021, USD Million
- TABLE 18 Global IT & ITeS Market by Region, 2022 - 2028, USD Million
- TABLE 19 Global Manufacturing Market by Region, 2018 - 2021, USD Million
- TABLE 20 Global Manufacturing Market by Region, 2022 - 2028, USD Million
- TABLE 21 Global Telecommunications Market by Region, 2018 - 2021, USD Million
- TABLE 22 Global Telecommunications Market by Region, 2022 - 2028, USD Million
- TABLE 23 Global Government & Public Sector Market by Region, 2018 - 2021, USD Million
- TABLE 24 Global Government & Public Sector Market by Region, 2022 - 2028, USD Million
- TABLE 25 Global Healthcare & Life Sciences Market by Region, 2018 - 2021, USD Million
- TABLE 26 Global Healthcare & Life Sciences Market by Region, 2022 - 2028, USD Million
- TABLE 27 Global Transportation & Logistics Market by Region, 2018 - 2021, USD Million
- TABLE 28 Global Transportation & Logistics Market by Region, 2022 - 2028, USD Million
- TABLE 29 Global Energy & Utilities Market by Region, 2018 - 2021, USD Million
- TABLE 30 Global Energy & Utilities Market by Region, 2022 - 2028, USD Million
- TABLE 31 Global Other Vertical Market by Region, 2018 - 2021, USD Million
- TABLE 32 Global Other Vertical Market by Region, 2022 - 2028, USD Million
- TABLE 33 Global SOC as a Service Market by Component, 2018 - 2021, USD Million
- TABLE 34 Global SOC as a Service Market by Component, 2022 - 2028, USD Million
- TABLE 35 Global Professional Services Market by Region, 2018 - 2021, USD Million
- TABLE 36 Global Professional Services Market by Region, 2022 - 2028, USD Million
- TABLE 37 Global Solution Market by Region, 2018 - 2021, USD Million
- TABLE 38 Global Solution Market by Region, 2022 - 2028, USD Million
- TABLE 39 Global SOC as a Service Market by Offering Type, 2018 - 2021, USD Million
- TABLE 40 Global SOC as a Service Market by Offering Type, 2022 - 2028, USD Million
- TABLE 41 Global Co-managed Market by Region, 2018 - 2021, USD Million
- TABLE 42 Global Co-managed Market by Region, 2022 - 2028, USD Million
- TABLE 43 Global Fully Managed Market by Region, 2018 - 2021, USD Million
- TABLE 44 Global Fully Managed Market by Region, 2022 - 2028, USD Million
- TABLE 45 Global SOC as a Service Market by Organization Size, 2018 - 2021, USD Million
- TABLE 46 Global SOC as a Service Market by Organization Size, 2022 - 2028, USD Million
- TABLE 47 Global Large Enterprises Market by Region, 2018 - 2021, USD Million
- TABLE 48 Global Large Enterprises Market by Region, 2022 - 2028, USD Million
- TABLE 49 Global Small & Medium Enterprises Market by Region, 2018 - 2021, USD Million
- TABLE 50 Global Small & Medium Enterprises Market by Region, 2022 - 2028, USD Million
- TABLE 51 Global SOC as a Service Market by Application, 2018 - 2021, USD Million
- TABLE 52 Global SOC as a Service Market by Application, 2022 - 2028, USD Million
- TABLE 53 Global Endpoint Security Market by Region, 2018 - 2021, USD Million
- TABLE 54 Global Endpoint Security Market by Region, 2022 - 2028, USD Million
- TABLE 55 Global Network Security Market by Region, 2018 - 2021, USD Million
- TABLE 56 Global Network Security Market by Region, 2022 - 2028, USD Million
- TABLE 57 Global Cloud Security Market by Region, 2018 - 2021, USD Million
- TABLE 58 Global Cloud Security Market by Region, 2022 - 2028, USD Million
- TABLE 59 Global Others Market by Region, 2018 - 2021, USD Million
- TABLE 60 Global Others Market by Region, 2022 - 2028, USD Million
- TABLE 61 Global SOC as a Service Market by Region, 2018 - 2021, USD Million
- TABLE 62 Global SOC as a Service Market by Region, 2022 - 2028, USD Million
- TABLE 63 North America SOC as a Service Market, 2018 - 2021, USD Million
- TABLE 64 North America SOC as a Service Market, 2022 - 2028, USD Million
- TABLE 65 North America SOC as a Service Market by Type, 2018 - 2021, USD Million
- TABLE 66 North America SOC as a Service Market by Type, 2022 - 2028, USD Million
- TABLE 67 North America Vulnerability Assessment & Threat Detection Market by Country, 2018 - 2021, USD Million
- TABLE 68 North America Vulnerability Assessment & Threat Detection Market by Country, 2022 - 2028, USD Million
- TABLE 69 North America Incident Response Market by Country, 2018 - 2021, USD Million
- TABLE 70 North America Incident Response Market by Country, 2022 - 2028, USD Million
- TABLE 71 North America SOC as a Service Market by Vertical, 2018 - 2021, USD Million
- TABLE 72 North America SOC as a Service Market by Vertical, 2022 - 2028, USD Million
- TABLE 73 North America BFSI Market by Country, 2018 - 2021, USD Million
- TABLE 74 North America BFSI Market by Country, 2022 - 2028, USD Million
- TABLE 75 North America IT & ITeS Market by Country, 2018 - 2021, USD Million
- TABLE 76 North America IT & ITeS Market by Country, 2022 - 2028, USD Million
- TABLE 77 North America Manufacturing Market by Country, 2018 - 2021, USD Million
- TABLE 78 North America Manufacturing Market by Country, 2022 - 2028, USD Million
- TABLE 79 North America Telecommunications Market by Country, 2018 - 2021, USD Million
- TABLE 80 North America Telecommunications Market by Country, 2022 - 2028, USD Million
- TABLE 81 North America Government & Public Sector Market by Country, 2018 - 2021, USD Million
- TABLE 82 North America Government & Public Sector Market by Country, 2022 - 2028, USD Million
- TABLE 83 North America Healthcare & Life Sciences Market by Country, 2018 - 2021, USD Million
- TABLE 84 North America Healthcare & Life Sciences Market by Country, 2022 - 2028, USD Million
- TABLE 85 North America Transportation & Logistics Market by Country, 2018 - 2021, USD Million
- TABLE 86 North America Transportation & Logistics Market by Country, 2022 - 2028, USD Million
- TABLE 87 North America Energy & Utilities Market by Country, 2018 - 2021, USD Million
- TABLE 88 North America Energy & Utilities Market by Country, 2022 - 2028, USD Million
- TABLE 89 North America Other Vertical Market by Country, 2018 - 2021, USD Million
- TABLE 90 North America Other Vertical Market by Country, 2022 - 2028, USD Million
- TABLE 91 North America SOC as a Service Market by Component, 2018 - 2021, USD Million
- TABLE 92 North America SOC as a Service Market by Component, 2022 - 2028, USD Million
- TABLE 93 North America Professional Services Market by Country, 2018 - 2021, USD Million
- TABLE 94 North America Professional Services Market by Country, 2022 - 2028, USD Million
- TABLE 95 North America Solution Market by Country, 2018 - 2021, USD Million
- TABLE 96 North America Solution Market by Country, 2022 - 2028, USD Million
- TABLE 97 North America SOC as a Service Market by Offering Type, 2018 - 2021, USD Million
- TABLE 98 North America SOC as a Service Market by Offering Type, 2022 - 2028, USD Million
- TABLE 99 North America Co-managed Market by Country, 2018 - 2021, USD Million
- TABLE 100 North America Co-managed Market by Country, 2022 - 2028, USD Million
- TABLE 101 North America Fully Managed Market by Country, 2018 - 2021, USD Million
- TABLE 102 North America Fully Managed Market by Country, 2022 - 2028, USD Million
- TABLE 103 North America SOC as a Service Market by Organization Size, 2018 - 2021, USD Million
- TABLE 104 North America SOC as a Service Market by Organization Size, 2022 - 2028, USD Million
- TABLE 105 North America Large Enterprises Market by Country, 2018 - 2021, USD Million
- TABLE 106 North America Large Enterprises Market by Country, 2022 - 2028, USD Million
- TABLE 107 North America Small & Medium Enterprises Market by Country, 2018 - 2021, USD Million
- TABLE 108 North America Small & Medium Enterprises Market by Country, 2022 - 2028, USD Million
- TABLE 109 North America SOC as a Service Market by Application, 2018 - 2021, USD Million
- TABLE 110 North America SOC as a Service Market by Application, 2022 - 2028, USD Million
- TABLE 111 North America Endpoint Security Market by Country, 2018 - 2021, USD Million
- TABLE 112 North America Endpoint Security Market by Country, 2022 - 2028, USD Million
- TABLE 113 North America Network Security Market by Country, 2018 - 2021, USD Million
- TABLE 114 North America Network Security Market by Country, 2022 - 2028, USD Million
- TABLE 115 North America Cloud Security Market by Country, 2018 - 2021, USD Million
- TABLE 116 North America Cloud Security Market by Country, 2022 - 2028, USD Million
- TABLE 117 North America Others Market by Country, 2018 - 2021, USD Million
- TABLE 118 North America Others Market by Country, 2022 - 2028, USD Million
- TABLE 119 North America SOC as a Service Market by Country, 2018 - 2021, USD Million
- TABLE 120 North America SOC as a Service Market by Country, 2022 - 2028, USD Million
- TABLE 121 US SOC as a Service Market, 2018 - 2021, USD Million
- TABLE 122 US SOC as a Service Market, 2022 - 2028, USD Million
- TABLE 123 US SOC as a Service Market by Type, 2018 - 2021, USD Million
- TABLE 124 US SOC as a Service Market by Type, 2022 - 2028, USD Million
- TABLE 125 US SOC as a Service Market by Vertical, 2018 - 2021, USD Million
- TABLE 126 US SOC as a Service Market by Vertical, 2022 - 2028, USD Million
- TABLE 127 US SOC as a Service Market by Component, 2018 - 2021, USD Million
- TABLE 128 US SOC as a Service Market by Component, 2022 - 2028, USD Million
- TABLE 129 US SOC as a Service Market by Offering Type, 2018 - 2021, USD Million
- TABLE 130 US SOC as a Service Market by Offering Type, 2022 - 2028, USD Million
- TABLE 131 US SOC as a Service Market by Organization Size, 2018 - 2021, USD Million
- TABLE 132 US SOC as a Service Market by Organization Size, 2022 - 2028, USD Million
- TABLE 133 US SOC as a Service Market by Application, 2018 - 2021, USD Million
- TABLE 134 US SOC as a Service Market by Application, 2022 - 2028, USD Million
- TABLE 135 Canada SOC as a Service Market, 2018 - 2021, USD Million
- TABLE 136 Canada SOC as a Service Market, 2022 - 2028, USD Million
- TABLE 137 Canada SOC as a Service Market by Type, 2018 - 2021, USD Million
- TABLE 138 Canada SOC as a Service Market by Type, 2022 - 2028, USD Million
- TABLE 139 Canada SOC as a Service Market by Vertical, 2018 - 2021, USD Million
- TABLE 140 Canada SOC as a Service Market by Vertical, 2022 - 2028, USD Million
- TABLE 141 Canada SOC as a Service Market by Component, 2018 - 2021, USD Million
- TABLE 142 Canada SOC as a Service Market by Component, 2022 - 2028, USD Million
- TABLE 143 Canada SOC as a Service Market by Offering Type, 2018 - 2021, USD Million
- TABLE 144 Canada SOC as a Service Market by Offering Type, 2022 - 2028, USD Million
- TABLE 145 Canada SOC as a Service Market by Organization Size, 2018 - 2021, USD Million
- TABLE 146 Canada SOC as a Service Market by Organization Size, 2022 - 2028, USD Million
- TABLE 147 Canada SOC as a Service Market by Application, 2018 - 2021, USD Million
- TABLE 148 Canada SOC as a Service Market by Application, 2022 - 2028, USD Million
- TABLE 149 Mexico SOC as a Service Market, 2018 - 2021, USD Million
- TABLE 150 Mexico SOC as a Service Market, 2022 - 2028, USD Million
- TABLE 151 Mexico SOC as a Service Market by Type, 2018 - 2021, USD Million
- TABLE 152 Mexico SOC as a Service Market by Type, 2022 - 2028, USD Million
- TABLE 153 Mexico SOC as a Service Market by Vertical, 2018 - 2021, USD Million
- TABLE 154 Mexico SOC as a Service Market by Vertical, 2022 - 2028, USD Million
- TABLE 155 Mexico SOC as a Service Market by Component, 2018 - 2021, USD Million
- TABLE 156 Mexico SOC as a Service Market by Component, 2022 - 2028, USD Million
- TABLE 157 Mexico SOC as a Service Market by Offering Type, 2018 - 2021, USD Million
- TABLE 158 Mexico SOC as a Service Market by Offering Type, 2022 - 2028, USD Million
- TABLE 159 Mexico SOC as a Service Market by Organization Size, 2018 - 2021, USD Million
- TABLE 160 Mexico SOC as a Service Market by Organization Size, 2022 - 2028, USD Million
- TABLE 161 Mexico SOC as a Service Market by Application, 2018 - 2021, USD Million
- TABLE 162 Mexico SOC as a Service Market by Application, 2022 - 2028, USD Million
- TABLE 163 Rest of North America SOC as a Service Market, 2018 - 2021, USD Million
- TABLE 164 Rest of North America SOC as a Service Market, 2022 - 2028, USD Million
- TABLE 165 Rest of North America SOC as a Service Market by Type, 2018 - 2021, USD Million
- TABLE 166 Rest of North America SOC as a Service Market by Type, 2022 - 2028, USD Million
- TABLE 167 Rest of North America SOC as a Service Market by Vertical, 2018 - 2021, USD Million
- TABLE 168 Rest of North America SOC as a Service Market by Vertical, 2022 - 2028, USD Million
- TABLE 169 Rest of North America SOC as a Service Market by Component, 2018 - 2021, USD Million
- TABLE 170 Rest of North America SOC as a Service Market by Component, 2022 - 2028, USD Million
- TABLE 171 Rest of North America SOC as a Service Market by Offering Type, 2018 - 2021, USD Million
- TABLE 172 Rest of North America SOC as a Service Market by Offering Type, 2022 - 2028, USD Million
- TABLE 173 Rest of North America SOC as a Service Market by Organization Size, 2018 - 2021, USD Million
- TABLE 174 Rest of North America SOC as a Service Market by Organization Size, 2022 - 2028, USD Million
- TABLE 175 Rest of North America SOC as a Service Market by Application, 2018 - 2021, USD Million
- TABLE 176 Rest of North America SOC as a Service Market by Application, 2022 - 2028, USD Million
- TABLE 177 Europe SOC as a Service Market, 2018 - 2021, USD Million
- TABLE 178 Europe SOC as a Service Market, 2022 - 2028, USD Million
- TABLE 179 Europe SOC as a Service Market by Type, 2018 - 2021, USD Million
- TABLE 180 Europe SOC as a Service Market by Type, 2022 - 2028, USD Million
- TABLE 181 Europe Vulnerability Assessment & Threat Detection Market by Country, 2018 - 2021, USD Million
- TABLE 182 Europe Vulnerability Assessment & Threat Detection Market by Country, 2022 - 2028, USD Million
- TABLE 183 Europe Incident Response Market by Country, 2018 - 2021, USD Million
- TABLE 184 Europe Incident Response Market by Country, 2022 - 2028, USD Million
- TABLE 185 Europe SOC as a Service Market by Vertical, 2018 - 2021, USD Million
- TABLE 186 Europe SOC as a Service Market by Vertical, 2022 - 2028, USD Million
- TABLE 187 Europe BFSI Market by Country, 2018 - 2021, USD Million
- TABLE 188 Europe BFSI Market by Country, 2022 - 2028, USD Million
- TABLE 189 Europe IT & ITeS Market by Country, 2018 - 2021, USD Million
- TABLE 190 Europe IT & ITeS Market by Country, 2022 - 2028, USD Million
- TABLE 191 Europe Manufacturing Market by Country, 2018 - 2021, USD Million
- TABLE 192 Europe Manufacturing Market by Country, 2022 - 2028, USD Million
- TABLE 193 Europe Telecommunications Market by Country, 2018 - 2021, USD Million
- TABLE 194 Europe Telecommunications Market by Country, 2022 - 2028, USD Million
- TABLE 195 Europe Government & Public Sector Market by Country, 2018 - 2021, USD Million
- TABLE 196 Europe Government & Public Sector Market by Country, 2022 - 2028, USD Million
- TABLE 197 Europe Healthcare & Life Sciences Market by Country, 2018 - 2021, USD Million
- TABLE 198 Europe Healthcare & Life Sciences Market by Country, 2022 - 2028, USD Million
- TABLE 199 Europe Transportation & Logistics Market by Country, 2018 - 2021, USD Million
- TABLE 200 Europe Transportation & Logistics Market by Country, 2022 - 2028, USD Million
- TABLE 201 Europe Energy & Utilities Market by Country, 2018 - 2021, USD Million
- TABLE 202 Europe Energy & Utilities Market by Country, 2022 - 2028, USD Million
- TABLE 203 Europe Other Vertical Market by Country, 2018 - 2021, USD Million
- TABLE 204 Europe Other Vertical Market by Country, 2022 - 2028, USD Million
- TABLE 205 Europe SOC as a Service Market by Component, 2018 - 2021, USD Million
- TABLE 206 Europe SOC as a Service Market by Component, 2022 - 2028, USD Million
- TABLE 207 Europe Professional Services Market by Country, 2018 - 2021, USD Million
- TABLE 208 Europe Professional Services Market by Country, 2022 - 2028, USD Million
- TABLE 209 Europe Solution Market by Country, 2018 - 2021, USD Million
- TABLE 210 Europe Solution Market by Country, 2022 - 2028, USD Million
- TABLE 211 Europe SOC as a Service Market by Offering Type, 2018 - 2021, USD Million
- TABLE 212 Europe SOC as a Service Market by Offering Type, 2022 - 2028, USD Million
- TABLE 213 Europe Co-managed Market by Country, 2018 - 2021, USD Million
- TABLE 214 Europe Co-managed Market by Country, 2022 - 2028, USD Million
- TABLE 215 Europe Fully Managed Market by Country, 2018 - 2021, USD Million
- TABLE 216 Europe Fully Managed Market by Country, 2022 - 2028, USD Million
- TABLE 217 Europe SOC as a Service Market by Organization Size, 2018 - 2021, USD Million
- TABLE 218 Europe SOC as a Service Market by Organization Size, 2022 - 2028, USD Million
- TABLE 219 Europe Large Enterprises Market by Country, 2018 - 2021, USD Million
- TABLE 220 Europe Large Enterprises Market by Country, 2022 - 2028, USD Million
- TABLE 221 Europe Small & Medium Enterprises Market by Country, 2018 - 2021, USD Million
- TABLE 222 Europe Small & Medium Enterprises Market by Country, 2022 - 2028, USD Million
- TABLE 223 Europe SOC as a Service Market by Application, 2018 - 2021, USD Million
- TABLE 224 Europe SOC as a Service Market by Application, 2022 - 2028, USD Million
- TABLE 225 Europe Endpoint Security Market by Country, 2018 - 2021, USD Million
- TABLE 226 Europe Endpoint Security Market by Country, 2022 - 2028, USD Million
- TABLE 227 Europe Network Security Market by Country, 2018 - 2021, USD Million
- TABLE 228 Europe Network Security Market by Country, 2022 - 2028, USD Million
- TABLE 229 Europe Cloud Security Market by Country, 2018 - 2021, USD Million
- TABLE 230 Europe Cloud Security Market by Country, 2022 - 2028, USD Million
- TABLE 231 Europe Others Market by Country, 2018 - 2021, USD Million
- TABLE 232 Europe Others Market by Country, 2022 - 2028, USD Million
- TABLE 233 Europe SOC as a Service Market by Country, 2018 - 2021, USD Million
- TABLE 234 Europe SOC as a Service Market by Country, 2022 - 2028, USD Million
- TABLE 235 Germany SOC as a Service Market, 2018 - 2021, USD Million
- TABLE 236 Germany SOC as a Service Market, 2022 - 2028, USD Million
- TABLE 237 Germany SOC as a Service Market by Type, 2018 - 2021, USD Million
- TABLE 238 Germany SOC as a Service Market by Type, 2022 - 2028, USD Million
- TABLE 239 Germany SOC as a Service Market by Vertical, 2018 - 2021, USD Million
- TABLE 240 Germany SOC as a Service Market by Vertical, 2022 - 2028, USD Million
- TABLE 241 Germany SOC as a Service Market by Component, 2018 - 2021, USD Million
- TABLE 242 Germany SOC as a Service Market by Component, 2022 - 2028, USD Million
- TABLE 243 Germany SOC as a Service Market by Offering Type, 2018 - 2021, USD Million
- TABLE 244 Germany SOC as a Service Market by Offering Type, 2022 - 2028, USD Million
- TABLE 245 Germany SOC as a Service Market by Organization Size, 2018 - 2021, USD Million
- TABLE 246 Germany SOC as a Service Market by Organization Size, 2022 - 2028, USD Million
- TABLE 247 Germany SOC as a Service Market by Application, 2018 - 2021, USD Million
- TABLE 248 Germany SOC as a Service Market by Application, 2022 - 2028, USD Million
- TABLE 249 UK SOC as a Service Market, 2018 - 2021, USD Million
- TABLE 250 UK SOC as a Service Market, 2022 - 2028, USD Million
- TABLE 251 UK SOC as a Service Market by Type, 2018 - 2021, USD Million
- TABLE 252 UK SOC as a Service Market by Type, 2022 - 2028, USD Million
- TABLE 253 UK SOC as a Service Market by Vertical, 2018 - 2021, USD Million
- TABLE 254 UK SOC as a Service Market by Vertical, 2022 - 2028, USD Million
- TABLE 255 UK SOC as a Service Market by Component, 2018 - 2021, USD Million
- TABLE 256 UK SOC as a Service Market by Component, 2022 - 2028, USD Million
- TABLE 257 UK SOC as a Service Market by Offering Type, 2018 - 2021, USD Million
- TABLE 258 UK SOC as a Service Market by Offering Type, 2022 - 2028, USD Million
- TABLE 259 UK SOC as a Service Market by Organization Size, 2018 - 2021, USD Million
- TABLE 260 UK SOC as a Service Market by Organization Size, 2022 - 2028, USD Million
- TABLE 261 UK SOC as a Service Market by Application, 2018 - 2021, USD Million
- TABLE 262 UK SOC as a Service Market by Application, 2022 - 2028, USD Million
- TABLE 263 France SOC as a Service Market, 2018 - 2021, USD Million
- TABLE 264 France SOC as a Service Market, 2022 - 2028, USD Million
- TABLE 265 France SOC as a Service Market by Type, 2018 - 2021, USD Million
- TABLE 266 France SOC as a Service Market by Type, 2022 - 2028, USD Million
- TABLE 267 France SOC as a Service Market by Vertical, 2018 - 2021, USD Million
- TABLE 268 France SOC as a Service Market by Vertical, 2022 - 2028, USD Million
- TABLE 269 France SOC as a Service Market by Component, 2018 - 2021, USD Million
- TABLE 270 France SOC as a Service Market by Component, 2022 - 2028, USD Million
- TABLE 271 France SOC as a Service Market by Offering Type, 2018 - 2021, USD Million
- TABLE 272 France SOC as a Service Market by Offering Type, 2022 - 2028, USD Million
- TABLE 273 France SOC as a Service Market by Organization Size, 2018 - 2021, USD Million
- TABLE 274 France SOC as a Service Market by Organization Size, 2022 - 2028, USD Million
- TABLE 275 France SOC as a Service Market by Application, 2018 - 2021, USD Million
- TABLE 276 France SOC as a Service Market by Application, 2022 - 2028, USD Million
- TABLE 277 Russia SOC as a Service Market, 2018 - 2021, USD Million
- TABLE 278 Russia SOC as a Service Market, 2022 - 2028, USD Million
- TABLE 279 Russia SOC as a Service Market by Type, 2018 - 2021, USD Million
- TABLE 280 Russia SOC as a Service Market by Type, 2022 - 2028, USD Million
- TABLE 281 Russia SOC as a Service Market by Vertical, 2018 - 2021, USD Million
- TABLE 282 Russia SOC as a Service Market by Vertical, 2022 - 2028, USD Million
- TABLE 283 Russia SOC as a Service Market by Component, 2018 - 2021, USD Million
- TABLE 284 Russia SOC as a Service Market by Component, 2022 - 2028, USD Million
- TABLE 285 Russia SOC as a Service Market by Offering Type, 2018 - 2021, USD Million
- TABLE 286 Russia SOC as a Service Market by Offering Type, 2022 - 2028, USD Million
- TABLE 287 Russia SOC as a Service Market by Organization Size, 2018 - 2021, USD Million
- TABLE 288 Russia SOC as a Service Market by Organization Size, 2022 - 2028, USD Million
- TABLE 289 Russia SOC as a Service Market by Application, 2018 - 2021, USD Million
- TABLE 290 Russia SOC as a Service Market by Application, 2022 - 2028, USD Million
- TABLE 291 Spain SOC as a Service Market, 2018 - 2021, USD Million
- TABLE 292 Spain SOC as a Service Market, 2022 - 2028, USD Million
- TABLE 293 Spain SOC as a Service Market by Type, 2018 - 2021, USD Million
- TABLE 294 Spain SOC as a Service Market by Type, 2022 - 2028, USD Million
- TABLE 295 Spain SOC as a Service Market by Vertical, 2018 - 2021, USD Million
- TABLE 296 Spain SOC as a Service Market by Vertical, 2022 - 2028, USD Million
- TABLE 297 Spain SOC as a Service Market by Component, 2018 - 2021, USD Million
- TABLE 298 Spain SOC as a Service Market by Component, 2022 - 2028, USD Million
- TABLE 299 Spain SOC as a Service Market by Offering Type, 2018 - 2021, USD Million
- TABLE 300 Spain SOC as a Service Market by Offering Type, 2022 - 2028, USD Million
- TABLE 301 Spain SOC as a Service Market by Organization Size, 2018 - 2021, USD Million
- TABLE 302 Spain SOC as a Service Market by Organization Size, 2022 - 2028, USD Million
- TABLE 303 Spain SOC as a Service Market by Application, 2018 - 2021, USD Million
- TABLE 304 Spain SOC as a Service Market by Application, 2022 - 2028, USD Million
- TABLE 305 Italy SOC as a Service Market, 2018 - 2021, USD Million
- TABLE 306 Italy SOC as a Service Market, 2022 - 2028, USD Million
- TABLE 307 Italy SOC as a Service Market by Type, 2018 - 2021, USD Million
- TABLE 308 Italy SOC as a Service Market by Type, 2022 - 2028, USD Million
- TABLE 309 Italy SOC as a Service Market by Vertical, 2018 - 2021, USD Million
- TABLE 310 Italy SOC as a Service Market by Vertical, 2022 - 2028, USD Million
- TABLE 311 Italy SOC as a Service Market by Component, 2018 - 2021, USD Million
- TABLE 312 Italy SOC as a Service Market by Component, 2022 - 2028, USD Million
- TABLE 313 Italy SOC as a Service Market by Offering Type, 2018 - 2021, USD Million
- TABLE 314 Italy SOC as a Service Market by Offering Type, 2022 - 2028, USD Million
- TABLE 315 Italy SOC as a Service Market by Organization Size, 2018 - 2021, USD Million
- TABLE 316 Italy SOC as a Service Market by Organization Size, 2022 - 2028, USD Million
- TABLE 317 Italy SOC as a Service Market by Application, 2018 - 2021, USD Million
- TABLE 318 Italy SOC as a Service Market by Application, 2022 - 2028, USD Million
- TABLE 319 Rest of Europe SOC as a Service Market, 2018 - 2021, USD Million
- TABLE 320 Rest of Europe SOC as a Service Market, 2022 - 2028, USD Million
- TABLE 321 Rest of Europe SOC as a Service Market by Type, 2018 - 2021, USD Million
- TABLE 322 Rest of Europe SOC as a Service Market by Type, 2022 - 2028, USD Million
- TABLE 323 Rest of Europe SOC as a Service Market by Vertical, 2018 - 2021, USD Million
- TABLE 324 Rest of Europe SOC as a Service Market by Vertical, 2022 - 2028, USD Million
- TABLE 325 Rest of Europe SOC as a Service Market by Component, 2018 - 2021, USD Million
- TABLE 326 Rest of Europe SOC as a Service Market by Component, 2022 - 2028, USD Million
- TABLE 327 Rest of Europe SOC as a Service Market by Offering Type, 2018 - 2021, USD Million
- TABLE 328 Rest of Europe SOC as a Service Market by Offering Type, 2022 - 2028, USD Million
- TABLE 329 Rest of Europe SOC as a Service Market by Organization Size, 2018 - 2021, USD Million
- TABLE 330 Rest of Europe SOC as a Service Market by Organization Size, 2022 - 2028, USD Million
- TABLE 331 Rest of Europe SOC as a Service Market by Application, 2018 - 2021, USD Million
- TABLE 332 Rest of Europe SOC as a Service Market by Application, 2022 - 2028, USD Million
- TABLE 333 Asia Pacific SOC as a Service Market, 2018 - 2021, USD Million
- TABLE 334 Asia Pacific SOC as a Service Market, 2022 - 2028, USD Million
- TABLE 335 Asia Pacific SOC as a Service Market by Type, 2018 - 2021, USD Million
- TABLE 336 Asia Pacific SOC as a Service Market by Type, 2022 - 2028, USD Million
- TABLE 337 Asia Pacific Vulnerability Assessment & Threat Detection Market by Country, 2018 - 2021, USD Million
- TABLE 338 Asia Pacific Vulnerability Assessment & Threat Detection Market by Country, 2022 - 2028, USD Million
- TABLE 339 Asia Pacific Incident Response Market by Country, 2018 - 2021, USD Million
- TABLE 340 Asia Pacific Incident Response Market by Country, 2022 - 2028, USD Million
- TABLE 341 Asia Pacific SOC as a Service Market by Vertical, 2018 - 2021, USD Million
- TABLE 342 Asia Pacific SOC as a Service Market by Vertical, 2022 - 2028, USD Million
- TABLE 343 Asia Pacific BFSI Market by Country, 2018 - 2021, USD Million
- TABLE 344 Asia Pacific BFSI Market by Country, 2022 - 2028, USD Million
- TABLE 345 Asia Pacific IT & ITeS Market by Country, 2018 - 2021, USD Million
- TABLE 346 Asia Pacific IT & ITeS Market by Country, 2022 - 2028, USD Million
- TABLE 347 Asia Pacific Manufacturing Market by Country, 2018 - 2021, USD Million
- TABLE 348 Asia Pacific Manufacturing Market by Country, 2022 - 2028, USD Million
- TABLE 349 Asia Pacific Telecommunications Market by Country, 2018 - 2021, USD Million
- TABLE 350 Asia Pacific Telecommunications Market by Country, 2022 - 2028, USD Million
- TABLE 351 Asia Pacific Government & Public Sector Market by Country, 2018 - 2021, USD Million
- TABLE 352 Asia Pacific Government & Public Sector Market by Country, 2022 - 2028, USD Million
- TABLE 353 Asia Pacific Healthcare & Life Sciences Market by Country, 2018 - 2021, USD Million
- TABLE 354 Asia Pacific Healthcare & Life Sciences Market by Country, 2022 - 2028, USD Million
- TABLE 355 Asia Pacific Transportation & Logistics Market by Country, 2018 - 2021, USD Million
- TABLE 356 Asia Pacific Transportation & Logistics Market by Country, 2022 - 2028, USD Million
- TABLE 357 Asia Pacific Energy & Utilities Market by Country, 2018 - 2021, USD Million
- TABLE 358 Asia Pacific Energy & Utilities Market by Country, 2022 - 2028, USD Million
- TABLE 359 Asia Pacific Other Vertical Market by Country, 2018 - 2021, USD Million
- TABLE 360 Asia Pacific Other Vertical Market by Country, 2022 - 2028, USD Million
- TABLE 361 Asia Pacific SOC as a Service Market by Component, 2018 - 2021, USD Million
- TABLE 362 Asia Pacific SOC as a Service Market by Component, 2022 - 2028, USD Million
- TABLE 363 Asia Pacific Professional Services Market by Country, 2018 - 2021, USD Million
- TABLE 364 Asia Pacific Professional Services Market by Country, 2022 - 2028, USD Million
- TABLE 365 Asia Pacific Solution Market by Country, 2018 - 2021, USD Million
- TABLE 366 Asia Pacific Solution Market by Country, 2022 - 2028, USD Million
- TABLE 367 Asia Pacific SOC as a Service Market by Offering Type, 2018 - 2021, USD Million
- TABLE 368 Asia Pacific SOC as a Service Market by Offering Type, 2022 - 2028, USD Million
- TABLE 369 Asia Pacific Co-managed Market by Country, 2018 - 2021, USD Million
- TABLE 370 Asia Pacific Co-managed Market by Country, 2022 - 2028, USD Million
- TABLE 371 Asia Pacific Fully Managed Market by Country, 2018 - 2021, USD Million
- TABLE 372 Asia Pacific Fully Managed Market by Country, 2022 - 2028, USD Million
- TABLE 373 Asia Pacific SOC as a Service Market by Organization Size, 2018 - 2021, USD Million
- TABLE 374 Asia Pacific SOC as a Service Market by Organization Size, 2022 - 2028, USD Million
- TABLE 375 Asia Pacific Large Enterprises Market by Country, 2018 - 2021, USD Million
- TABLE 376 Asia Pacific Large Enterprises Market by Country, 2022 - 2028, USD Million
- TABLE 377 Asia Pacific Small & Medium Enterprises Market by Country, 2018 - 2021, USD Million
- TABLE 378 Asia Pacific Small & Medium Enterprises Market by Country, 2022 - 2028, USD Million
- TABLE 379 Asia Pacific SOC as a Service Market by Application, 2018 - 2021, USD Million
- TABLE 380 Asia Pacific SOC as a Service Market by Application, 2022 - 2028, USD Million
- TABLE 381 Asia Pacific Endpoint Security Market by Country, 2018 - 2021, USD Million
- TABLE 382 Asia Pacific Endpoint Security Market by Country, 2022 - 2028, USD Million
- TABLE 383 Asia Pacific Network Security Market by Country, 2018 - 2021, USD Million
- TABLE 384 Asia Pacific Network Security Market by Country, 2022 - 2028, USD Million
- TABLE 385 Asia Pacific Cloud Security Market by Country, 2018 - 2021, USD Million
- TABLE 386 Asia Pacific Cloud Security Market by Country, 2022 - 2028, USD Million
- TABLE 387 Asia Pacific Others Market by Country, 2018 - 2021, USD Million
- TABLE 388 Asia Pacific Others Market by Country, 2022 - 2028, USD Million
- TABLE 389 Asia Pacific SOC as a Service Market by Country, 2018 - 2021, USD Million
- TABLE 390 Asia Pacific SOC as a Service Market by Country, 2022 - 2028, USD Million
- TABLE 391 China SOC as a Service Market, 2018 - 2021, USD Million
- TABLE 392 China SOC as a Service Market, 2022 - 2028, USD Million
- TABLE 393 China SOC as a Service Market by Type, 2018 - 2021, USD Million
- TABLE 394 China SOC as a Service Market by Type, 2022 - 2028, USD Million
- TABLE 395 China SOC as a Service Market by Vertical, 2018 - 2021, USD Million
- TABLE 396 China SOC as a Service Market by Vertical, 2022 - 2028, USD Million
- TABLE 397 China SOC as a Service Market by Component, 2018 - 2021, USD Million
- TABLE 398 China SOC as a Service Market by Component, 2022 - 2028, USD Million
- TABLE 399 China SOC as a Service Market by Offering Type, 2018 - 2021, USD Million
- TABLE 400 China SOC as a Service Market by Offering Type, 2022 - 2028, USD Million
- TABLE 401 China SOC as a Service Market by Organization Size, 2018 - 2021, USD Million
- TABLE 402 China SOC as a Service Market by Organization Size, 2022 - 2028, USD Million
- TABLE 403 China SOC as a Service Market by Application, 2018 - 2021, USD Million
- TABLE 404 China SOC as a Service Market by Application, 2022 - 2028, USD Million
- TABLE 405 Japan SOC as a Service Market, 2018 - 2021, USD Million
- TABLE 406 Japan SOC as a Service Market, 2022 - 2028, USD Million
- TABLE 407 Japan SOC as a Service Market by Type, 2018 - 2021, USD Million
- TABLE 408 Japan SOC as a Service Market by Type, 2022 - 2028, USD Million
- TABLE 409 Japan SOC as a Service Market by Vertical, 2018 - 2021, USD Million
- TABLE 410 Japan SOC as a Service Market by Vertical, 2022 - 2028, USD Million
- TABLE 411 Japan SOC as a Service Market by Component, 2018 - 2021, USD Million
- TABLE 412 Japan SOC as a Service Market by Component, 2022 - 2028, USD Million
- TABLE 413 Japan SOC as a Service Market by Offering Type, 2018 - 2021, USD Million
- TABLE 414 Japan SOC as a Service Market by Offering Type, 2022 - 2028, USD Million
- TABLE 415 Japan SOC as a Service Market by Organization Size, 2018 - 2021, USD Million
- TABLE 416 Japan SOC as a Service Market by Organization Size, 2022 - 2028, USD Million
- TABLE 417 Japan SOC as a Service Market by Application, 2018 - 2021, USD Million
- TABLE 418 Japan SOC as a Service Market by Application, 2022 - 2028, USD Million
- TABLE 419 India SOC as a Service Market, 2018 - 2021, USD Million
- TABLE 420 India SOC as a Service Market, 2022 - 2028, USD Million
- TABLE 421 India SOC as a Service Market by Type, 2018 - 2021, USD Million
- TABLE 422 India SOC as a Service Market by Type, 2022 - 2028, USD Million
- TABLE 423 India SOC as a Service Market by Vertical, 2018 - 2021, USD Million
- TABLE 424 India SOC as a Service Market by Vertical, 2022 - 2028, USD Million
- TABLE 425 India SOC as a Service Market by Component, 2018 - 2021, USD Million
- TABLE 426 India SOC as a Service Market by Component, 2022 - 2028, USD Million
- TABLE 427 India SOC as a Service Market by Offering Type, 2018 - 2021, USD Million
- TABLE 428 India SOC as a Service Market by Offering Type, 2022 - 2028, USD Million
- TABLE 429 India SOC as a Service Market by Organization Size, 2018 - 2021, USD Million
- TABLE 430 India SOC as a Service Market by Organization Size, 2022 - 2028, USD Million
- TABLE 431 India SOC as a Service Market by Application, 2018 - 2021, USD Million
- TABLE 432 India SOC as a Service Market by Application, 2022 - 2028, USD Million
- TABLE 433 South Korea SOC as a Service Market, 2018 - 2021, USD Million
- TABLE 434 South Korea SOC as a Service Market, 2022 - 2028, USD Million
- TABLE 435 South Korea SOC as a Service Market by Type, 2018 - 2021, USD Million
- TABLE 436 South Korea SOC as a Service Market by Type, 2022 - 2028, USD Million
- TABLE 437 South Korea SOC as a Service Market by Vertical, 2018 - 2021, USD Million
- TABLE 438 South Korea SOC as a Service Market by Vertical, 2022 - 2028, USD Million
- TABLE 439 South Korea SOC as a Service Market by Component, 2018 - 2021, USD Million
- TABLE 440 South Korea SOC as a Service Market by Component, 2022 - 2028, USD Million
- TABLE 441 South Korea SOC as a Service Market by Offering Type, 2018 - 2021, USD Million
- TABLE 442 South Korea SOC as a Service Market by Offering Type, 2022 - 2028, USD Million
- TABLE 443 South Korea SOC as a Service Market by Organization Size, 2018 - 2021, USD Million
- TABLE 444 South Korea SOC as a Service Market by Organization Size, 2022 - 2028, USD Million
- TABLE 445 South Korea SOC as a Service Market by Application, 2018 - 2021, USD Million
- TABLE 446 South Korea SOC as a Service Market by Application, 2022 - 2028, USD Million
- TABLE 447 Singapore SOC as a Service Market, 2018 - 2021, USD Million
- TABLE 448 Singapore SOC as a Service Market, 2022 - 2028, USD Million
- TABLE 449 Singapore SOC as a Service Market by Type, 2018 - 2021, USD Million
- TABLE 450 Singapore SOC as a Service Market by Type, 2022 - 2028, USD Million
- TABLE 451 Singapore SOC as a Service Market by Vertical, 2018 - 2021, USD Million
- TABLE 452 Singapore SOC as a Service Market by Vertical, 2022 - 2028, USD Million
- TABLE 453 Singapore SOC as a Service Market by Component, 2018 - 2021, USD Million
- TABLE 454 Singapore SOC as a Service Market by Component, 2022 - 2028, USD Million
- TABLE 455 Singapore SOC as a Service Market by Offering Type, 2018 - 2021, USD Million
- TABLE 456 Singapore SOC as a Service Market by Offering Type, 2022 - 2028, USD Million
- TABLE 457 Singapore SOC as a Service Market by Organization Size, 2018 - 2021, USD Million
- TABLE 458 Singapore SOC as a Service Market by Organization Size, 2022 - 2028, USD Million
- TABLE 459 Singapore SOC as a Service Market by Application, 2018 - 2021, USD Million
- TABLE 460 Singapore SOC as a Service Market by Application, 2022 - 2028, USD Million
- TABLE 461 Malaysia SOC as a Service Market, 2018 - 2021, USD Million
- TABLE 462 Malaysia SOC as a Service Market, 2022 - 2028, USD Million
- TABLE 463 Malaysia SOC as a Service Market by Type, 2018 - 2021, USD Million
- TABLE 464 Malaysia SOC as a Service Market by Type, 2022 - 2028, USD Million
- TABLE 465 Malaysia SOC as a Service Market by Vertical, 2018 - 2021, USD Million
- TABLE 466 Malaysia SOC as a Service Market by Vertical, 2022 - 2028, USD Million
- TABLE 467 Malaysia SOC as a Service Market by Component, 2018 - 2021, USD Million
- TABLE 468 Malaysia SOC as a Service Market by Component, 2022 - 2028, USD Million
- TABLE 469 Malaysia SOC as a Service Market by Offering Type, 2018 - 2021, USD Million
- TABLE 470 Malaysia SOC as a Service Market by Offering Type, 2022 - 2028, USD Million
- TABLE 471 Malaysia SOC as a Service Market by Organization Size, 2018 - 2021, USD Million
- TABLE 472 Malaysia SOC as a Service Market by Organization Size, 2022 - 2028, USD Million
- TABLE 473 Malaysia SOC as a Service Market by Application, 2018 - 2021, USD Million
- TABLE 474 Malaysia SOC as a Service Market by Application, 2022 - 2028, USD Million
- TABLE 475 Rest of Asia Pacific SOC as a Service Market, 2018 - 2021, USD Million
- TABLE 476 Rest of Asia Pacific SOC as a Service Market, 2022 - 2028, USD Million
- TABLE 477 Rest of Asia Pacific SOC as a Service Market by Type, 2018 - 2021, USD Million
- TABLE 478 Rest of Asia Pacific SOC as a Service Market by Type, 2022 - 2028, USD Million
- TABLE 479 Rest of Asia Pacific SOC as a Service Market by Vertical, 2018 - 2021, USD Million
- TABLE 480 Rest of Asia Pacific SOC as a Service Market by Vertical, 2022 - 2028, USD Million
- TABLE 481 Rest of Asia Pacific SOC as a Service Market by Component, 2018 - 2021, USD Million
- TABLE 482 Rest of Asia Pacific SOC as a Service Market by Component, 2022 - 2028, USD Million
- TABLE 483 Rest of Asia Pacific SOC as a Service Market by Offering Type, 2018 - 2021, USD Million
- TABLE 484 Rest of Asia Pacific SOC as a Service Market by Offering Type, 2022 - 2028, USD Million
- TABLE 485 Rest of Asia Pacific SOC as a Service Market by Organization Size, 2018 - 2021, USD Million
- TABLE 486 Rest of Asia Pacific SOC as a Service Market by Organization Size, 2022 - 2028, USD Million
- TABLE 487 Rest of Asia Pacific SOC as a Service Market by Application, 2018 - 2021, USD Million
- TABLE 488 Rest of Asia Pacific SOC as a Service Market by Application, 2022 - 2028, USD Million
- TABLE 489 LAMEA SOC as a Service Market, 2018 - 2021, USD Million
- TABLE 490 LAMEA SOC as a Service Market, 2022 - 2028, USD Million
- TABLE 491 LAMEA SOC as a Service Market by Type, 2018 - 2021, USD Million
- TABLE 492 LAMEA SOC as a Service Market by Type, 2022 - 2028, USD Million
- TABLE 493 LAMEA Vulnerability Assessment & Threat Detection Market by Country, 2018 - 2021, USD Million
- TABLE 494 LAMEA Vulnerability Assessment & Threat Detection Market by Country, 2022 - 2028, USD Million
- TABLE 495 LAMEA Incident Response Market by Country, 2018 - 2021, USD Million
- TABLE 496 LAMEA Incident Response Market by Country, 2022 - 2028, USD Million
- TABLE 497 LAMEA SOC as a Service Market by Vertical, 2018 - 2021, USD Million
- TABLE 498 LAMEA SOC as a Service Market by Vertical, 2022 - 2028, USD Million
- TABLE 499 LAMEA BFSI Market by Country, 2018 - 2021, USD Million
- TABLE 500 LAMEA BFSI Market by Country, 2022 - 2028, USD Million
- TABLE 501 LAMEA IT & ITeS Market by Country, 2018 - 2021, USD Million
- TABLE 502 LAMEA IT & ITeS Market by Country, 2022 - 2028, USD Million
- TABLE 503 LAMEA Manufacturing Market by Country, 2018 - 2021, USD Million
- TABLE 504 LAMEA Manufacturing Market by Country, 2022 - 2028, USD Million
- TABLE 505 LAMEA Telecommunications Market by Country, 2018 - 2021, USD Million
- TABLE 506 LAMEA Telecommunications Market by Country, 2022 - 2028, USD Million
- TABLE 507 LAMEA Government & Public Sector Market by Country, 2018 - 2021, USD Million
- TABLE 508 LAMEA Government & Public Sector Market by Country, 2022 - 2028, USD Million
- TABLE 509 LAMEA Healthcare & Life Sciences Market by Country, 2018 - 2021, USD Million
- TABLE 510 LAMEA Healthcare & Life Sciences Market by Country, 2022 - 2028, USD Million
- TABLE 511 LAMEA Transportation & Logistics Market by Country, 2018 - 2021, USD Million
- TABLE 512 LAMEA Transportation & Logistics Market by Country, 2022 - 2028, USD Million
- TABLE 513 LAMEA Energy & Utilities Market by Country, 2018 - 2021, USD Million
- TABLE 514 LAMEA Energy & Utilities Market by Country, 2022 - 2028, USD Million
- TABLE 515 LAMEA Other Vertical Market by Country, 2018 - 2021, USD Million
- TABLE 516 LAMEA Other Vertical Market by Country, 2022 - 2028, USD Million
- TABLE 517 LAMEA SOC as a Service Market by Component, 2018 - 2021, USD Million
- TABLE 518 LAMEA SOC as a Service Market by Component, 2022 - 2028, USD Million
- TABLE 519 LAMEA Professional Services Market by Country, 2018 - 2021, USD Million
- TABLE 520 LAMEA Professional Services Market by Country, 2022 - 2028, USD Million
- TABLE 521 LAMEA Solution Market by Country, 2018 - 2021, USD Million
- TABLE 522 LAMEA Solution Market by Country, 2022 - 2028, USD Million
- TABLE 523 LAMEA SOC as a Service Market by Offering Type, 2018 - 2021, USD Million
- TABLE 524 LAMEA SOC as a Service Market by Offering Type, 2022 - 2028, USD Million
- TABLE 525 LAMEA Co-managed Market by Country, 2018 - 2021, USD Million
- TABLE 526 LAMEA Co-managed Market by Country, 2022 - 2028, USD Million
- TABLE 527 LAMEA Fully Managed Market by Country, 2018 - 2021, USD Million
- TABLE 528 LAMEA Fully Managed Market by Country, 2022 - 2028, USD Million
- TABLE 529 LAMEA SOC as a Service Market by Organization Size, 2018 - 2021, USD Million
- TABLE 530 LAMEA SOC as a Service Market by Organization Size, 2022 - 2028, USD Million
- TABLE 531 LAMEA Large Enterprises Market by Country, 2018 - 2021, USD Million
- TABLE 532 LAMEA Large Enterprises Market by Country, 2022 - 2028, USD Million
- TABLE 533 LAMEA Small & Medium Enterprises Market by Country, 2018 - 2021, USD Million
- TABLE 534 LAMEA Small & Medium Enterprises Market by Country, 2022 - 2028, USD Million
- TABLE 535 LAMEA SOC as a Service Market by Application, 2018 - 2021, USD Million
- TABLE 536 LAMEA SOC as a Service Market by Application, 2022 - 2028, USD Million
- TABLE 537 LAMEA Endpoint Security Market by Country, 2018 - 2021, USD Million
- TABLE 538 LAMEA Endpoint Security Market by Country, 2022 - 2028, USD Million
- TABLE 539 LAMEA Network Security Market by Country, 2018 - 2021, USD Million
- TABLE 540 LAMEA Network Security Market by Country, 2022 - 2028, USD Million
- TABLE 541 LAMEA Cloud Security Market by Country, 2018 - 2021, USD Million
- TABLE 542 LAMEA Cloud Security Market by Country, 2022 - 2028, USD Million
- TABLE 543 LAMEA Others Market by Country, 2018 - 2021, USD Million
- TABLE 544 LAMEA Others Market by Country, 2022 - 2028, USD Million
- TABLE 545 LAMEA SOC as a Service Market by Country, 2018 - 2021, USD Million
- TABLE 546 LAMEA SOC as a Service Market by Country, 2022 - 2028, USD Million
- TABLE 547 Brazil SOC as a Service Market, 2018 - 2021, USD Million
- TABLE 548 Brazil SOC as a Service Market, 2022 - 2028, USD Million
- TABLE 549 Brazil SOC as a Service Market by Type, 2018 - 2021, USD Million
- TABLE 550 Brazil SOC as a Service Market by Type, 2022 - 2028, USD Million
- TABLE 551 Brazil SOC as a Service Market by Vertical, 2018 - 2021, USD Million
- TABLE 552 Brazil SOC as a Service Market by Vertical, 2022 - 2028, USD Million
- TABLE 553 Brazil SOC as a Service Market by Component, 2018 - 2021, USD Million
- TABLE 554 Brazil SOC as a Service Market by Component, 2022 - 2028, USD Million
- TABLE 555 Brazil SOC as a Service Market by Offering Type, 2018 - 2021, USD Million
- TABLE 556 Brazil SOC as a Service Market by Offering Type, 2022 - 2028, USD Million
- TABLE 557 Brazil SOC as a Service Market by Organization Size, 2018 - 2021, USD Million
- TABLE 558 Brazil SOC as a Service Market by Organization Size, 2022 - 2028, USD Million
- TABLE 559 Brazil SOC as a Service Market by Application, 2018 - 2021, USD Million
- TABLE 560 Brazil SOC as a Service Market by Application, 2022 - 2028, USD Million
- TABLE 561 Argentina SOC as a Service Market, 2018 - 2021, USD Million
- TABLE 562 Argentina SOC as a Service Market, 2022 - 2028, USD Million
- TABLE 563 Argentina SOC as a Service Market by Type, 2018 - 2021, USD Million
- TABLE 564 Argentina SOC as a Service Market by Type, 2022 - 2028, USD Million
- TABLE 565 Argentina SOC as a Service Market by Vertical, 2018 - 2021, USD Million
- TABLE 566 Argentina SOC as a Service Market by Vertical, 2022 - 2028, USD Million
- TABLE 567 Argentina SOC as a Service Market by Component, 2018 - 2021, USD Million
- TABLE 568 Argentina SOC as a Service Market by Component, 2022 - 2028, USD Million
- TABLE 569 Argentina SOC as a Service Market by Offering Type, 2018 - 2021, USD Million
- TABLE 570 Argentina SOC as a Service Market by Offering Type, 2022 - 2028, USD Million
- TABLE 571 Argentina SOC as a Service Market by Organization Size, 2018 - 2021, USD Million
- TABLE 572 Argentina SOC as a Service Market by Organization Size, 2022 - 2028, USD Million
- TABLE 573 Argentina SOC as a Service Market by Application, 2018 - 2021, USD Million
- TABLE 574 Argentina SOC as a Service Market by Application, 2022 - 2028, USD Million
- TABLE 575 UAE SOC as a Service Market, 2018 - 2021, USD Million
- TABLE 576 UAE SOC as a Service Market, 2022 - 2028, USD Million
- TABLE 577 UAE SOC as a Service Market by Type, 2018 - 2021, USD Million
- TABLE 578 UAE SOC as a Service Market by Type, 2022 - 2028, USD Million
- TABLE 579 UAE SOC as a Service Market by Vertical, 2018 - 2021, USD Million
- TABLE 580 UAE SOC as a Service Market by Vertical, 2022 - 2028, USD Million
- TABLE 581 UAE SOC as a Service Market by Component, 2018 - 2021, USD Million
- TABLE 582 UAE SOC as a Service Market by Component, 2022 - 2028, USD Million
- TABLE 583 UAE SOC as a Service Market by Offering Type, 2018 - 2021, USD Million
- TABLE 584 UAE SOC as a Service Market by Offering Type, 2022 - 2028, USD Million
- TABLE 585 UAE SOC as a Service Market by Organization Size, 2018 - 2021, USD Million
- TABLE 586 UAE SOC as a Service Market by Organization Size, 2022 - 2028, USD Million
- TABLE 587 UAE SOC as a Service Market by Application, 2018 - 2021, USD Million
- TABLE 588 UAE SOC as a Service Market by Application, 2022 - 2028, USD Million
- TABLE 589 Saudi Arabia SOC as a Service Market, 2018 - 2021, USD Million
- TABLE 590 Saudi Arabia SOC as a Service Market, 2022 - 2028, USD Million
- TABLE 591 Saudi Arabia SOC as a Service Market by Type, 2018 - 2021, USD Million
- TABLE 592 Saudi Arabia SOC as a Service Market by Type, 2022 - 2028, USD Million
- TABLE 593 Saudi Arabia SOC as a Service Market by Vertical, 2018 - 2021, USD Million
- TABLE 594 Saudi Arabia SOC as a Service Market by Vertical, 2022 - 2028, USD Million
- TABLE 595 Saudi Arabia SOC as a Service Market by Component, 2018 - 2021, USD Million
- TABLE 596 Saudi Arabia SOC as a Service Market by Component, 2022 - 2028, USD Million
- TABLE 597 Saudi Arabia SOC as a Service Market by Offering Type, 2018 - 2021, USD Million
- TABLE 598 Saudi Arabia SOC as a Service Market by Offering Type, 2022 - 2028, USD Million
- TABLE 599 Saudi Arabia SOC as a Service Market by Organization Size, 2018 - 2021, USD Million
- TABLE 600 Saudi Arabia SOC as a Service Market by Organization Size, 2022 - 2028, USD Million
- TABLE 601 Saudi Arabia SOC as a Service Market by Application, 2018 - 2021, USD Million
- TABLE 602 Saudi Arabia SOC as a Service Market by Application, 2022 - 2028, USD Million
- TABLE 603 South Africa SOC as a Service Market, 2018 - 2021, USD Million
- TABLE 604 South Africa SOC as a Service Market, 2022 - 2028, USD Million
- TABLE 605 South Africa SOC as a Service Market by Type, 2018 - 2021, USD Million
- TABLE 606 South Africa SOC as a Service Market by Type, 2022 - 2028, USD Million
- TABLE 607 South Africa SOC as a Service Market by Vertical, 2018 - 2021, USD Million
- TABLE 608 South Africa SOC as a Service Market by Vertical, 2022 - 2028, USD Million
- TABLE 609 South Africa SOC as a Service Market by Component, 2018 - 2021, USD Million
- TABLE 610 South Africa SOC as a Service Market by Component, 2022 - 2028, USD Million
- TABLE 611 South Africa SOC as a Service Market by Offering Type, 2018 - 2021, USD Million
- TABLE 612 South Africa SOC as a Service Market by Offering Type, 2022 - 2028, USD Million
- TABLE 613 South Africa SOC as a Service Market by Organization Size, 2018 - 2021, USD Million
- TABLE 614 South Africa SOC as a Service Market by Organization Size, 2022 - 2028, USD Million
- TABLE 615 South Africa SOC as a Service Market by Application, 2018 - 2021, USD Million
- TABLE 616 South Africa SOC as a Service Market by Application, 2022 - 2028, USD Million
- TABLE 617 Nigeria SOC as a Service Market, 2018 - 2021, USD Million
- TABLE 618 Nigeria SOC as a Service Market, 2022 - 2028, USD Million
- TABLE 619 Nigeria SOC as a Service Market by Type, 2018 - 2021, USD Million
- TABLE 620 Nigeria SOC as a Service Market by Type, 2022 - 2028, USD Million
- TABLE 621 Nigeria SOC as a Service Market by Vertical, 2018 - 2021, USD Million
- TABLE 622 Nigeria SOC as a Service Market by Vertical, 2022 - 2028, USD Million
- TABLE 623 Nigeria SOC as a Service Market by Component, 2018 - 2021, USD Million
- TABLE 624 Nigeria SOC as a Service Market by Component, 2022 - 2028, USD Million
- TABLE 625 Nigeria SOC as a Service Market by Offering Type, 2018 - 2021, USD Million
- TABLE 626 Nigeria SOC as a Service Market by Offering Type, 2022 - 2028, USD Million
- TABLE 627 Nigeria SOC as a Service Market by Organization Size, 2018 - 2021, USD Million
- TABLE 628 Nigeria SOC as a Service Market by Organization Size, 2022 - 2028, USD Million
- TABLE 629 Nigeria SOC as a Service Market by Application, 2018 - 2021, USD Million
- TABLE 630 Nigeria SOC as a Service Market by Application, 2022 - 2028, USD Million
- TABLE 631 Rest of LAMEA SOC as a Service Market, 2018 - 2021, USD Million
- TABLE 632 Rest of LAMEA SOC as a Service Market, 2022 - 2028, USD Million
- TABLE 633 Rest of LAMEA SOC as a Service Market by Type, 2018 - 2021, USD Million
- TABLE 634 Rest of LAMEA SOC as a Service Market by Type, 2022 - 2028, USD Million
- TABLE 635 Rest of LAMEA SOC as a Service Market by Vertical, 2018 - 2021, USD Million
- TABLE 636 Rest of LAMEA SOC as a Service Market by Vertical, 2022 - 2028, USD Million
- TABLE 637 Rest of LAMEA SOC as a Service Market by Component, 2018 - 2021, USD Million
- TABLE 638 Rest of LAMEA SOC as a Service Market by Component, 2022 - 2028, USD Million
- TABLE 639 Rest of LAMEA SOC as a Service Market by Offering Type, 2018 - 2021, USD Million
- TABLE 640 Rest of LAMEA SOC as a Service Market by Offering Type, 2022 - 2028, USD Million
- TABLE 641 Rest of LAMEA SOC as a Service Market by Organization Size, 2018 - 2021, USD Million
- TABLE 642 Rest of LAMEA SOC as a Service Market by Organization Size, 2022 - 2028, USD Million
- TABLE 643 Rest of LAMEA SOC as a Service Market by Application, 2018 - 2021, USD Million
- TABLE 644 Rest of LAMEA SOC as a Service Market by Application, 2022 - 2028, USD Million
- TABLE 645 Key Information - AT&T, Inc.
- TABLE 646 Key information - IBM Corporation
- TABLE 647 Key Information - NTT Data Corporation
- TABLE 648 key information - Verizon Communications, Inc.
- TABLE 649 Key Information - Cloudflare, Inc.
- TABLE 650 key information - Fortinet, Inc.
- TABLE 651 Key Information - Check Point Software Technologies Ltd.
- TABLE 652 key information - Atos Group
- TABLE 653 Key Information - Tata Consultancy Services Ltd.
- TABLE 654 Key Information - Profico
List of Figures
- FIG 1 Methodology for the research
- FIG 2 KBV Cardinal Matrix
- FIG 3 Market Share Analysis, 2021
- FIG 4 Key Leading Strategies: Percentage Distribution (2018-2022)
- FIG 5 Global SOC as a Service Market share by Type, 2021
- FIG 6 Global SOC as a Service Market share by Type, 2028
- FIG 7 Global SOC as a Service Market by Type, 2018 - 2028, USD Million
- FIG 8 Global SOC as a Service Market share by Vertical, 2021
- FIG 9 Global SOC as a Service Market share by Vertical, 2028
- FIG 10 Global SOC as a Service Market by Vertical, 2018 - 2028, USD Million
- FIG 11 Global SOC as a Service Market share by Component, 2021
- FIG 12 Global SOC as a Service Market share by Component, 2028
- FIG 13 Global SOC as a Service Market by Component, 2018 - 2028, USD Million
- FIG 14 Global SOC as a Service Market share by Offering Type, 2021
- FIG 15 Global SOC as a Service Market share by Offering Type, 2028
- FIG 16 Global SOC as a Service Market by Offering Type, 2018 - 2028, USD Million
- FIG 17 Global SOC as a Service Market share by Organization Size, 2021
- FIG 18 Global SOC as a Service Market share by Organization Size, 2028
- FIG 19 Global SOC as a Service Market by Organization Size, 2018 - 2028, USD Million
- FIG 20 Global SOC as a Service Market share by Application, 2021
- FIG 21 Global SOC as a Service Market share by Application, 2028
- FIG 22 Global SOC as a Service Market by Application, 2018 - 2028, USD Million
- FIG 23 Global SOC as a Service Market share by Region, 2021
- FIG 24 Global SOC as a Service Market share by Region, 2028
- FIG 25 Global SOC as a Service Market by Region, 2018 - 2028, USD Million
- FIG 26 Recent strategies and developments: International Business Machines Corporation
- FIG 27 Recent strategies and developments: NTT Data Corporation
- FIG 28 SWOT Analysis: NTT Data Corporation
- FIG 29 SWOT Analysis: Tata Consultancy Services Ltd.
The Global SOC as a Service Market size is expected to reach $10.9 billion by 2028, rising at a market growth of 10.2% CAGR during the forecast period.
SOC as a service is a cloud-based solution that allows businesses to outsource the complete security operation, including endpoint management, network management, application management, database management, and server website management. It primarily provides the critical cyber security expertise required to combat sophisticated cyber-attacks. Moreover, this service offers commendable reaction and detection services for reducing threats early on. This cloud service is made up of a dedicated group of information security experts that are in charge of monitoring and evaluating the organization's security posture.
In terms of volume and complexity, cyber-attacks are fast expanding across emerging economies, and incident response units are straining the limits in terms of time, talent, and resources to obtain responsive measures at the correct time to prevent such incidents. Simultaneously, organizations face an unprecedented number of security threats and dangers as the workforce, customers, and partners grow, requiring them to embrace new trends and innovations via digital transformation. For instance, As per IBM, the average cost of a data breach across all industry sectors in 2020 will be multiple million dollars.
Enterprises may make fundamental changes in the way organizations manage and address threats and hazards in the business environments by implementing an intelligent SOC and an effective security service management architecture. The strategy gives managers a complete, end-to-end view of security issues, allowing users to improve response times and better protect the company's data. With proactive policy enforcement and audit & compliance reports, such solutions have also made it easier to comply with audit and compliance standards.
COVID-19 Impact
The demand for security services to combat various cyber risks and attacks is increasing within organizations as a result of the COVID-19 pandemic in 2020. During the COVID-19 pandemic, digital transformation in the banking, financial services, and insurance industries, as well as healthcare, government, and IT and ITeS, is accelerated. The adoption of the remote work trend has resulted in increased web and cloud traffic, which is why managed security services are blooming in every industry. Almost every industry around the globe has been badly impacted by the COVID-19 pandemic. Moreover, mobility restrictions have disrupted supply chains around the world, but it has created possibilities for the service industry and has had a favorable impact on the SOC's expansion as a service market. The COVID-19 pandemic has affected every part of society, including individuals and businesses.
Market Growth Factors
Drastic growth in sophistication of cyber-attacks and security breaches
Organizations have relied on cyber security in recent years to secure their digital assets from escalating cyber threats. Some of the most well-known cyber risks include phishing, ransom ware, phishing, malware, browser gateway frauds, and Distributed Denial of Service (DDoS), whaling, and spear phishing. Cyber terrorists assault endpoints, networks, data, and other IT infrastructure, causing massive financial losses to individuals, businesses, and governments. Cyber risks reduce business productivity by compromising essential IT infrastructure and sensitive data. As the outcome of the rapid growth of digital transactions across industrial verticals, the incidence of cyber-crime is increasing.
Proper adherence to regulatory and data protection directives for cyber-defense
The regulatory landscape is becoming increasingly complicated, and enterprises must implement security controls and policies to attain and show regulatory compliance. While a managed SOC provider can help with regulatory compliance, using a third-party provider can make regulatory compliance more complicated and need trust in the service provider to execute the compliance-related responsibilities. Over the years, sophisticated cyber-attacks have wreaked havoc on businesses, resulting in tremendous financial losses. Organizations are constantly looking for SOCaaS subscriptions to counter such disruptive attacks. It is also necessary to adhere to current government data protection laws while using SOCaaS for cyber defense.
Market Restraining Factors
Enterprises showing a lack of faith in SOCaaS suppliers' full control of system architecture
When companies lack in-house security knowledge or have budgetary constraints, organizations turn to SOCaaS and third-party service providers. While outsourcing security operations to third-party service providers, many factors must be considered, including the security of the third infrastructure, the party's expertise, up-to-date cyber-security technology, round-the-clock assistance, and the overall choice to migrate to security as a service. To counteract the latest threats, service providers must ensure that the infrastructure is secure and up to date. The infrastructure of service providers holds vital data from various organizations, and it is very vulnerable to repetitive and complicated attacks and this might be a deterrent for enterprises to hand up the data to such service providers.
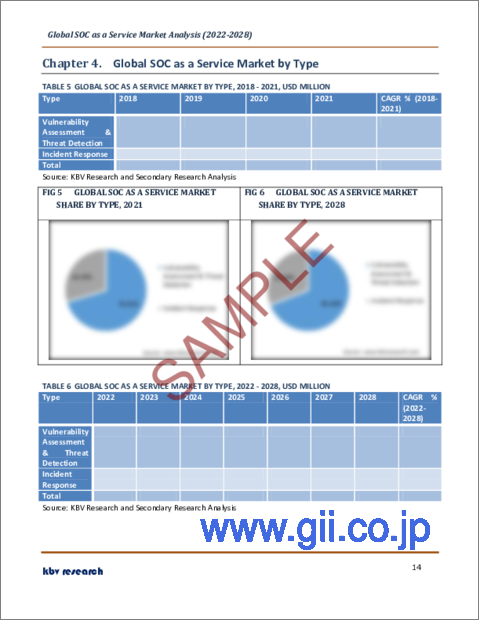
Type Outlook
Based on Type, the market is segmented into Vulnerability Assessment & Threat Detection and Incident Response. The Incident Response segment acquired a significant revenue share in the SOC as a Service market in 2021. Such services help businesses safeguard the systems from exploitation and data loss. The complexity of sophisticated technologies positively influences the demand of SOCaaS industry. The service provides a method for managing and responding to complicated cyber-attacks after they have been detected, as well as assisting businesses in recouping IT damages and data losses. It assists organizations in not just dealing with and managing the aftermath of assaults, but also in defining a clear set of protocols that must be followed prior to and during the security incidents.
Vertical Outlook
Based on Vertical, the market is segmented into BFSI, IT & ITeS, Manufacturing, Telecommunications, Government & Public Sector, Healthcare & Life Sciences, Transportation & Logistics, Energy & Utilities, and Others. The Healthcare & Life Science segment garnered a significant revenue share in the SOC as a Service market in 2021. Healthcare businesses confront multiple issues, including safeguarding the privacy of Electronic Health Records (EHRs) and complying with various HIPAA compliance, which has aided the healthcare industry vertical's IT departments in upgrading security policies and processes to PHI. Medical equipment and pharmaceutical manufacturers, health insurance companies, commercial and governmental healthcare institutions, and diagnostic, preventative, remedial, and therapeutic service providers make up the healthcare vertical. Companies in such areas must manage personal health information and sensitive patient data, necessitating the use of high-security services.
Component Outlook
Based on Component, the market is segmented into Professional Services and Solution. The professional services segment acquired the highest revenue share in the SOC as a Service market in 2021. Professional Services is a service offering for enterprises wishing to better understand and mitigate the dangers posed by today's focused attacks from sophisticated criminal organizations and determined human adversaries.
Offering Type Outlook
Based on Offering Type, the market is segmented into Co-managed and Fully Managed. The Co-Managed segment procured the maximum revenue share in the SOC as a Service Market in 2021. This offering type is a service model for IT management that enable organizations and administrators to choose which IT services to retain in-house and which to outsource. Co-Managed Services is an IT paradigm that combines an internal IT team's convenience and strategic framework with a managed-service provider's support and thorough understanding.
Organization Size Outlook
Based on Organization Size, the market is segmented into Large Enterprises and Small & Medium Enterprises. The Small & Medium enterprise segment garnered a significant revenue share in the SOC as a Service market in 2021. The reason behind the tiny staff and limited financial resources, SMEs confront a variety of IT issues in the current environment. Because SMEs do not follow any formal security procedures, managed services are becoming increasingly required. When it comes to SMEs, cyber security is only considered after a cyber-attack has occurred. The usage of SOCaaS is projected to accelerate among small organizations. As SMEs need more security to improve the productivity and pool the knowledge base, providers have responded by offering services at a lesser cost. SOCaaS is the greatest option for SMEs because of its cost-effectiveness. SOCaaS adoption and acceptance by SMEs will help the company grow the customer base and improve the company efficiency.
Application Outlook
Based on Application, the market is segmented into Endpoint Security, Network Security, Cloud Security, and Others. The endpoint security segment acquired the highest revenue share in the SOC as a Service Market in 2021. Endpoint security refers to the protection given by enterprise networks for endpoints like personal computers, laptops, cellphones, tablets, bar code readers, and point of sale (POS). Viruses, hackers, program tampering, and heap overflow are all frequent endpoint layer assaults. Financial, organizational, and workforce information is stored on devices connected to a platform, and it must be safeguarded from data loss or intrusion. SOCaaS solutions assist businesses in protecting endpoints and networking assets against malicious attacks.
Regional Outlook
Based on Regions, the market is segmented into North America, Europe, Asia Pacific, and Latin America, Middle East & Africa. North America emerged as the leading region in the SOC as a Service with the largest revenue share in 2021. North America has the highest number of SOCaaS providers because it is the most afflicted region by cyber security breaches. Protecting enterprise-critical infrastructure and confidential data has become one of the primary problems as the globe moves toward inter connectivity and digitization. As more cloud-based apps, technologies, and platforms are adopted, the demand for stronger security solutions for such platforms is growing. The governments across this region have recognized information security as the most important economic and national security threat. Governments allocate specific budgets and mandate PCI DSS and HIPAA standards to make North America the most attractive market for different types of businesses.
The major strategies followed by the market participants are Acquisitions. Based on the Analysis presented in the Cardinal matrix; Verizon Communications, Inc. and AT&T, Inc. are the forerunners in the SOC as a Service Market. Companies such as IBM Corporation, Tata Consultancy Services Ltd., NTT Data Corporation are some of the key innovators in the Market.
The market research report covers the analysis of key stake holders of the market. Key companies profiled in the report include AT&T, Inc., IBM Corporation, NTT Data Corporation, Verizon Communications, Inc., Cloudflare, Inc., Fortinet, Inc., Check Point Software Technologies Ltd., Atos Group, Tata Consultancy Services Ltd., and Profico.
Recent Strategies Deployed in SOC as a Service Market
Partnership, Collaboration and Agreement:
Mar-2022: Cloudflare formed a partnership with CrowdStrike, a leader in cloud-delivered protection of endpoints, cloud workloads, identity, and data. The partnership aimed to provide joint customers easy and powerful controls to ensure employees have safe access to applications as well as offer joint customers with Zero Trust capabilities that are unmatched in the industry.
Apr-2021: IBM teamed up with HCL Technologies, a multinational information technology services and consulting company, based in India. This collaboration aimed to unify and simplify threat management for clients through a modernized security operation center (SOC) platform as well as develop an integrated security platform to link security teams, tools, and processes over the threat lifecycle. In addition, this collaboration would build and help organizations with digital transformation.
Feb-2020: NTT Data came into a partnership with Palo Alto Networks, the global cybersecurity leader. This partnership aimed to offer a portfolio of intelligence-driven security products that would help clients minimize risk by reducing the time to predict, detect, and respond to attacks. The new offering would emphasize the intelligent workplace, intelligent infrastructure, and intelligent cybersecurity as well as would unify with current digital workspaces and match specific cybersecurity and network requirements.
Product Launch and Product Expansion:
Apr-2022: Profico introduced ProSOC Identity Threat Detection and Response. This product would help with Identity Threat Detection and Response and work with current security tools without proprietary agents or sensors.
Jun-2021: Fortinet expanded its product line with the release of FortiMonitor and FortiAIOps. This product aimed at organizations to enhance digital experience and business outcomes and build Fabric Management Center to provide complete monitoring and automation.
Nov-2020: Check Point Software unveiled its next-generation unified cyber security platform, Check Point R81. This product aimed to allow IT staff to handle the most complex and dynamic network environments simply and efficiently.
Oct-2020: Tata Consultancy Services introduced 10 new Threat Management Centers. This product would emphasize offering cyber security services to its enterprise customers.
Jul-2020: Check Point Software released Infinity SOC, a cloud-based platform. This product aimed to aid enterprises to safeguard networks by delivering accuracy to quickly detect and shut down real attacks, zero-friction deployment, and rapid incident Investigations.
Acquisition and Merger:
Dec-2021: Cloudflare took over Zaraz, an early-stage startup company. This acquisition aimed to propel website speed and security without compromising privacy by lowering the impact of third-party marketing and analytics tools as well as enhancing the surfing experience and safeguarding user privacy.
Nov-2021: IBM took over ReaQta, a leading autonomous detection & response platform. This acquisition aimed to enhance AI to automatically identify and manage threats while remaining undetectable to adversaries. In addition, this acquisition would provide security with an open approach that extends over disparate tools, data, and hybrid cloud environments.
Geographical Expansion:
Mar-2022: Atos expanded its geographical footprints in Sofia, Bulgaria by opening a new security operations center (SOC). This geographical expansion aimed to continue amid the latest reports that potential suitors might want to acquire the Atos cybersecurity and MSSP business.
Feb-2022: IBM expanded its geographical footprints in Bengaluru, India by opening of a cyber-security center. This geographical expansion aimed to resolve the issues of clients in the Asia Pacific region and aid businesses plan for and handling the growing danger of cyberattacks on organizations.
Scope of the Study
Market Segments covered in the Report:
By Type
- Vulnerability Assessment & Threat Detection
- Incident Response
By Vertical
- BFSI
- IT & ITeS
- Manufacturing
- Telecommunications
- Government & Public Sector
- Healthcare & Life Sciences
- Transportation & Logistics
- Energy & Utilities
- Others
By Component
- Professional Services
- Solution
By Offering Type
- Co-managed
- Fully Managed
By Organization Size
- Large Enterprises
- Small & Medium Enterprises
By Application
- Endpoint Security
- Network Security
- Cloud Security
- Others
By Geography
- North America
- US
- Canada
- Mexico
- Rest of North America
- Europe
- Germany
- UK
- France
- Russia
- Spain
- Italy
- Rest of Europe
- Asia Pacific
- China
- Japan
- India
- South Korea
- Singapore
- Malaysia
- Rest of Asia Pacific
- LAMEA
- Brazil
- Argentina
- UAE
- Saudi Arabia
- South Africa
- Nigeria
- Rest of LAMEA
Companies Profiled
- AT&T, Inc.
- IBM Corporation
- NTT Data Corporation
- Verizon Communications, Inc.
- Cloudflare, Inc.
- Fortinet, Inc.
- Check Point Software Technologies Ltd.
- Atos Group
- Tata Consultancy Services Ltd.
- Profico
Unique Offerings from KBV Research
- Exhaustive coverage
- Highest number of market tables and figures
- Subscription based model available
- Guaranteed best price
- Assured post sales research support with 10% customization free
Table of Contents
Chapter 1. Market Scope & Methodology
- 1.1 Market Definition
- 1.2 Objectives
- 1.3 Market Scope
- 1.4 Segmentation
- 1.4.1 Global SOC as a Service Market, by Type
- 1.4.2 Global SOC as a Service Market, by Vertical
- 1.4.3 Global SOC as a Service Market, by Component
- 1.4.4 Global SOC as a Service Market, by Offering Type
- 1.4.5 Global SOC as a Service Market, by Organization Size
- 1.4.6 Global SOC as a Service Market, by Application
- 1.4.7 Global SOC as a Service Market, by Geography
- 1.5 Methodology for the research
Chapter 2. Market Overview
- 2.1 Introduction
- 2.1.1 Overview
- 2.1.1.1 Market Composition and Scenario
- 2.1.1 Overview
- 2.2 Key Factors Impacting the Market
- 2.2.1 Market Drivers
- 2.2.2 Market Restraints
Chapter 3. Competition Analysis - Global
- 3.1 KBV Cardinal Matrix
- 3.2 Recent Industry Wide Strategic Developments
- 3.2.1 Partnerships, Collaborations and Agreements
- 3.2.2 Product Launches and Product Expansions
- 3.2.3 Acquisition and Mergers
- 3.2.4 Geographical Expansions
- 3.3 Market Share Analysis, 2021
- 3.4 Top Winning Strategies
- 3.4.1 Key Leading Strategies: Percentage Distribution (2018-2022)
Chapter 4. Global SOC as a Service Market by Type
- 4.1 Global Vulnerability Assessment & Threat Detection Market by Region
- 4.2 Global Incident Response Market by Region
Chapter 5. Global SOC as a Service Market by Vertical
- 5.1 Global BFSI Market by Region
- 5.2 Global IT & ITeS Market by Region
- 5.3 Global Manufacturing Market by Region
- 5.4 Global Telecommunications Market by Region
- 5.5 Global Government & Public Sector Market by Region
- 5.6 Global Healthcare & Life Sciences Market by Region
- 5.7 Global Transportation & Logistics Market by Region
- 5.8 Global Energy & Utilities Market by Region
- 5.9 Global Other Vertical Market by Region
Chapter 6. Global SOC as a Service Market by Component
- 6.1 Global Professional Services Market by Region
- 6.2 Global Solution Market by Region
Chapter 7. Global SOC as a Service Market by Offering Type
- 7.1 Global Co-managed Market by Region
- 7.2 Global Fully Managed Market by Region
Chapter 8. Global SOC as a Service Market by Organization Size
- 8.1 Global Large Enterprises Market by Region
- 8.2 Global Small & Medium Enterprises Market by Region
Chapter 9. Global SOC as a Service Market by Application
- 9.1 Global Endpoint Security Market by Region
- 9.2 Global Network Security Market by Region
- 9.3 Global Cloud Security Market by Region
- 9.4 Global Others Market by Region
Chapter 10. Global SOC as a Service Market by Region
- 10.1 North America SOC as a Service Market
- 10.1.1 North America SOC as a Service Market by Type
- 10.1.1.1 North America Vulnerability Assessment & Threat Detection Market by Country
- 10.1.1.2 North America Incident Response Market by Country
- 10.1.2 North America SOC as a Service Market by Vertical
- 10.1.2.1 North America BFSI Market by Country
- 10.1.2.2 North America IT & ITeS Market by Country
- 10.1.2.3 North America Manufacturing Market by Country
- 10.1.2.4 North America Telecommunications Market by Country
- 10.1.2.5 North America Government & Public Sector Market by Country
- 10.1.2.6 North America Healthcare & Life Sciences Market by Country
- 10.1.2.7 North America Transportation & Logistics Market by Country
- 10.1.2.8 North America Energy & Utilities Market by Country
- 10.1.2.9 North America Other Vertical Market by Country
- 10.1.3 North America SOC as a Service Market by Component
- 10.1.3.1 North America Professional Services Market by Country
- 10.1.3.2 North America Solution Market by Country
- 10.1.4 North America SOC as a Service Market by Offering Type
- 10.1.4.1 North America Co-managed Market by Country
- 10.1.4.2 North America Fully Managed Market by Country
- 10.1.5 North America SOC as a Service Market by Organization Size
- 10.1.5.1 North America Large Enterprises Market by Country
- 10.1.5.2 North America Small & Medium Enterprises Market by Country
- 10.1.6 North America SOC as a Service Market by Application
- 10.1.6.1 North America Endpoint Security Market by Country
- 10.1.6.2 North America Network Security Market by Country
- 10.1.6.3 North America Cloud Security Market by Country
- 10.1.6.4 North America Others Market by Country
- 10.1.7 North America SOC as a Service Market by Country
- 10.1.7.1 US SOC as a Service Market
- 10.1.7.1.1 US SOC as a Service Market by Type
- 10.1.7.1.2 US SOC as a Service Market by Vertical
- 10.1.7.1.3 US SOC as a Service Market by Component
- 10.1.7.1.4 US SOC as a Service Market by Offering Type
- 10.1.7.1.5 US SOC as a Service Market by Organization Size
- 10.1.7.1.6 US SOC as a Service Market by Application
- 10.1.7.2 Canada SOC as a Service Market
- 10.1.7.2.1 Canada SOC as a Service Market by Type
- 10.1.7.2.2 Canada SOC as a Service Market by Vertical
- 10.1.7.2.3 Canada SOC as a Service Market by Component
- 10.1.7.2.4 Canada SOC as a Service Market by Offering Type
- 10.1.7.2.5 Canada SOC as a Service Market by Organization Size
- 10.1.7.2.6 Canada SOC as a Service Market by Application
- 10.1.7.3 Mexico SOC as a Service Market
- 10.1.7.3.1 Mexico SOC as a Service Market by Type
- 10.1.7.3.2 Mexico SOC as a Service Market by Vertical
- 10.1.7.3.3 Mexico SOC as a Service Market by Component
- 10.1.7.3.4 Mexico SOC as a Service Market by Offering Type
- 10.1.7.3.5 Mexico SOC as a Service Market by Organization Size
- 10.1.7.3.6 Mexico SOC as a Service Market by Application
- 10.1.7.4 Rest of North America SOC as a Service Market
- 10.1.7.4.1 Rest of North America SOC as a Service Market by Type
- 10.1.7.4.2 Rest of North America SOC as a Service Market by Vertical
- 10.1.7.4.3 Rest of North America SOC as a Service Market by Component
- 10.1.7.4.4 Rest of North America SOC as a Service Market by Offering Type
- 10.1.7.4.5 Rest of North America SOC as a Service Market by Organization Size
- 10.1.7.4.6 Rest of North America SOC as a Service Market by Application
- 10.1.7.1 US SOC as a Service Market
- 10.1.1 North America SOC as a Service Market by Type
- 10.2 Europe SOC as a Service Market
- 10.2.1 Europe SOC as a Service Market by Type
- 10.2.1.1 Europe Vulnerability Assessment & Threat Detection Market by Country
- 10.2.1.2 Europe Incident Response Market by Country
- 10.2.2 Europe SOC as a Service Market by Vertical
- 10.2.2.1 Europe BFSI Market by Country
- 10.2.2.2 Europe IT & ITeS Market by Country
- 10.2.2.3 Europe Manufacturing Market by Country
- 10.2.2.4 Europe Telecommunications Market by Country
- 10.2.2.5 Europe Government & Public Sector Market by Country
- 10.2.2.6 Europe Healthcare & Life Sciences Market by Country
- 10.2.2.7 Europe Transportation & Logistics Market by Country
- 10.2.2.8 Europe Energy & Utilities Market by Country
- 10.2.2.9 Europe Other Vertical Market by Country
- 10.2.3 Europe SOC as a Service Market by Component
- 10.2.3.1 Europe Professional Services Market by Country
- 10.2.3.2 Europe Solution Market by Country
- 10.2.4 Europe SOC as a Service Market by Offering Type
- 10.2.4.1 Europe Co-managed Market by Country
- 10.2.4.2 Europe Fully Managed Market by Country
- 10.2.5 Europe SOC as a Service Market by Organization Size
- 10.2.5.1 Europe Large Enterprises Market by Country
- 10.2.5.2 Europe Small & Medium Enterprises Market by Country
- 10.2.6 Europe SOC as a Service Market by Application
- 10.2.6.1 Europe Endpoint Security Market by Country
- 10.2.6.2 Europe Network Security Market by Country
- 10.2.6.3 Europe Cloud Security Market by Country
- 10.2.6.4 Europe Others Market by Country
- 10.2.7 Europe SOC as a Service Market by Country
- 10.2.7.1 Germany SOC as a Service Market
- 10.2.7.1.1 Germany SOC as a Service Market by Type
- 10.2.7.1.2 Germany SOC as a Service Market by Vertical
- 10.2.7.1.3 Germany SOC as a Service Market by Component
- 10.2.7.1.4 Germany SOC as a Service Market by Offering Type
- 10.2.7.1.5 Germany SOC as a Service Market by Organization Size
- 10.2.7.1.6 Germany SOC as a Service Market by Application
- 10.2.7.2 UK SOC as a Service Market
- 10.2.7.2.1 UK SOC as a Service Market by Type
- 10.2.7.2.2 UK SOC as a Service Market by Vertical
- 10.2.7.2.3 UK SOC as a Service Market by Component
- 10.2.7.2.4 UK SOC as a Service Market by Offering Type
- 10.2.7.2.5 UK SOC as a Service Market by Organization Size
- 10.2.7.2.6 UK SOC as a Service Market by Application
- 10.2.7.3 France SOC as a Service Market
- 10.2.7.3.1 France SOC as a Service Market by Type
- 10.2.7.3.2 France SOC as a Service Market by Vertical
- 10.2.7.3.3 France SOC as a Service Market by Component
- 10.2.7.3.4 France SOC as a Service Market by Offering Type
- 10.2.7.3.5 France SOC as a Service Market by Organization Size
- 10.2.7.3.6 France SOC as a Service Market by Application
- 10.2.7.4 Russia SOC as a Service Market
- 10.2.7.4.1 Russia SOC as a Service Market by Type
- 10.2.7.4.2 Russia SOC as a Service Market by Vertical
- 10.2.7.4.3 Russia SOC as a Service Market by Component
- 10.2.7.4.4 Russia SOC as a Service Market by Offering Type
- 10.2.7.4.5 Russia SOC as a Service Market by Organization Size
- 10.2.7.4.6 Russia SOC as a Service Market by Application
- 10.2.7.5 Spain SOC as a Service Market
- 10.2.7.5.1 Spain SOC as a Service Market by Type
- 10.2.7.5.2 Spain SOC as a Service Market by Vertical
- 10.2.7.5.3 Spain SOC as a Service Market by Component
- 10.2.7.5.4 Spain SOC as a Service Market by Offering Type
- 10.2.7.5.5 Spain SOC as a Service Market by Organization Size
- 10.2.7.5.6 Spain SOC as a Service Market by Application
- 10.2.7.6 Italy SOC as a Service Market
- 10.2.7.6.1 Italy SOC as a Service Market by Type
- 10.2.7.6.2 Italy SOC as a Service Market by Vertical
- 10.2.7.6.3 Italy SOC as a Service Market by Component
- 10.2.7.6.4 Italy SOC as a Service Market by Offering Type
- 10.2.7.6.5 Italy SOC as a Service Market by Organization Size
- 10.2.7.6.6 Italy SOC as a Service Market by Application
- 10.2.7.7 Rest of Europe SOC as a Service Market
- 10.2.7.7.1 Rest of Europe SOC as a Service Market by Type
- 10.2.7.7.2 Rest of Europe SOC as a Service Market by Vertical
- 10.2.7.7.3 Rest of Europe SOC as a Service Market by Component
- 10.2.7.7.4 Rest of Europe SOC as a Service Market by Offering Type
- 10.2.7.7.5 Rest of Europe SOC as a Service Market by Organization Size
- 10.2.7.7.6 Rest of Europe SOC as a Service Market by Application
- 10.2.7.1 Germany SOC as a Service Market
- 10.2.1 Europe SOC as a Service Market by Type
- 10.3 Asia Pacific SOC as a Service Market
- 10.3.1 Asia Pacific SOC as a Service Market by Type
- 10.3.1.1 Asia Pacific Vulnerability Assessment & Threat Detection Market by Country
- 10.3.1.2 Asia Pacific Incident Response Market by Country
- 10.3.2 Asia Pacific SOC as a Service Market by Vertical
- 10.3.2.1 Asia Pacific BFSI Market by Country
- 10.3.2.2 Asia Pacific IT & ITeS Market by Country
- 10.3.2.3 Asia Pacific Manufacturing Market by Country
- 10.3.2.4 Asia Pacific Telecommunications Market by Country
- 10.3.2.5 Asia Pacific Government & Public Sector Market by Country
- 10.3.2.6 Asia Pacific Healthcare & Life Sciences Market by Country
- 10.3.2.7 Asia Pacific Transportation & Logistics Market by Country
- 10.3.2.8 Asia Pacific Energy & Utilities Market by Country
- 10.3.2.9 Asia Pacific Other Vertical Market by Country
- 10.3.3 Asia Pacific SOC as a Service Market by Component
- 10.3.3.1 Asia Pacific Professional Services Market by Country
- 10.3.3.2 Asia Pacific Solution Market by Country
- 10.3.4 Asia Pacific SOC as a Service Market by Offering Type
- 10.3.4.1 Asia Pacific Co-managed Market by Country
- 10.3.4.2 Asia Pacific Fully Managed Market by Country
- 10.3.5 Asia Pacific SOC as a Service Market by Organization Size
- 10.3.5.1 Asia Pacific Large Enterprises Market by Country
- 10.3.5.2 Asia Pacific Small & Medium Enterprises Market by Country
- 10.3.6 Asia Pacific SOC as a Service Market by Application
- 10.3.6.1 Asia Pacific Endpoint Security Market by Country
- 10.3.6.2 Asia Pacific Network Security Market by Country
- 10.3.6.3 Asia Pacific Cloud Security Market by Country
- 10.3.6.4 Asia Pacific Others Market by Country
- 10.3.7 Asia Pacific SOC as a Service Market by Country
- 10.3.7.1 China SOC as a Service Market
- 10.3.7.1.1 China SOC as a Service Market by Type
- 10.3.7.1.2 China SOC as a Service Market by Vertical
- 10.3.7.1.3 China SOC as a Service Market by Component
- 10.3.7.1.4 China SOC as a Service Market by Offering Type
- 10.3.7.1.5 China SOC as a Service Market by Organization Size
- 10.3.7.1.6 China SOC as a Service Market by Application
- 10.3.7.2 Japan SOC as a Service Market
- 10.3.7.2.1 Japan SOC as a Service Market by Type
- 10.3.7.2.2 Japan SOC as a Service Market by Vertical
- 10.3.7.2.3 Japan SOC as a Service Market by Component
- 10.3.7.2.4 Japan SOC as a Service Market by Offering Type
- 10.3.7.2.5 Japan SOC as a Service Market by Organization Size
- 10.3.7.2.6 Japan SOC as a Service Market by Application
- 10.3.7.3 India SOC as a Service Market
- 10.3.7.3.1 India SOC as a Service Market by Type
- 10.3.7.3.2 India SOC as a Service Market by Vertical
- 10.3.7.3.3 India SOC as a Service Market by Component
- 10.3.7.3.4 India SOC as a Service Market by Offering Type
- 10.3.7.3.5 India SOC as a Service Market by Organization Size
- 10.3.7.3.6 India SOC as a Service Market by Application
- 10.3.7.4 South Korea SOC as a Service Market
- 10.3.7.4.1 South Korea SOC as a Service Market by Type
- 10.3.7.4.2 South Korea SOC as a Service Market by Vertical
- 10.3.7.4.3 South Korea SOC as a Service Market by Component
- 10.3.7.4.4 South Korea SOC as a Service Market by Offering Type
- 10.3.7.4.5 South Korea SOC as a Service Market by Organization Size
- 10.3.7.4.6 South Korea SOC as a Service Market by Application
- 10.3.7.5 Singapore SOC as a Service Market
- 10.3.7.5.1 Singapore SOC as a Service Market by Type
- 10.3.7.5.2 Singapore SOC as a Service Market by Vertical
- 10.3.7.5.3 Singapore SOC as a Service Market by Component
- 10.3.7.5.4 Singapore SOC as a Service Market by Offering Type
- 10.3.7.5.5 Singapore SOC as a Service Market by Organization Size
- 10.3.7.5.6 Singapore SOC as a Service Market by Application
- 10.3.7.6 Malaysia SOC as a Service Market
- 10.3.7.6.1 Malaysia SOC as a Service Market by Type
- 10.3.7.6.2 Malaysia SOC as a Service Market by Vertical
- 10.3.7.6.3 Malaysia SOC as a Service Market by Component
- 10.3.7.6.4 Malaysia SOC as a Service Market by Offering Type
- 10.3.7.6.5 Malaysia SOC as a Service Market by Organization Size
- 10.3.7.6.6 Malaysia SOC as a Service Market by Application
- 10.3.7.7 Rest of Asia Pacific SOC as a Service Market
- 10.3.7.7.1 Rest of Asia Pacific SOC as a Service Market by Type
- 10.3.7.7.2 Rest of Asia Pacific SOC as a Service Market by Vertical
- 10.3.7.7.3 Rest of Asia Pacific SOC as a Service Market by Component
- 10.3.7.7.4 Rest of Asia Pacific SOC as a Service Market by Offering Type
- 10.3.7.7.5 Rest of Asia Pacific SOC as a Service Market by Organization Size
- 10.3.7.7.6 Rest of Asia Pacific SOC as a Service Market by Application
- 10.3.7.1 China SOC as a Service Market
- 10.3.1 Asia Pacific SOC as a Service Market by Type
- 10.4 LAMEA SOC as a Service Market
- 10.4.1 LAMEA SOC as a Service Market by Type
- 10.4.1.1 LAMEA Vulnerability Assessment & Threat Detection Market by Country
- 10.4.1.2 LAMEA Incident Response Market by Country
- 10.4.2 LAMEA SOC as a Service Market by Vertical
- 10.4.2.1 LAMEA BFSI Market by Country
- 10.4.2.2 LAMEA IT & ITeS Market by Country
- 10.4.2.3 LAMEA Manufacturing Market by Country
- 10.4.2.4 LAMEA Telecommunications Market by Country
- 10.4.2.5 LAMEA Government & Public Sector Market by Country
- 10.4.2.6 LAMEA Healthcare & Life Sciences Market by Country
- 10.4.2.7 LAMEA Transportation & Logistics Market by Country
- 10.4.2.8 LAMEA Energy & Utilities Market by Country
- 10.4.2.9 LAMEA Other Vertical Market by Country
- 10.4.3 LAMEA SOC as a Service Market by Component
- 10.4.3.1 LAMEA Professional Services Market by Country
- 10.4.3.2 LAMEA Solution Market by Country
- 10.4.4 LAMEA SOC as a Service Market by Offering Type
- 10.4.4.1 LAMEA Co-managed Market by Country
- 10.4.4.2 LAMEA Fully Managed Market by Country
- 10.4.5 LAMEA SOC as a Service Market by Organization Size
- 10.4.5.1 LAMEA Large Enterprises Market by Country
- 10.4.5.2 LAMEA Small & Medium Enterprises Market by Country
- 10.4.6 LAMEA SOC as a Service Market by Application
- 10.4.6.1 LAMEA Endpoint Security Market by Country
- 10.4.6.2 LAMEA Network Security Market by Country
- 10.4.6.3 LAMEA Cloud Security Market by Country
- 10.4.6.4 LAMEA Others Market by Country
- 10.4.7 LAMEA SOC as a Service Market by Country
- 10.4.7.1 Brazil SOC as a Service Market
- 10.4.7.1.1 Brazil SOC as a Service Market by Type
- 10.4.7.1.2 Brazil SOC as a Service Market by Vertical
- 10.4.7.1.3 Brazil SOC as a Service Market by Component
- 10.4.7.1.4 Brazil SOC as a Service Market by Offering Type
- 10.4.7.1.5 Brazil SOC as a Service Market by Organization Size
- 10.4.7.1.6 Brazil SOC as a Service Market by Application
- 10.4.7.2 Argentina SOC as a Service Market
- 10.4.7.2.1 Argentina SOC as a Service Market by Type
- 10.4.7.2.2 Argentina SOC as a Service Market by Vertical
- 10.4.7.2.3 Argentina SOC as a Service Market by Component
- 10.4.7.2.4 Argentina SOC as a Service Market by Offering Type
- 10.4.7.2.5 Argentina SOC as a Service Market by Organization Size
- 10.4.7.2.6 Argentina SOC as a Service Market by Application
- 10.4.7.3 UAE SOC as a Service Market
- 10.4.7.3.1 UAE SOC as a Service Market by Type
- 10.4.7.3.2 UAE SOC as a Service Market by Vertical
- 10.4.7.3.3 UAE SOC as a Service Market by Component
- 10.4.7.3.4 UAE SOC as a Service Market by Offering Type
- 10.4.7.3.5 UAE SOC as a Service Market by Organization Size
- 10.4.7.3.6 UAE SOC as a Service Market by Application
- 10.4.7.4 Saudi Arabia SOC as a Service Market
- 10.4.7.4.1 Saudi Arabia SOC as a Service Market by Type
- 10.4.7.4.2 Saudi Arabia SOC as a Service Market by Vertical
- 10.4.7.4.3 Saudi Arabia SOC as a Service Market by Component
- 10.4.7.4.4 Saudi Arabia SOC as a Service Market by Offering Type
- 10.4.7.4.5 Saudi Arabia SOC as a Service Market by Organization Size
- 10.4.7.4.6 Saudi Arabia SOC as a Service Market by Application
- 10.4.7.5 South Africa SOC as a Service Market
- 10.4.7.5.1 South Africa SOC as a Service Market by Type
- 10.4.7.5.2 South Africa SOC as a Service Market by Vertical
- 10.4.7.5.3 South Africa SOC as a Service Market by Component
- 10.4.7.5.4 South Africa SOC as a Service Market by Offering Type
- 10.4.7.5.5 South Africa SOC as a Service Market by Organization Size
- 10.4.7.5.6 South Africa SOC as a Service Market by Application
- 10.4.7.6 Nigeria SOC as a Service Market
- 10.4.7.6.1 Nigeria SOC as a Service Market by Type
- 10.4.7.6.2 Nigeria SOC as a Service Market by Vertical
- 10.4.7.6.3 Nigeria SOC as a Service Market by Component
- 10.4.7.6.4 Nigeria SOC as a Service Market by Offering Type
- 10.4.7.6.5 Nigeria SOC as a Service Market by Organization Size
- 10.4.7.6.6 Nigeria SOC as a Service Market by Application
- 10.4.7.7 Rest of LAMEA SOC as a Service Market
- 10.4.7.7.1 Rest of LAMEA SOC as a Service Market by Type
- 10.4.7.7.2 Rest of LAMEA SOC as a Service Market by Vertical
- 10.4.7.7.3 Rest of LAMEA SOC as a Service Market by Component
- 10.4.7.7.4 Rest of LAMEA SOC as a Service Market by Offering Type
- 10.4.7.7.5 Rest of LAMEA SOC as a Service Market by Organization Size
- 10.4.7.7.6 Rest of LAMEA SOC as a Service Market by Application
- 10.4.7.1 Brazil SOC as a Service Market
- 10.4.1 LAMEA SOC as a Service Market by Type
Chapter 11. Company Profiles
- 11.1 AT&T, Inc.
- 11.1.1 Company Overview
- 11.1.2 Financial Analysis
- 11.1.3 Segmental and Regional Analysis
- 11.1.4 Research & Development Expense
- 11.1.5 Recent strategies and developments:
- 11.1.5.1 Acquisition and Mergers:
- 11.2 IBM Corporation
- 11.2.1 Company Overview
- 11.2.2 Financial Analysis
- 11.2.3 Regional & Segmental Analysis
- 11.2.4 Research & Development Expenses
- 11.2.5 Recent strategies and developments:
- 11.2.5.1 Partnerships, Collaborations, and Agreements:
- 11.2.5.2 Acquisition and Mergers:
- 11.2.5.3 Geographical Expansions:
- 11.3 NTT Data Corporation
- 11.3.1 Company overview
- 11.3.2 Financial Analysis
- 11.3.3 Segmental Analysis
- 11.3.4 Research & Development Expense
- 11.3.5 Recent strategies and developments:
- 11.3.5.1 Partnerships, Collaborations, and Agreements:
- 11.3.5.2 Acquisition and Mergers:
- 11.3.5.3 Geographical Expansions:
- 11.3.6 SWOT Analysis
- 11.4 Verizon Communications, Inc.
- 11.4.1 Company Overview
- 11.4.2 Financial Analysis
- 11.4.3 Segmental Analysis
- 11.5 Cloudflare, Inc.
- 11.5.1 Company Overview
- 11.5.2 Financial Analysis
- 11.5.3 Regional Analysis
- 11.5.4 Research & Development Expense
- 11.5.5 Recent strategies and developments:
- 11.5.5.1 Partnerships, Collaborations, and Agreements:
- 11.5.5.2 Acquisition and Mergers:
- 11.6 Fortinet, Inc.
- 11.6.1 Company Overview
- 11.6.2 Financial Analysis
- 11.6.3 Regional Analysis
- 11.6.4 Research & Development Expenses
- 11.6.5 Recent strategies and developments:
- 11.6.5.1 Product Launches and Product Expansions:
- 11.6.5.2 Acquisition and Mergers:
- 11.7 Check Point Software Technologies Ltd.
- 11.7.1 Company Overview
- 11.7.2 Financial Analysis
- 11.7.3 Regional Analysis
- 11.7.4 Research & Development Expense
- 11.7.5 Recent strategies and developments:
- 11.7.5.1 Product Launches and Product Expansions:
- 11.8 Atos Group
- 11.8.1 Company Overview
- 11.8.2 Financial Analysis
- 11.8.3 Segmental Analysis
- 11.8.4 Recent strategies and developments:
- 11.8.4.1 Partnerships, Collaborations, and Agreements:
- 11.8.4.2 Geographical Expansions:
- 11.9 Tata Consultancy Services Ltd.
- 11.9.1 Company Overview
- 11.9.2 Financial Analysis
- 11.9.3 Segmental and Regional Analysis
- 11.9.4 Research & Development Expenses
- 11.9.5 Recent strategies and developments:
- 11.9.5.1 Product Launches and Product Expansions:
- 11.9.6 SWOT Analysis
- 11.10. Profico
- 11.10.1 Company Overview
- 11.10.2 Recent strategies and developments:
- 11.10.2.1 Partnerships, Collaborations, and Agreements:
- 11.10.2.2 Product Launches and Product Expansions: