|
|
市場調査レポート
商品コード
1234463
5Gローミング戦略:付加価値サービス・地域分析・市場予測 (2023-2027年)5G Roaming Strategies: Value-Added Services, Regional Analysis & Market Forecasts 2023-2027 |
||||||
|
|
|||||||


| 5Gローミング戦略:付加価値サービス・地域分析・市場予測 (2023-2027年) |
|
出版日: 2023年03月10日
発行: Juniper Research Ltd
ページ情報: 英文
納期: 即日から翌営業日
|
- 全表示
- 概要
- 目次
5Gローミング接続総数は2023年の5,300万から、2027年には5億2,600万に増加すると予測されています。この大幅な成長には、5G接続の普及に伴い、ローミング接続を自動識別できる新しいローミングツールの開発が必要とされています。
当レポートでは、世界の5Gローミングの市場を調査し、市場および技術の概要、市場成長への各種影響因子の分析、加入者数・トラフィック・収益の推移・予測、主要地域・国別の詳細分析、付加価値サービスの動向、主要企業の取り組み、競合情勢、将来の展望、戦略的提言などをまとめています。
調査パッケージの提供内容
- 市場動向・戦略(PDF)
- 競合企業リーダーボード(PDF)
- データ・予測(PDF&Excel)
- 5カ年市場規模・予測スプレッドシート (Excel)
- 12カ月のオンラインデータプラットフォームへのアクセス権
目次
1. 市場動向・戦略
第1章 重要ポイント・戦略的提言
第2章 今後の5Gローミング市場の展望
- イントロダクション・現在の市場の見通し
- 今後の市場の展望
第3章 地域分析
- 5Gローミングの地域分析
- 北米
- ラテンアメリカ
- 西欧
- 中欧・東欧
- 極東・中国
- インド亜大陸
- その他のアジア太平洋地域
- アフリカ・中東
第4章 付加価値サービスの評価
- ローミング付加価値サービス
- データと財務クリアリング
- GPX/IPX
- ローミングアナリティクス
- ローミングハブ
- スポンサーローミング
- ローミングステアリング
2. 競合企業リーダーボード
第1章 Juniper Researchの競合リーダーボード
第2章 ベンダープロファイル
- Telekom Austria Group
- BICS
- Cellusys
- Comfone
- Deutsche Telekom Global Carrier
- EMnify
- Etisalat Carrier and Wholesale
- iBASIS
- Mobileum
- Nextgen Clearing
- Syniverse
- Tata Communications
- Telefonica Global Solutions
- TOMIA
- Vodafone (ローミングサービス)
- Juniper Researchリーダーボードの評価調査手法
3. データ・予測
第1章 市場データ・将来の見通し
- 市場の状況
- 5Gローミングの総接続数
- 5Gデータローミングの総トラフィック
- 5Gローミングの総収益
第2章 5Gローミング加入者
- 5Gローミング加入者
- 予測手法・仮定
- 5Gモバイルローミングの総加入者
- ローミング加入者からの5Gデータトラフィック総計
- 5G加入者からのデータローミング総収益
第3章 消費者向けデバイス
- 5Gローミング消費者向けデバイス
- 予測手法・仮定
- 消費者向けデバイスによる5Gローミング総数
- 消費者向けデバイスの5Gローミングデータ使用量
- 消費者向けデバイスからの5Gローミング総収益
第4章 IoTデバイス&センサー
- 5Gローミング-IoTデバイスとセンサー
- 予測手法・仮定
- 5G IoT接続総数
- 5G IoT接続により生成されるデータローミングトラフィック総計
- 5G対応ローミングIoT接続からのローミング総収益
Juniper Research's latest 5G Roaming Strategies research offers an in-depth market segment analysis into the key market drivers, technologies and regions being innovated through the use of 5G networks for roaming services. This report provides tailored recommendations for market stakeholders in the competitive landscape, including mobile operators and roaming service providers, as well as four-year forecasts for key market verticals, such as mobile roaming subscribers, roaming consumer devices and IoT (Internet of Things) roaming.
Juniper Research's Competitor Leaderboard, featuring an in depth evaluation of 15 major roaming vendors, uses a combination of quantitative and qualitative scoring criteria to provide vendor positioning for the market's leading players.
In addition, the report suite contains a thorough region analysis of innovative applications; assessing 60 countries in 8 key regions on their readiness and market opportunities for the adoption of 5G roaming technology for the forecast period. This regional analysis leverages in-house forecast data for a range of key factors including for dedicated:
- Subscribers
- Subscriber Data Revenue
- Subscriber Voice Traffic
- Subscriber SMS Traffic
- 5G Cellular IoT Connections
- 5G IoT Roaming Data
- 5G IoT Roaming Revenue
This research suite includes:
- Market Trends & Strategies (PDF)
- Competitor Leaderboard (PDF)
- Data & Forecasting (PDF)
- 5-year Market Sizing & Forecast Spreadsheet (Excel)
- 12 Months' Access to harvest Online Data Platform
KEY FEATURES
- Regional Analysis: Comprehensive coverage featuring regional market analysis on the future of the market in a select 60 countries split by 8 key regions; analysing each region's full potential using the following criteria, paired with supplementary 5-year forecast data.
- Value-added Services Evaluation: The landscape overview assesses 5G influence on value-added roaming services and provides recommendations to operators and roaming service providers on how to utilise these value-added services to reduce key major factors affecting revenue leakage and maximise return on investment, including:
- Data & Financial Clearing
- GPX (GPS Exchange) & IPX (IP Exchange)
- Permanent Roaming
- Roaming Analytics
- Roaming Hubs
- Sponsored Roaming
- Steering of Roaming
- Juniper Research Competitor Leaderboard: Key player capability and capacity assessment for 15 roaming service providers; positioning them as either an established leader, leading challenger, or disruptor and challenger. Our Competitor Leaderboard scores these companies on a number of criteria including their size of operations in the space, their extent and breadth of market partnerships, sophistication of their platforms, and Juniper Research's view on each company's innovation and future business prospects. The companies included in Juniper Research's 5G Roaming Strategies Competitor Leaderboard are:
- A1 Telekom Austria Group
- BICS
- Cellusys
- Comfone
- Deutsche Telekom Carrier
- EMnify
- Etisalat Carrier & Wholesale
- iBASIS
- Mobileum
- Nextgen Clearing
- Syniverse
- Tata Communications
- Telefónica Global Solutions
- TOMIA
- Vodafone Roaming Services
- Benchmark Industry Forecasts: 5-year forecasts are provided for the market growth of 5G roaming connections and traffic, total data roaming revenue from 5G connections and total global roaming revenue. Metrics are split by our 8 key forecast regions and the 60 countries listed below:
- North America:
- Canada, US
- Latin America:
- Argentina, Brazil, Chile, Colombia, Ecuador, Mexico, Peru, Uruguay
- West Europe:
- Austria, Belgium, Denmark, Finland, France, Germany, Greece, Ireland, Italy, Netherlands, Norway, Portugal, Spain, Sweden, Switzerland, UK
- Central & East Europe:
- Croatia, Czech Republic, Hungary, Poland, Romania, Russia, Turkey, Ukraine
- Far East & China:
- China, Hong Kong, Japan, South Korea
- Indian Subcontinent:
- Bangladesh, India, Nepal, Pakistan
- Rest of Asia Pacific:
- Australia, Indonesia, Malaysia, New Zealand, Philippines, Singapore, Thailand, Vietnam
- Africa & Middle East:
- Algeria, Egypt, Israel, Kenya, Kuwait, Nigeria, Qatar, Saudi Arabia, South Africa, United Arab Emirates
KEY QUESTIONS ANSWERED
- 1. What is driving the development of 5G-enabled value-added services within the roaming market?
- 2. How will the increasing usage of 5G connectivity impact the roaming market?
- 3. How does the increased quality of 5G roaming data connections impact roaming vendors?
- 4. What impact will 5G have on roaming and permanently roaming IoT connections?
- 5. Which vendors have the largest market share in 5G roaming?
COMPANIES REFERENCED
- Interviewed: Cellusys, Mobileum, Tata Communications, TOMIA.
- Case Studied: SecurityGen.
- Included in Juniper Research Competitor Leaderboard: A1 Telekom Austria Group, BICS, Cellusys, Comfone, Deutsche Telekom Global Carrier, EMnify, Etisalat C&WS, iBASIS, Mobilieum, Nextgen Clearing, Syniverse, Tata Communications, Telefónica Global Solutions, TOMIA, Vodafone Roaming Services.
- Mentioned: 2 Degrees Mobile, 3m Digital Networks Pvt Ltd, Able Device, Accenture, AiRXOS, AIS, Alberici, Algar, Alibaba Group, Altice DR, AMEEX, América Móvil, Amplitiv, Arbor, Arelion, AT&T, Athonet, AtmoTrack, Audax Private Equity, AWS, BAE, BASE, Bell Canada, Blackbird, Bouygues, Bouygues Telecom, Celcom Axiata, Cell C, Cellcom Golan Marathon, ChargeX, China Broadnet, China Telecom, China Unicom, ciena, Cisco, Clarity, Claro, CNT (Corporación Nacional de Telecommunicaciones), Colombia WB Hots, Cosmote, DellEMC, Developing Solutions, devicepilot, Digi Telecommunications, Digicel Pacific Group, Digis Squared, Digitalparking, DISH Wireless, DITO Communications, Djezzy, DNA, DNB (Digital Nasional Berhad), DTAC, Eastlink, Eclat Media Group, EcoWaste, EE, Egypt Telecom, EI (Evolved Intelligence), Eir, Elisa, Enacom, Epic, Ericsson, Eseye, ETB, ev.energy, Eval&Go, Explosion Power, Fastweb, Federated Wireless, Fischer Akkumulatorentechnik, Flo.live, Fortinet, Free, Fujitsu, GCC (Gulf Cooperation Council), GCI, Genesys, Global Play, Globe, Globe Communications, GMS, GoHome GPS, Google, H.I.G Technology Partners, Hewlett Packard Enterprise, Hidroconta, HKT, Hong Kong Telecom, Hoots Classic, Horisen, Hot Mobile, Hrvatski Telecom , HT, Huawei, Hutchinson Group, Hutchison Indonesia, IBM, Ice, Iliad, Infobip, Innovmobile, Invitech ICT Services, JIGSAW, Jio, JT Group, Kairos Geolocalisation, Kore.ai, KPN, KT Corporation, LG U+, Linkem Group, Lohr Industries, Lufthansa, Lumine Group, LUXE.TV, Lynk, Mada, Magenta Telekom, Magyar Telekom , Maroc Telecom, Marvell, Maxis, MEO, metr, Microsoft, Mobilis, Mobily, Mobius, Moov, MotoGP, MTC, MTN, Nanti Systems, NEC, Nokia, Nordic, NOS, NOVA, Nuuday, O2, oee.ai, OIV, OneWeb, Ooredoo, OpNet, Optus, Oracle, Orange Group, OSC Top Solutions Group, Partitionware, Partner, PCCW Global, Pelephone, Personal , PiCo, Play, PLDT, Plivo, Plus, Polkomtel, Primagaz, Proximus Group, PTCL, QRoam, Qualcomm Technologies, Rain, Ribbon, Roamability, RoamSmart, RoamsysNext, Rogers, Rostelecom, SailGP, Salesforce, Salt, SAMA, Samsung, SaskTel, Sateliot, Segron, Sensoneo, Sequans Communications, SFR, Sharemac, Sigos, Simfony, Siminn, Sippio, SK Telecom, Sky, Smart Communications, Smartfren Telekom Tbk, Smartisland, Solarly, Spark, Sparkle, ST life.augmented, Starhub, STC, Sunrise, Swisscom, Symestic, Syrinix, Tata Communications, TDC, Tele2 Group, Telecom Italia, Telekom Malaysia, Telekom Slovenije, Telemach, Telenet, Telenor, Telesat, Teletalk, Telia Company, Telstra, Telus, Thales, Three, Tigo, TIM, TM (Telekom Malaysia Berhad), T-Mobile, TNS, Tofane Global, TOT Pcl, True MoveH, TT Network, U Mobile, Ufone, Umlaut, Union Wireless, Unitel, urban.io, US Cellular, VEON, Verizon, Videotron, VimpelCom, Vivo, Vodacom, VoerEir, Volaris Group, Walleye, Webe, WeDo Technologies, Wind, WOM, XConnect, Xintec, Xplornet, Yoigo, YouSee, YTL Communications, Zain, Zscaler, ZTE.
DATA & INTERACTIVE FORECAST
- 5G Roaming Strategies Market Summary, including:
- Total 5G Roaming Connections
- Total 5G Data Roaming Traffic
- Total Data Roaming Revenue from 5G Connections
- Total Global Roaming Revenue
- Data Splits for Total Traffic, Revenue and Potential Revenue Loss are also provided for the following markets:
- 5G Roaming Subscribers
- Further split by Voice, SMS and Data traffic
- 5G Roaming Consumer Devices
- 5G Roaming Tablets
- 5G Roaming Laptops & Notebooks
- 5G Consumer Wearables
- 5G IoT Roaming Connections
- Geographical splits: 60 countries
- Number of tables: 98 tables
- Number of datapoints: Over 44,600 datapoints
harvest: Our online data platform, harvest, contains the very latest market data and is updated throughout the year. This is a fully featured platform enabling clients to better understand key data trends and manipulate charts and tables; overlaying different forecasts within the one chart - using the comparison tool. Empower your business with our market intelligence centre, and receive alerts whenever your data is updated.
Interactive Excels (IFxl): Our IFxl tool enables clients to manipulate both forecast data and charts, within an Excel environment, to test their own assumptions using the interactive scenario tool and compare selected markets side by side in customised charts and tables. IFxls greatly increase a client's ability to both understand a particular market and to integrate their own views into the model.
FORECAST SUMMARY
Juniper Research has found that the total number of 5G roaming connections will increase from 53 million in 2023 to 526 million by 2027. This substantial growth will require the development of new roaming tools that are able to autonomously identify roaming connections as 5G connectivity proliferates. Juniper Research identified AI-based real-time analytics and roaming fraud mitigation services as two critical solutions that will enable operators to protect their networks against an influx of data traffic from roaming subscribers.
- Juniper Research predicted that amidst the growth of 5G roamers, emerging traffic analytics and anti-fraud solutions must enable the enhanced identification and authentication of roaming connections over 5G networks. However, given the increased complexity of 5G networks, Juniper Research anticipated current roaming analytics services will be insufficient in monitoring 5G roaming connections, and the subsequent increase in mobile roaming data.
- To maximise the benefits from these new 5G roaming services, operators must invest in 5G NGCs (Next-generation Cores), which are highly virtualised and can more efficiently assess traffic and connectivity. By deploying NGCs, roaming vendors can better protect networks' processing power and signalling capabilities amidst rising levels of roaming data consumption. This will ensure a continuous level of service essential to attracting high-spending enterprise customers.
- Additionally, Juniper Research predicted that 5G NGCs will be imperative to enabling operators to handle the growth of data from roaming subscribers, forecasting that 5G data roaming traffic will rise by 3,500% over the next four years.
- An inability to detect roaming connections that use valuable network bandwidth risks diminishing the user experience for the operator's own subscribers. To maintain high-quality services for their subscribers, operators must invest in roaming solutions that can efficiently identify roaming connections that consume large amounts of cellular data.
Table of Contents
1. Market Trends & Strategies
1. Key Takeaways & Strategic Recommendations
- 1.1 Key Takeaways
- 1.2. Strategic Recommendations
2. Future Market Outlook for 5G Roaming
- 2.1. Introduction & Current Market Outlook
- Figure 2.1: 5G Network Opportunities
- Figure 2.2: Total 5G Roaming Connections (m), Split by Device, 2023-2027
- Figure 2.3: Total SIM Connections (m), Split by Network, 2019-2027
- i. Impacts of COVID-19
- Figure 2.4: Total Number of Airline eTickets or Boarding Passes Issued per annum (m), Split by 8 Key Regions, 2019-2027
- Figure 2.5: Total Number of Mobile Roaming Subscribers on 5G Subscriptions (m), Split by 8 Key Regions, 2023-2027
- 2.2. Future Market Outlook
- Figure 2.6: Total 5G Roaming Connections (m), Split by Device, 2023-2027
- i. Impacts of the Chip Shortage
- ii. Ban of Huawei Infrastructure
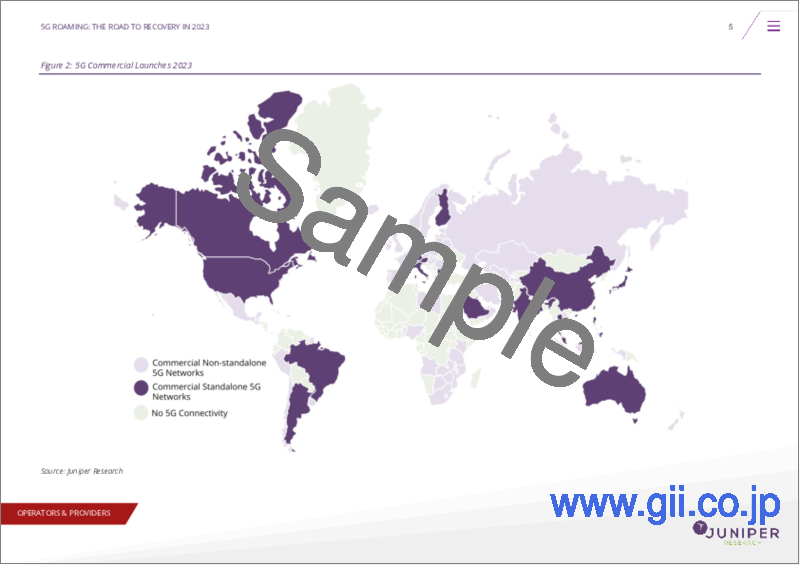
- 2.2.2. Commercial Launched of 5G SA Networks
- Figure 2.7: 5G Commercial Launches 2023
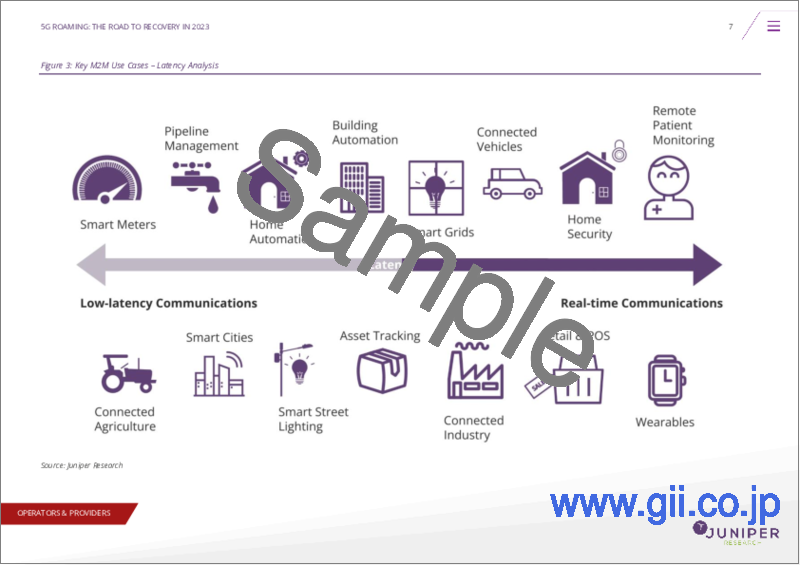
- 2.2.3. Growth of IoT Connectivity
- Figure 2.8: Key M2M Use Cases - Latency Analysis
- 2.2.4. Permanent Roaming
- Figure 2.9: Proportion of Cellular IoT Connections That Leverage 5G Networks (%), Split by 8 Key Regions, 2023-2027
- 2.2.5. Roaming Regulations
- i. RLAH
- ii. Security
- 2.2.6. VoLTE Roaming
3. Regional Analysis
- 3.1. 5G Roaming Regional Analysis
- Table 3.1: Juniper Research 5G Roaming Strategies: Regional Analysis Scoring Criteria
- Figure 3.2: Juniper Research's Competitive Web: 5G Roaming Strategies Regional Opportunities
- Table 3.3: Juniper Research 5G Roaming Regional Analysis Heatmap: North America
- Table 3.4: Juniper Research 5G Roaming Regional Analysis Heatmap: Latin America
- Table 3.5: Juniper Research 5G Roaming Regional Analysis Heatmap: West Europe
- Table 3.6: Juniper Research 5G Roaming Regional Analysis Heatmap: Central East Europe
- Table 3.7: Juniper Research 5G Roaming Regional Analysis Heatmap: Far East China
- Table 3.8: Juniper Research 5G Roaming Regional Analysis Heatmap: Indian Subcontinent
- Table 3.9: Juniper Research 5G Roaming Regional Analysis Heatmap: Rest of Pacific
- Table 3.10: Juniper Research 5G Roaming Regional Analysis Heatmap: Africa Middle East
- 3.2. North America
- Figure 3.11: Total Number of Mobile Roaming Subscribers on 5G Subscriptions in North America (m), 2023-2027
- i. US
- Table 3.12: Commercial 5G Launches in the US
- ii. Canada
- Table 3.13: Commercial 5G Launches in Canada
- 3.3. Latin America
- Figure 3.14: Total 5G Roaming Connections in Latin America (m), 2023-2027
- i. Argentina
- ii. Brazil
- Table 3.15: 5G Commercial Launches in Brazil
- iii. Chile
- Table 3.16: 5G Commercial Launches in Chile
- iv. Colombia
- v. Ecuador
- vi. Mexico
- Table 3.17: 5G Commercial Launches in Mexico
- vii. Peru
- Table 3.19: 5G Commercial Launches in Peru
- viii. Uruguay
- Figure 3.20. Proportion of Mobile Roaming Subscribers on 5G Subscriptions in Latin America (%), 2023-2027
- 3.4. West Europe
- Figure 3.21: Proportion of Mobile Roaming Subscribers on 5G Subscriptions in West Europe (%), 2023-2027
- i. Austria
- Table 3.22: Commercial 5G Launches in Austria
- ii. Belgium
- Table 3.23: 5G Commercial Launches in Belgium
- iii. Denmark
- Table 3.24: 5G Commercial Launches in Denmark
- iv. Finland
- Table 3.25: 5G Commercial Launches in Finland
- v. France
- Table 3.26: 5G Commercial Launches in France
- vi. Germany
- Table 3.27: 5G Commercial Launches in Germany
- vii. Greece
- Table 3.28: 5G Commercial Launches in Greece
- viii. Ireland
- ix. Italy
- Table 3.29: 5G Commercial Launches in Italy
- x. Netherlands
- xi. Norway
- Table 3.30: 5G Commercial Launches in Norway
- xii. Portugal
- xiii. Spain
- Table 3.31: 5G Commercial Launches in Spain
- xiv. Sweden
- Table 3.32: 5G Commercial Launches in Sweden
- xv. Switzerland
- xvi. UK
- Table 3.33: 5G Commercial Launches in the UK
- 3.5. Central & East Europe
- Figure 3.34: Total Number of Mobile Roaming Subscribers on 5G Subscriptions in Central & East Europe (m), 2023-2027
- i. Croatia
- Table 3.35: 5G Commercial Launches in Croatia
- ii. Czech Republic
- Table 3.36: 5G Commercial Launches in the Czech Republic
- iii. Hungary
- iv. Poland
- Table 3.37: 5G Commercial Launches in Poland
- v. Romania
- vi. Russia
- vii. Turkey
- viii. Ukraine
- 3.5.2. Far East & China
- Figure 3.38: Total Number of Mobile Roaming Subscribers on 5G Subscriptions in Far East & China (m), 2023-2027
- i. China
- Table 3.39: 5G Commercial Launches in China
- ii. Hong Kong
- iii. Japan
- iv. South Korea
- Table 3.40: 5G Commercial Launches in South Korea
- 3.5.3. Indian Subcontinent
- i. Bangladesh
- ii. India
- Table 3.41: 5G Commercial Launches in India
- iii. Nepal
- iv. Pakistan
- 3.5.4. Rest of Asia Pacific
- Figure 3.42: Proportion of Mobile Roaming Subscribers on 5G Subscriptions in Select Countries in Rest of Asia Pacific (%), 2023-2027
- i. Australia
- Table 3.43: 5G Commercial Launches in Australia
- ii. Indonesia
- Figure 3.44: Total 5G Mobile Connections in Rest of Asia Pacific (m), 2023-2027
- iii. Malaysia
- iv. New Zealand
- v. Philippines
- Table 3.45: 5G Commercial Launches in the Philippines
- vi. Singapore
- vii. Thailand
- Table 3.46: 5G Commercial Launched in Thailand
- viii. Vietnam
- 3.5.5. Africa & Middle East
- Figure 3.47: Total Global Roaming Revenue in Africa & Middle East ($m), 2023-2027
- i. Algeria
- ii. Egypt
- iii. Israel
- Table 3.48: 5G Commercial Launches in Israel
- iv. Kenya
- v. Nigeria
- vi. Qatar
- vii. Saudi Arabia
- viii. South Africa
- Table 3.49: 5G Commercial Launches in South Africa
- ix. United Arab Emirates
4. Value-added Services Assessment
- 4.1. Roaming Value-added Services
- 4.1.1. Data & Financial Clearing
- Figure 4.1: Driving Factors & Limitations of the GSMA's BCE Protocol
- i. Blockchain for Roaming
- 4.1.2. GPX/IPX
- 4.1.3. Roaming Analytics
- 4.1.4. Roaming Hubs
- 4.1.5. Sponsored Roaming
- 4.1.6. Steering of Roaming
- 4.1.1. Data & Financial Clearing
2. Competitor Leaderboard
1. Juniper Research Competition Leaderboard
- 1.1. Why Read This Report
- Table 1.1: Juniper Research Competitor Leaderboard Vendor Solutions: 5G Roaming
- Figure 1.2: Juniper Research Competitor Leaderboard: 5G Roaming Strategies
- Table 1.3: Juniper Research Competitor Leaderboard: Vendors & Positioning
- Table 1.4: Juniper Research Competitor Leaderboard Heatmap: 5G Roaming Vendors
2. Vendor Profiles
- 2.1.1. A1. Telekom Austria Group
- i. Corporate Information
- ii. Geographical Spread
- iii. Key Clients & Strategic Partnerships
- iv. High-level View of Offerings
- v. Juniper Research's View: Key Strengths & Strategic Opportunities
- 2.1.2. BICS
- i. Corporate Information
- Table 2.1: BICS' Select Financial Information ($m), 2020-2021
- ii. Geographical Spread
- iii. Key Clients & Strategic Partnerships
- iv. High-level View of Offerings
- v. Juniper Research's View: Key Strengths & Strategic Opportunities
- i. Corporate Information
- 2.1.3. Cellusys
- i. Corporate Information
- ii. Geographical Spread
- iii. Key Clients & Strategic Partnerships
- iv. High-level View of Offerings
- v. Juniper Research's View: Key Strengths & Strategic Opportunities
- 2.1.4. Comfone
- i. Corporate Information
- ii. Geographical Spread
- iii. Key Clients & Strategic Partnerships
- iv. High-level View of Offerings
- Figure 2.2: Comfone's Key2roam Hub Coverage Map
- v. Juniper Research's View: Key Strengths & Strategic Opportunities
- 2.1.5. Deutsche Telekom Global Carrier
- i. Corporate Information
- Table 2.3: Deutsche Telekom Group Select Financial Information ($bn), 2019-2021
- ii. Geographical Spread
- iii. Key Clients & Strategic Partnerships
- iv. High-level View of Offerings
- v. Juniper Research's View: Key Strengths & Strategic Opportunities
- i. Corporate Information
- 2.1.6. EMnify
- i. Corporate Information
- ii. Geographical Spread
- iii. Key Clients & Strategic Partnerships
- iv. High-level View of Offerings
- v. Juniper Research's View: Key Strengths & Strategic Opportunities
- 2.1.7. Etisalat Carrier and Wholesale
- i. Corporate Information
- ii. Geographical Spread
- iii. Key Clients & Strategic Partnerships
- iv. High-level View of Offerings
- v. Juniper Research's View: Key Strengths & Strategic Opportunities
- 2.1.8. iBASIS
- i. Corporate Information
- ii. Geographical Spread
- iii. Key Clients & Strategic Partnerships
- iv. High-level View of Offerings
- Figure 2.4: IBASIS Product Portfolio
- Figure 2.5: iBASIS' 5G Roaming Infrastructure
- v. Juniper Research's View: Key Strengths & Strategic Opportunities
- 2.1.9. Mobileum
- i. Corporate Information
- ii. Geographical Spread
- iii. Key Clients & Strategic Partnerships
- iv. High-level View of Offerings
- Figure 2.6: Mobileum's Roaming Management Suite
- v. Juniper Research's View: Key Strengths & Strategic Opportunities
- 2.1.10. Nextgen Clearing
- i. Corporate Information
- ii. Geographical Spread
- iii. Key Client & Strategic Partnerships
- iv. High-level View of Offerings
- v. Juniper Research's View: Key Strengths & Strategic Opportunities
- 2.1.11. Syniverse
- i. Corporate Information
- Table 2.7: Syniverse's Select Financial Information, ($m), 2020-2021
- ii. Geographical Spread
- iii. Key Clients & Strategic Partnerships
- iv. High-level View of Offerings
- Figure 2.8: Syniverse's Clearing and Settlement Services
- v. Juniper Research's View: Key Strengths & Strategic Opportunities
- i. Corporate Information
- 2.1.12. Tata Communications
- i. Corporate Information
- Table 2.9: Tata Communications' Select Financial Information ($m), 2020-2022
- ii. Geographical Spread
- iii. Key Clients & Strategic Partnerships
- iv. High-level View of Offerings
- Figure 2.10: Tata Communications' IPX+ Infrastructure
- v. Juniper Research's View: Key Strengths & Strategic Opportunities
- i. Corporate Information
- 2.1.13. Telefónica Global Solutions
- i. Corporate Information
- Table 2.11: Telefónica's Select Financial Information (€bn), 2020-2022
- ii. Geographical Spread
- iii. Key Clients & Strategic Partnerships
- iv. High-level View of Offerings
- Figure 2.12: Telefónica's 5G Roaming Suite
- v. Juniper Research's View: Key Strengths & Strategic Opportunities
- i. Corporate Information
- 2.1.14. TOMIA
- i. Corporate Information
- ii. Geographical Spread
- iii. Key Clients & Strategic Partnerships
- iv. High-level View of Offerings
- v. Juniper Research's View: Key Strengths & Strategic Opportunities
- 2.1.15. Vodafone (Roaming Services)
- i. Corporate Information
- ii. Geographical Spread
- iii. Key Clients & Strategic Partnerships
- iv. High-level View of Offerings
- Table 2.13: Vodafone's Global Signalling & IPX Connectivity
- v. Juniper Research's View: Key Clients & Strategic Opportunities
- 2.2. Juniper Research Leaderboard Assessment Methodology
- 2.2.1. Limitations & Interpretations
- Table 2.14: Juniper Research Competitor Leaderboard Scoring Criteria
- 2.2.1. Limitations & Interpretations
3. Data & Forecasting Table of Contents
1. Market Data & Future Outlook
- 1.1. Market Status
- Figure 1.1: Total Data Roaming Revenue from 5G Roaming in 2023 ($m), Split by Device
- 1.1.1. Total 5G Roaming Connections
- Figure & Table 1.2: Total 5G Roaming Connections (m), Split by 8 Key Regions, 2022-2027
- Table 1.3: Total 5G Roaming Connections (m), Split by Device, 2022-2027
- 1.1.2. Total 5G Data Roaming Traffic
- Figure & Table 1.4: Total 5G Data Roaming Traffic (PB), Split by 8 Key Regions, 2022-2027
- Table 1.5: Total 5G Data Roaming Traffic (PB), Split by Device, 2022-2027
- 1.1.3. Total 5G Roaming Revenue
- Figure & Table 1.6: Total Data Revenue from 5G Roaming Connections ($m), Split by 8 Key Regions, 2022-2027
2. 5G Roaming Subscribers
- 2.1. 5G Roaming Subscribers
- Figure 2.1: Proportion of Mobile Roaming Subscribers on 5G Subscriptions (%), Split by 8 Key regions, 2023-2027
- 2.1.1. Forecast Methodology & Assumptions
- Figure 2.2: 5G Roaming Subscribers Forecast Methodology
- 2.1.2. Total 5G Mobile Roaming Subscribers
- Figure & Table 2.3: Total Number of Mobile Roaming Subscribers on 5G Subscriptions (m), Split by 8 key Regions, 2022-2027
- Table 2.4: Proportion of 5G Roaming Subscribers Leveraging 5G Roaming Services (%), Split by Service, 2022-2027
- 2.1.3. Total 5G Data Traffic from Roaming Subscribers
- Figure & Table 2.5: Total Roaming Data Traffic from 5G Roaming Subscribers (PB), Split by 8 key Regions, 2022-2027
- 2.1.4. Total Data Roaming Revenue from 5G Subscribers
- Figure & Table 2.6: Total Data Roaming Revenue from 5G Roaming Subscribers ($m), Split by 8 Key Regions, 2022-2027
- Table 2.7: Average Revenue per 5G Mobile Roaming Subscriber ($), Split by 8 Key Regions, 2022-2027
3. Consumer Devices
- 3.1. 5G Roaming Consumer Devices
- Figure 3.1: Total Number of 5G Consumer Devices That Are Roaming in 2023 (m), Split by 8 Key Regions: 103,000
- 3.1.1. Forecast Methodology & Assumptions
- Figure 3.2: 5G Roaming Consumer Devices Forecast Methodology
- 3.1.2. Total Number of 5G Roaming Consumer Devices
- Figure & Table 3.3: Total Number of 5G Roaming Consumer Devices (m), Split by 8 Key Geographical Regions, 2022-2027
- Table 3.4: Total 5G Roaming Consumer Devices (m), Split by Device, 2022-2027
- 3.1.3. Total 5G Consumer Device Roaming Data Usage
- Figure & Table 3.5: Total 5G Consumer Device Data Usage Whilst Roaming (PB), Split by 8 Key, 2022-2027
- Table 3.6: Average Data Generated per 5G Roaming Consumer Device (PB), Split by Device, 2022-2027
- 3.1.4. Total Roaming Revenue from 5G Consumer Devices
- Figure & Table 3.7: Total Roaming Revenue from 5G Consumer Device Connections ($m), Split by 8 Key Regions, 2022-2027
- Table 3.8: Total Roaming Revenue from 5G Consumer Device Connections ($m), Split by Device, 2022-2027
4. IoT Devices & Sensors
- 4.1. 5G Roaming - IoT Devices and Sensors
- Figure 4.1: Total Number of Cellular IoT Connections (m), Split by 8 Key Regions, 2022-2027
- 4.1.1. Forecast Methodology & Assumptions
- Figure 4.2: 5G Roaming IoT Devices and Sensor Forecast Methodology
- 4.1.2. Total 5G IoT Connections
- Figure & Table 4.3: Total Number of Cellular 5G IoT Connections (m), Split by Ky Regions, 2022-2027
- 4.1.3. Total Data Roaming Traffic Generated by 5G-enabled IoT Connections
- Figure & Table 4.4: Total Data Generated by 5G-enabled Roaming IoT Connections (PB), Split by 8 Key Regions, 2022-2027
- 4.1.4. Total Roaming Revenue from 5G-enabled Roaming IoT Connections
- Figure & Table 4.5: Total Roaming Revenue from 5G-enabled Roaming IoT Connections ($m), Split by 8 Key Regions, 2022-2027
- Table 4.6: Average Revenue per GB of Roaming Data Generated from 5G IoT Connections ($), Split by 8 Key Regions, 2022-2027