 |
市場調査レポート
商品コード
1397838
レアアース金属市場:タイプ別、用途別、2023~2030年世界予測Rare-Earth Metals Market by Type (Cerium Oxide, Dysprosium Oxide, Europium Oxide), Application (Catalysts, Ceramics, Glass Additives) - Global Forecast 2023-2030 |
||||||
● お客様のご希望に応じて、既存データの加工や未掲載情報(例:国別セグメント)の追加などの対応が可能です。 詳細はお問い合わせください。

| レアアース金属市場:タイプ別、用途別、2023~2030年世界予測 |
|
出版日: 2023年12月01日
発行: 360iResearch
ページ情報: 英文 186 Pages
納期: 即日から翌営業日
|
- 全表示
- 概要
- 図表
- 目次
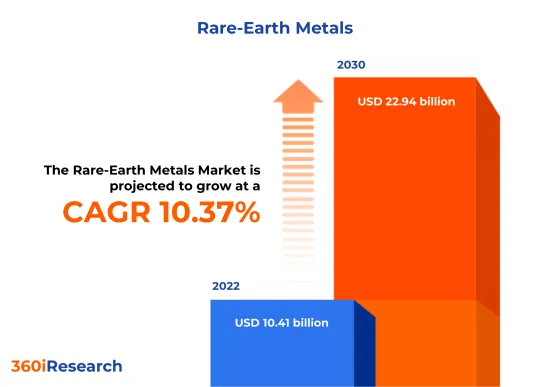
レアアース金属市場は、2022年の104億1,000万米ドルから2030年には229億4,000万米ドルに達すると予測され、予測期間中のCAGRは10.37%です。
レアアース金属の世界市場
| 主な市場の統計 | |
|---|---|
| 基準年[2022年] | 104億1,000万米ドル |
| 予測年[2023年] | 113億4,000万米ドル |
| 予測年[2030年] | 229億4,000万米ドル |
| CAGR(%) | 10.37% |
FPNVポジショニングマトリックス
FPNVポジショニングマトリックスはレアアース金属市場の評価に不可欠なツールです。事業戦略と製品満足度に関連する主要指標を分析し、ベンダーを包括的に評価します。これにより、ユーザーは特定のニーズに合わせた情報に基づいた意思決定を行うことができます。高度な分析により、ベンダーは4つの象限に分類され、それぞれ成功のレベルが異なります:フォアフロント(F)、パスファインダー(P)、ニッチ(N)、バイタル(V)です。洞察により、意思決定者は自信を持って市場をナビゲートすることができます。
市場シェア分析
市場シェア分析では、ベンダーの市場情勢に関する貴重な洞察を提供します。全体収益、顧客ベース、その他の主要指標への影響を評価することで、企業の業績と直面する競合環境を包括的に理解することができます。この分析では、調査期間中の市場シェア獲得、断片化、優位性、業界再編などの競合レベルも明らかにします。
本レポートは以下の側面について貴重な洞察を提供しています:
1-市場の浸透度:主要企業の市場力学と製品に関する包括的な情報を提供します。
2-市場の開拓度:新興市場と成熟市場セグメントへの浸透を詳細に分析し、有利なビジネスチャンスを浮き彫りにします。
3-市場の多様化:新製品発売、未開拓地域、最近の開発、投資に関する詳細情報。
4-競合の評価と情報:主要企業の市場シェア、戦略、製品、認証、規制状況、特許状況、製造能力を網羅的に評価。
5-製品開発とイノベーション:将来の技術、研究開発活動、画期的な製品開発に関する知的洞察。
本レポートは、以下のような主要な質問に対応しています:
1-レアアース金属市場の市場規模と予測は?
2-レアアース金属市場で最も高い投資ポテンシャルを持つ製品、セグメント、アプリケーション、分野は?
3-レアアース金属市場における競争戦略枠組みとは?
4-レアアース金属市場の最新技術動向と規制枠組みは?
5-レアアース金属市場における主要ベンダーの市場シェアは?
6-レアアース金属市場への参入に適した形態や戦略的手段は?
目次
第1章 序文
第2章 調査手法
第3章 エグゼクティブサマリー
第4章 市場概要
第5章 市場洞察
- 市場力学
- 促進要因
- 世界中でクリーンエネルギーソリューションへの世界のシフトが加速
- レアアースメタルの採掘と生産を促進する政府の取り組み
- 家庭用電化製品と高度な兵器システムの急速な開発と進歩
- 抑制要因
- 入手可能なレアアース金属と採掘に伴う困難
- 機会
- 新しい抽出技術を開発するための継続的な研究開発活動
- レアアースメタルの持続可能な開発とリサイクルが重視され始めている
- 課題
- レアアース金属の抽出技術に関連する環境問題
- 促進要因
- 市場セグメンテーション分析
- タイプ:半導体製造における酸化セリウムの使用の拡大
- 用途:製造業の拡大に伴う合金の消費量の増加
- 市場動向分析
- 政府の支援と探査・生産プロセスの技術進歩に支えられたアメリカ地域の大きな成長の可能性
- 市場におけるこの地域の世界の地位を拡大するための政府資金の支援を受けて、アジア太平洋におけるレアアース金属の生産と埋蔵スペースを独占
- 欧州、中東、アフリカ全体の最終用途産業からの需要を満たすため、責任ある調達とレアアース金属の調達を促進する取り組みを拡大
- 高インフレの累積的影響
- ポーターのファイブフォース分析
- バリューチェーンとクリティカルパス分析
- 規制の枠組み
第6章 レアアース金属市場:タイプ別
- イントロダクション
- 酸化セリウム
- 酸化ジスプロシウム
- 酸化ユーロピウム
- 酸化ガドリニウム
- 酸化ランタン
- 酸化ネオジム
- 酸化プラセオジム
- 酸化サマリウム
- 酸化テルビウム
- 酸化イットリウム
第7章 レアアース金属市場:用途別
- イントロダクション
- 触媒
- セラミックス
- ガラス添加剤
- ガラス研磨
- 金属合金
- 永久磁石
- 蛍光体
第8章 南北アメリカのレアアース金属市場
- イントロダクション
- アルゼンチン
- ブラジル
- カナダ
- メキシコ
- 米国
第9章 アジア太平洋のレアアース金属市場
- イントロダクション
- オーストラリア
- 中国
- インド
- インドネシア
- 日本
- マレーシア
- フィリピン
- シンガポール
- 韓国
- 台湾
- タイ
- ベトナム
第10章 欧州・中東・アフリカのレアアース金属市場
- イントロダクション
- デンマーク
- エジプト
- フィンランド
- フランス
- ドイツ
- イスラエル
- イタリア
- オランダ
- ナイジェリア
- ノルウェー
- ポーランド
- カタール
- ロシア
- サウジアラビア
- 南アフリカ
- スペイン
- スウェーデン
- スイス
- アラブ首長国連邦
- 英国
第11章 競合情勢
- FPNVポジショニングマトリクス
- 市場シェア分析:主要企業別
- 競合シナリオ主要企業別の分析
- 合併・買収
- 契約、コラボレーション、パートナーシップ
- 投資、資金調達
- 受賞・表彰・拡大
第12章 競合ポートフォリオ
- 主要な企業プロファイル
- ABx Limited
- Alkane Resources Ltd.
- Aluminium Corporation of China Limited
- American Elements
- American Rare Earths Limited
- Arafura Resources Ltd.
- Australian Rare Earths Limited
- Avalon Advanced Materials Inc.
- Canada Rare Earth Corporation
- China Non-ferrous Metal Industry's Foreign Engineering and Construction Co., Ltd.
- China Northern Rare Earth(Group)High-Tech Co., Ltd.
- China Rare Earth Group Resources Technology Co., Ltd.
- China Rare Earth Holdings Limited
- Encounter Resources Limited
- Energy Fuels Inc.
- Energy Transition Minerals Ltd.
- Enova Mining Limited
- Eutectix, LLC
- Frontier Rare Earths
- Fujian Changting Golden Dragon Rare-Earth Co., Ltd.
- GTS German Trading Service GmbH
- Hebei Suoyi New Material Technology Co., Ltd.
- HEFA Rare Earth Canada Ltd.
- Iluka Resources Limited
- JL MAG Rare-Earth Co., Ltd.
- Krakatoa Resources Ltd.
- Lynas Malaysia Sdn Bhd
- Medallion Resources Ltd.
- Mitsubishi Corporation RtM Japan Ltd.
- MP Materials Corp.
- Neo Performance Materials
- NioCorp Development Ltd.
- Norwegian company REEtec
- Otto Chemie Pvt. Ltd.
- Rare Element Resources Ltd.
- Shin-Etsu Chemical Co., Ltd.
- Solvay SA
- Texas Mineral Resources Corp.
- Ucore Rare Metals Inc.
- 主要な製品ポートフォリオ
第13章 付録
- ディスカッションガイド
- ライセンスと価格について
LIST OF FIGURES
- FIGURE 1. RARE-EARTH METALS MARKET RESEARCH PROCESS
- FIGURE 2. RARE-EARTH METALS MARKET SIZE, 2022 VS 2030
- FIGURE 3. RARE-EARTH METALS MARKET SIZE, 2018-2030 (USD MILLION)
- FIGURE 4. RARE-EARTH METALS MARKET SIZE, BY REGION, 2022 VS 2030 (%)
- FIGURE 5. RARE-EARTH METALS MARKET SIZE, BY REGION, 2022 VS 2023 VS 2030 (USD MILLION)
- FIGURE 6. RARE-EARTH METALS MARKET DYNAMICS
- FIGURE 7. RARE-EARTH METALS MARKET SIZE, BY TYPE, 2022 VS 2030 (%)
- FIGURE 8. RARE-EARTH METALS MARKET SIZE, BY TYPE, 2022 VS 2023 VS 2030 (USD MILLION)
- FIGURE 9. RARE-EARTH METALS MARKET SIZE, BY APPLICATION, 2022 VS 2030 (%)
- FIGURE 10. RARE-EARTH METALS MARKET SIZE, BY APPLICATION, 2022 VS 2023 VS 2030 (USD MILLION)
- FIGURE 11. AMERICAS RARE-EARTH METALS MARKET SIZE, BY COUNTRY, 2022 VS 2030 (%)
- FIGURE 12. AMERICAS RARE-EARTH METALS MARKET SIZE, BY COUNTRY, 2022 VS 2023 VS 2030 (USD MILLION)
- FIGURE 13. UNITED STATES RARE-EARTH METALS MARKET SIZE, BY STATE, 2022 VS 2030 (%)
- FIGURE 14. UNITED STATES RARE-EARTH METALS MARKET SIZE, BY STATE, 2022 VS 2023 VS 2030 (USD MILLION)
- FIGURE 15. ASIA-PACIFIC RARE-EARTH METALS MARKET SIZE, BY COUNTRY, 2022 VS 2030 (%)
- FIGURE 16. ASIA-PACIFIC RARE-EARTH METALS MARKET SIZE, BY COUNTRY, 2022 VS 2023 VS 2030 (USD MILLION)
- FIGURE 17. EUROPE, MIDDLE EAST & AFRICA RARE-EARTH METALS MARKET SIZE, BY COUNTRY, 2022 VS 2030 (%)
- FIGURE 18. EUROPE, MIDDLE EAST & AFRICA RARE-EARTH METALS MARKET SIZE, BY COUNTRY, 2022 VS 2023 VS 2030 (USD MILLION)
- FIGURE 19. RARE-EARTH METALS MARKET, FPNV POSITIONING MATRIX, 2022
- FIGURE 20. RARE-EARTH METALS MARKET SHARE, BY KEY PLAYER, 2022
LIST OF TABLES
- TABLE 1. RARE-EARTH METALS MARKET SEGMENTATION & COVERAGE
- TABLE 2. UNITED STATES DOLLAR EXCHANGE RATE, 2018-2022
- TABLE 3. RARE-EARTH METALS MARKET SIZE, 2018-2030 (USD MILLION)
- TABLE 4. GLOBAL RARE-EARTH METALS MARKET SIZE, BY REGION, 2018-2030 (USD MILLION)
- TABLE 5. RARE-EARTH METALS MARKET SIZE, BY TYPE, 2018-2030 (USD MILLION)
- TABLE 6. RARE-EARTH METALS MARKET SIZE, BY CERIUM OXIDE, BY REGION, 2018-2030 (USD MILLION)
- TABLE 7. RARE-EARTH METALS MARKET SIZE, BY DYSPROSIUM OXIDE, BY REGION, 2018-2030 (USD MILLION)
- TABLE 8. RARE-EARTH METALS MARKET SIZE, BY EUROPIUM OXIDE, BY REGION, 2018-2030 (USD MILLION)
- TABLE 9. RARE-EARTH METALS MARKET SIZE, BY GADOLINIUM OXIDE, BY REGION, 2018-2030 (USD MILLION)
- TABLE 10. RARE-EARTH METALS MARKET SIZE, BY LANTHANUM OXIDE, BY REGION, 2018-2030 (USD MILLION)
- TABLE 11. RARE-EARTH METALS MARKET SIZE, BY NEODYMIUM OXIDE, BY REGION, 2018-2030 (USD MILLION)
- TABLE 12. RARE-EARTH METALS MARKET SIZE, BY PRASEODYMIUM OXIDE, BY REGION, 2018-2030 (USD MILLION)
- TABLE 13. RARE-EARTH METALS MARKET SIZE, BY SAMARIUM OXIDE, BY REGION, 2018-2030 (USD MILLION)
- TABLE 14. RARE-EARTH METALS MARKET SIZE, BY TERBIUM OXIDE, BY REGION, 2018-2030 (USD MILLION)
- TABLE 15. RARE-EARTH METALS MARKET SIZE, BY YTTRIUM OXIDE, BY REGION, 2018-2030 (USD MILLION)
- TABLE 16. RARE-EARTH METALS MARKET SIZE, BY APPLICATION, 2018-2030 (USD MILLION)
- TABLE 17. RARE-EARTH METALS MARKET SIZE, BY CATALYSTS, BY REGION, 2018-2030 (USD MILLION)
- TABLE 18. RARE-EARTH METALS MARKET SIZE, BY CERAMICS, BY REGION, 2018-2030 (USD MILLION)
- TABLE 19. RARE-EARTH METALS MARKET SIZE, BY GLASS ADDITIVES, BY REGION, 2018-2030 (USD MILLION)
- TABLE 20. RARE-EARTH METALS MARKET SIZE, BY GLASS POLISHING, BY REGION, 2018-2030 (USD MILLION)
- TABLE 21. RARE-EARTH METALS MARKET SIZE, BY METAL ALLOYS, BY REGION, 2018-2030 (USD MILLION)
- TABLE 22. RARE-EARTH METALS MARKET SIZE, BY PERMANENT MAGNETS, BY REGION, 2018-2030 (USD MILLION)
- TABLE 23. RARE-EARTH METALS MARKET SIZE, BY PHOSPHORS, BY REGION, 2018-2030 (USD MILLION)
- TABLE 24. AMERICAS RARE-EARTH METALS MARKET SIZE, BY TYPE, 2018-2030 (USD MILLION)
- TABLE 25. AMERICAS RARE-EARTH METALS MARKET SIZE, BY APPLICATION, 2018-2030 (USD MILLION)
- TABLE 26. AMERICAS RARE-EARTH METALS MARKET SIZE, BY COUNTRY, 2018-2030 (USD MILLION)
- TABLE 27. ARGENTINA RARE-EARTH METALS MARKET SIZE, BY TYPE, 2018-2030 (USD MILLION)
- TABLE 28. ARGENTINA RARE-EARTH METALS MARKET SIZE, BY APPLICATION, 2018-2030 (USD MILLION)
- TABLE 29. BRAZIL RARE-EARTH METALS MARKET SIZE, BY TYPE, 2018-2030 (USD MILLION)
- TABLE 30. BRAZIL RARE-EARTH METALS MARKET SIZE, BY APPLICATION, 2018-2030 (USD MILLION)
- TABLE 31. CANADA RARE-EARTH METALS MARKET SIZE, BY TYPE, 2018-2030 (USD MILLION)
- TABLE 32. CANADA RARE-EARTH METALS MARKET SIZE, BY APPLICATION, 2018-2030 (USD MILLION)
- TABLE 33. MEXICO RARE-EARTH METALS MARKET SIZE, BY TYPE, 2018-2030 (USD MILLION)
- TABLE 34. MEXICO RARE-EARTH METALS MARKET SIZE, BY APPLICATION, 2018-2030 (USD MILLION)
- TABLE 35. UNITED STATES RARE-EARTH METALS MARKET SIZE, BY TYPE, 2018-2030 (USD MILLION)
- TABLE 36. UNITED STATES RARE-EARTH METALS MARKET SIZE, BY APPLICATION, 2018-2030 (USD MILLION)
- TABLE 37. UNITED STATES RARE-EARTH METALS MARKET SIZE, BY STATE, 2018-2030 (USD MILLION)
- TABLE 38. ASIA-PACIFIC RARE-EARTH METALS MARKET SIZE, BY TYPE, 2018-2030 (USD MILLION)
- TABLE 39. ASIA-PACIFIC RARE-EARTH METALS MARKET SIZE, BY APPLICATION, 2018-2030 (USD MILLION)
- TABLE 40. ASIA-PACIFIC RARE-EARTH METALS MARKET SIZE, BY COUNTRY, 2018-2030 (USD MILLION)
- TABLE 41. AUSTRALIA RARE-EARTH METALS MARKET SIZE, BY TYPE, 2018-2030 (USD MILLION)
- TABLE 42. AUSTRALIA RARE-EARTH METALS MARKET SIZE, BY APPLICATION, 2018-2030 (USD MILLION)
- TABLE 43. CHINA RARE-EARTH METALS MARKET SIZE, BY TYPE, 2018-2030 (USD MILLION)
- TABLE 44. CHINA RARE-EARTH METALS MARKET SIZE, BY APPLICATION, 2018-2030 (USD MILLION)
- TABLE 45. INDIA RARE-EARTH METALS MARKET SIZE, BY TYPE, 2018-2030 (USD MILLION)
- TABLE 46. INDIA RARE-EARTH METALS MARKET SIZE, BY APPLICATION, 2018-2030 (USD MILLION)
- TABLE 47. INDONESIA RARE-EARTH METALS MARKET SIZE, BY TYPE, 2018-2030 (USD MILLION)
- TABLE 48. INDONESIA RARE-EARTH METALS MARKET SIZE, BY APPLICATION, 2018-2030 (USD MILLION)
- TABLE 49. JAPAN RARE-EARTH METALS MARKET SIZE, BY TYPE, 2018-2030 (USD MILLION)
- TABLE 50. JAPAN RARE-EARTH METALS MARKET SIZE, BY APPLICATION, 2018-2030 (USD MILLION)
- TABLE 51. MALAYSIA RARE-EARTH METALS MARKET SIZE, BY TYPE, 2018-2030 (USD MILLION)
- TABLE 52. MALAYSIA RARE-EARTH METALS MARKET SIZE, BY APPLICATION, 2018-2030 (USD MILLION)
- TABLE 53. PHILIPPINES RARE-EARTH METALS MARKET SIZE, BY TYPE, 2018-2030 (USD MILLION)
- TABLE 54. PHILIPPINES RARE-EARTH METALS MARKET SIZE, BY APPLICATION, 2018-2030 (USD MILLION)
- TABLE 55. SINGAPORE RARE-EARTH METALS MARKET SIZE, BY TYPE, 2018-2030 (USD MILLION)
- TABLE 56. SINGAPORE RARE-EARTH METALS MARKET SIZE, BY APPLICATION, 2018-2030 (USD MILLION)
- TABLE 57. SOUTH KOREA RARE-EARTH METALS MARKET SIZE, BY TYPE, 2018-2030 (USD MILLION)
- TABLE 58. SOUTH KOREA RARE-EARTH METALS MARKET SIZE, BY APPLICATION, 2018-2030 (USD MILLION)
- TABLE 59. TAIWAN RARE-EARTH METALS MARKET SIZE, BY TYPE, 2018-2030 (USD MILLION)
- TABLE 60. TAIWAN RARE-EARTH METALS MARKET SIZE, BY APPLICATION, 2018-2030 (USD MILLION)
- TABLE 61. THAILAND RARE-EARTH METALS MARKET SIZE, BY TYPE, 2018-2030 (USD MILLION)
- TABLE 62. THAILAND RARE-EARTH METALS MARKET SIZE, BY APPLICATION, 2018-2030 (USD MILLION)
- TABLE 63. VIETNAM RARE-EARTH METALS MARKET SIZE, BY TYPE, 2018-2030 (USD MILLION)
- TABLE 64. VIETNAM RARE-EARTH METALS MARKET SIZE, BY APPLICATION, 2018-2030 (USD MILLION)
- TABLE 65. EUROPE, MIDDLE EAST & AFRICA RARE-EARTH METALS MARKET SIZE, BY TYPE, 2018-2030 (USD MILLION)
- TABLE 66. EUROPE, MIDDLE EAST & AFRICA RARE-EARTH METALS MARKET SIZE, BY APPLICATION, 2018-2030 (USD MILLION)
- TABLE 67. EUROPE, MIDDLE EAST & AFRICA RARE-EARTH METALS MARKET SIZE, BY COUNTRY, 2018-2030 (USD MILLION)
- TABLE 68. DENMARK RARE-EARTH METALS MARKET SIZE, BY TYPE, 2018-2030 (USD MILLION)
- TABLE 69. DENMARK RARE-EARTH METALS MARKET SIZE, BY APPLICATION, 2018-2030 (USD MILLION)
- TABLE 70. EGYPT RARE-EARTH METALS MARKET SIZE, BY TYPE, 2018-2030 (USD MILLION)
- TABLE 71. EGYPT RARE-EARTH METALS MARKET SIZE, BY APPLICATION, 2018-2030 (USD MILLION)
- TABLE 72. FINLAND RARE-EARTH METALS MARKET SIZE, BY TYPE, 2018-2030 (USD MILLION)
- TABLE 73. FINLAND RARE-EARTH METALS MARKET SIZE, BY APPLICATION, 2018-2030 (USD MILLION)
- TABLE 74. FRANCE RARE-EARTH METALS MARKET SIZE, BY TYPE, 2018-2030 (USD MILLION)
- TABLE 75. FRANCE RARE-EARTH METALS MARKET SIZE, BY APPLICATION, 2018-2030 (USD MILLION)
- TABLE 76. GERMANY RARE-EARTH METALS MARKET SIZE, BY TYPE, 2018-2030 (USD MILLION)
- TABLE 77. GERMANY RARE-EARTH METALS MARKET SIZE, BY APPLICATION, 2018-2030 (USD MILLION)
- TABLE 78. ISRAEL RARE-EARTH METALS MARKET SIZE, BY TYPE, 2018-2030 (USD MILLION)
- TABLE 79. ISRAEL RARE-EARTH METALS MARKET SIZE, BY APPLICATION, 2018-2030 (USD MILLION)
- TABLE 80. ITALY RARE-EARTH METALS MARKET SIZE, BY TYPE, 2018-2030 (USD MILLION)
- TABLE 81. ITALY RARE-EARTH METALS MARKET SIZE, BY APPLICATION, 2018-2030 (USD MILLION)
- TABLE 82. NETHERLANDS RARE-EARTH METALS MARKET SIZE, BY TYPE, 2018-2030 (USD MILLION)
- TABLE 83. NETHERLANDS RARE-EARTH METALS MARKET SIZE, BY APPLICATION, 2018-2030 (USD MILLION)
- TABLE 84. NIGERIA RARE-EARTH METALS MARKET SIZE, BY TYPE, 2018-2030 (USD MILLION)
- TABLE 85. NIGERIA RARE-EARTH METALS MARKET SIZE, BY APPLICATION, 2018-2030 (USD MILLION)
- TABLE 86. NORWAY RARE-EARTH METALS MARKET SIZE, BY TYPE, 2018-2030 (USD MILLION)
- TABLE 87. NORWAY RARE-EARTH METALS MARKET SIZE, BY APPLICATION, 2018-2030 (USD MILLION)
- TABLE 88. POLAND RARE-EARTH METALS MARKET SIZE, BY TYPE, 2018-2030 (USD MILLION)
- TABLE 89. POLAND RARE-EARTH METALS MARKET SIZE, BY APPLICATION, 2018-2030 (USD MILLION)
- TABLE 90. QATAR RARE-EARTH METALS MARKET SIZE, BY TYPE, 2018-2030 (USD MILLION)
- TABLE 91. QATAR RARE-EARTH METALS MARKET SIZE, BY APPLICATION, 2018-2030 (USD MILLION)
- TABLE 92. RUSSIA RARE-EARTH METALS MARKET SIZE, BY TYPE, 2018-2030 (USD MILLION)
- TABLE 93. RUSSIA RARE-EARTH METALS MARKET SIZE, BY APPLICATION, 2018-2030 (USD MILLION)
- TABLE 94. SAUDI ARABIA RARE-EARTH METALS MARKET SIZE, BY TYPE, 2018-2030 (USD MILLION)
- TABLE 95. SAUDI ARABIA RARE-EARTH METALS MARKET SIZE, BY APPLICATION, 2018-2030 (USD MILLION)
- TABLE 96. SOUTH AFRICA RARE-EARTH METALS MARKET SIZE, BY TYPE, 2018-2030 (USD MILLION)
- TABLE 97. SOUTH AFRICA RARE-EARTH METALS MARKET SIZE, BY APPLICATION, 2018-2030 (USD MILLION)
- TABLE 98. SPAIN RARE-EARTH METALS MARKET SIZE, BY TYPE, 2018-2030 (USD MILLION)
- TABLE 99. SPAIN RARE-EARTH METALS MARKET SIZE, BY APPLICATION, 2018-2030 (USD MILLION)
- TABLE 100. SWEDEN RARE-EARTH METALS MARKET SIZE, BY TYPE, 2018-2030 (USD MILLION)
- TABLE 101. SWEDEN RARE-EARTH METALS MARKET SIZE, BY APPLICATION, 2018-2030 (USD MILLION)
- TABLE 102. SWITZERLAND RARE-EARTH METALS MARKET SIZE, BY TYPE, 2018-2030 (USD MILLION)
- TABLE 103. SWITZERLAND RARE-EARTH METALS MARKET SIZE, BY APPLICATION, 2018-2030 (USD MILLION)
- TABLE 104. UNITED ARAB EMIRATES RARE-EARTH METALS MARKET SIZE, BY TYPE, 2018-2030 (USD MILLION)
- TABLE 105. UNITED ARAB EMIRATES RARE-EARTH METALS MARKET SIZE, BY APPLICATION, 2018-2030 (USD MILLION)
- TABLE 106. UNITED KINGDOM RARE-EARTH METALS MARKET SIZE, BY TYPE, 2018-2030 (USD MILLION)
- TABLE 107. UNITED KINGDOM RARE-EARTH METALS MARKET SIZE, BY APPLICATION, 2018-2030 (USD MILLION)
- TABLE 108. RARE-EARTH METALS MARKET, FPNV POSITIONING MATRIX, 2022
- TABLE 109. RARE-EARTH METALS MARKET SHARE, BY KEY PLAYER, 2022
- TABLE 110. RARE-EARTH METALS MARKET LICENSE & PRICING
The Rare-Earth Metals Market is projected to reach USD 22.94 billion by 2030 from USD 10.41 billion in 2022, at a CAGR of 10.37% during the forecast period.
Global Rare-Earth Metals Market
| KEY MARKET STATISTICS | |
|---|---|
| Base Year [2022] | USD 10.41 billion |
| Estimated Year [2023] | USD 11.34 billion |
| Forecast Year [2030] | USD 22.94 billion |
| CAGR (%) | 10.37% |
Market Segmentation & Coverage:
This research report analyzes various sub-markets, forecasts revenues, and examines emerging trends in each category to provide a comprehensive outlook on the Rare-Earth Metals Market.
Based on Type, market is studied across Cerium Oxide, Dysprosium Oxide, Europium Oxide, Gadolinium Oxide, Lanthanum Oxide, Neodymium Oxide, Praseodymium Oxide, Samarium Oxide, Terbium Oxide, and Yttrium Oxide. The Cerium Oxide commanded largest market share of 19.34% in 2022, followed by Yttrium Oxide.
Based on Application, market is studied across Catalysts, Ceramics, Glass Additives, Glass Polishing, Metal Alloys, Permanent Magnets, and Phosphors. The Metal Alloys commanded largest market share of 21.65% in 2022, followed by Permanent Magnets.
Based on Region, market is studied across Americas, Asia-Pacific, and Europe, Middle East & Africa. The Americas is further studied across Argentina, Brazil, Canada, Mexico, and United States. The United States is further studied across Alaska, Arizona, California, Georgia, Michigan, Missouri, Montana, Nevada, North Dakota, Texas, West Virginia, and Wyoming. The Asia-Pacific is further studied across Australia, China, India, Indonesia, Japan, Malaysia, Philippines, Singapore, South Korea, Taiwan, Thailand, and Vietnam. The Europe, Middle East & Africa is further studied across Denmark, Egypt, Finland, France, Germany, Israel, Italy, Netherlands, Nigeria, Norway, Poland, Qatar, Russia, Saudi Arabia, South Africa, Spain, Sweden, Switzerland, United Arab Emirates, and United Kingdom. The Asia-Pacific commanded largest market share of 56.12% in 2022, followed by Europe, Middle East & Africa.
Market Statistics:
The report provides market sizing and forecasts across 7 major currencies - USD, EUR, JPY, GBP, AUD, CAD, and CHF; multiple currency support helps organization leaders to make well-informed decisions. In this report, 2018 to 2021 are considered as historical years, 2022 is base year, 2023 is estimated year, and years from 2024 to 2030 are considered as forecast period.
FPNV Positioning Matrix:
The FPNV Positioning Matrix is an indispensable tool for assessing the Rare-Earth Metals Market. It comprehensively evaluates vendors, analyzing key metrics related to Business Strategy and Product Satisfaction. This enables users to make informed decisions tailored to their specific needs. Through advanced analysis, vendors are categorized into four distinct quadrants, each representing a different level of success: Forefront (F), Pathfinder (P), Niche (N), or Vital (V). Be assured that this insightful framework empowers decision-makers to navigate the market with confidence.
Market Share Analysis:
The Market Share Analysis offers invaluable insights into the vendor landscape Rare-Earth Metals Market. By evaluating their impact on overall revenue, customer base, and other key metrics, we provide companies with a comprehensive understanding of their performance and the competitive environment they confront. This analysis also uncovers the level of competition in terms of market share acquisition, fragmentation, dominance, and industry consolidation during the study period.
Key Company Profiles:
The report delves into recent significant developments in the Rare-Earth Metals Market, highlighting leading vendors and their innovative profiles. These include ABx Limited, Alkane Resources Ltd., Aluminium Corporation of China Limited, American Elements, American Rare Earths Limited, Arafura Resources Ltd., Australian Rare Earths Limited, Avalon Advanced Materials Inc., Canada Rare Earth Corporation, China Non-ferrous Metal Industry's Foreign Engineering and Construction Co., Ltd., China Northern Rare Earth (Group) High-Tech Co., Ltd., China Rare Earth Group Resources Technology Co., Ltd., China Rare Earth Holdings Limited, Encounter Resources Limited, Energy Fuels Inc., Energy Transition Minerals Ltd., Enova Mining Limited, Eutectix, LLC, Frontier Rare Earths, Fujian Changting Golden Dragon Rare-Earth Co., Ltd., GTS German Trading Service GmbH, Hebei Suoyi New Material Technology Co., Ltd., HEFA Rare Earth Canada Ltd., Iluka Resources Limited, JL MAG Rare-Earth Co., Ltd., Krakatoa Resources Ltd., Lynas Malaysia Sdn Bhd, Medallion Resources Ltd., Mitsubishi Corporation RtM Japan Ltd., MP Materials Corp., Neo Performance Materials, NioCorp Development Ltd., Norwegian company REEtec, Otto Chemie Pvt. Ltd., Rare Element Resources Ltd., Shin-Etsu Chemical Co., Ltd., Solvay SA, Texas Mineral Resources Corp., and Ucore Rare Metals Inc..
The report offers valuable insights on the following aspects:
1. Market Penetration: It provides comprehensive information about key players' market dynamics and offerings.
2. Market Development: In-depth analysis of emerging markets and penetration across mature market segments, highlighting lucrative opportunities.
3. Market Diversification: Detailed information about new product launches, untapped geographies, recent developments, and investments.
4. Competitive Assessment & Intelligence: Exhaustive assessment of market shares, strategies, products, certifications, regulatory approvals, patent landscape, and manufacturing capabilities of leading players.
5. Product Development & Innovation: Intelligent insights on future technologies, R&D activities, and breakthrough product developments.
The report addresses key questions such as:
1. What is the market size and forecast for the Rare-Earth Metals Market?
2. Which products, segments, applications, and areas hold the highest investment potential in the Rare-Earth Metals Market?
3. What is the competitive strategic window for identifying opportunities in the Rare-Earth Metals Market?
4. What are the latest technology trends and regulatory frameworks in the Rare-Earth Metals Market?
5. What is the market share of the leading vendors in the Rare-Earth Metals Market?
6. Which modes and strategic moves are suitable for entering the Rare-Earth Metals Market?
Table of Contents
1. Preface
- 1.1. Objectives of the Study
- 1.2. Market Segmentation & Coverage
- 1.3. Years Considered for the Study
- 1.4. Currency & Pricing
- 1.5. Language
- 1.6. Limitations
- 1.7. Assumptions
- 1.8. Stakeholders
2. Research Methodology
- 2.1. Define: Research Objective
- 2.2. Determine: Research Design
- 2.3. Prepare: Research Instrument
- 2.4. Collect: Data Source
- 2.5. Analyze: Data Interpretation
- 2.6. Formulate: Data Verification
- 2.7. Publish: Research Report
- 2.8. Repeat: Report Update
3. Executive Summary
4. Market Overview
- 4.1. Introduction
- 4.2. Rare-Earth Metals Market, by Region
5. Market Insights
- 5.1. Market Dynamics
- 5.1.1. Drivers
- 5.1.1.1. Rising global shift towards clean energy solutions worldwide
- 5.1.1.2. Government initiatives to promote mining and production of rare earth metals
- 5.1.1.3. Rapid development and advancements in consumer electronics & advanced weaponry systems
- 5.1.2. Restraints
- 5.1.2.1. Limited availability of rare earth metals and difficulties associated with mining
- 5.1.3. Opportunities
- 5.1.3.1. Continuous research & development activities to develop new extraction technologies
- 5.1.3.2. Emerging emphasis on sustainable development and recycling of rare earth metals
- 5.1.4. Challenges
- 5.1.4.1. Environmental concerns associated with extraction techniques of rare-earth metals
- 5.1.1. Drivers
- 5.2. Market Segmentation Analysis
- 5.2.1. Type: Growing use of cerium oxide in semiconductor production
- 5.2.2. Application: Higher consumption of metal alloys with expansion of manufacturing sector
- 5.3. Market Trend Analysis
- 5.3.1. Significant growth potential in Americas region backed by government support and technological advancements in exploration & production process
- 5.3.2. Dominating production and reserve space for rare earth metals in the Asia-Pacific backed by government funding for expanding the region's global position in the market
- 5.3.3. Growing initiatives promoting responsible sourcing and procuring rare-earth metals to meet demand from end-use industries across EMEA
- 5.4. Cumulative Impact of High Inflation
- 5.5. Porter's Five Forces Analysis
- 5.5.1. Threat of New Entrants
- 5.5.2. Threat of Substitutes
- 5.5.3. Bargaining Power of Customers
- 5.5.4. Bargaining Power of Suppliers
- 5.5.5. Industry Rivalry
- 5.6. Value Chain & Critical Path Analysis
- 5.7. Regulatory Framework
6. Rare-Earth Metals Market, by Type
- 6.1. Introduction
- 6.2. Cerium Oxide
- 6.3. Dysprosium Oxide
- 6.4. Europium Oxide
- 6.5. Gadolinium Oxide
- 6.6. Lanthanum Oxide
- 6.7. Neodymium Oxide
- 6.8. Praseodymium Oxide
- 6.9. Samarium Oxide
- 6.10. Terbium Oxide
- 6.11. Yttrium Oxide
7. Rare-Earth Metals Market, by Application
- 7.1. Introduction
- 7.2. Catalysts
- 7.3. Ceramics
- 7.4. Glass Additives
- 7.5. Glass Polishing
- 7.6. Metal Alloys
- 7.7. Permanent Magnets
- 7.8. Phosphors
8. Americas Rare-Earth Metals Market
- 8.1. Introduction
- 8.2. Argentina
- 8.3. Brazil
- 8.4. Canada
- 8.5. Mexico
- 8.6. United States
9. Asia-Pacific Rare-Earth Metals Market
- 9.1. Introduction
- 9.2. Australia
- 9.3. China
- 9.4. India
- 9.5. Indonesia
- 9.6. Japan
- 9.7. Malaysia
- 9.8. Philippines
- 9.9. Singapore
- 9.10. South Korea
- 9.11. Taiwan
- 9.12. Thailand
- 9.13. Vietnam
10. Europe, Middle East & Africa Rare-Earth Metals Market
- 10.1. Introduction
- 10.2. Denmark
- 10.3. Egypt
- 10.4. Finland
- 10.5. France
- 10.6. Germany
- 10.7. Israel
- 10.8. Italy
- 10.9. Netherlands
- 10.10. Nigeria
- 10.11. Norway
- 10.12. Poland
- 10.13. Qatar
- 10.14. Russia
- 10.15. Saudi Arabia
- 10.16. South Africa
- 10.17. Spain
- 10.18. Sweden
- 10.19. Switzerland
- 10.20. United Arab Emirates
- 10.21. United Kingdom
11. Competitive Landscape
- 11.1. FPNV Positioning Matrix
- 11.2. Market Share Analysis, By Key Player
- 11.3. Competitive Scenario Analysis, By Key Player
- 11.3.1. Merger & Acquisition
- 11.3.1.1. Energy Fuels Completes Acquisition of Rare Earth and Heavy Mineral Project in Brazil
- 11.3.2. Agreement, Collaboration, & Partnership
- 11.3.2.1. USA Rare Earth Signs Supply Agreement with Australian Strategic Materials
- 11.3.2.2. GE Renewable Energy and Arafura Resources sign Memorandum of Understanding (MoU) on Neodymium and Praseodymium (NdPr) Rare Earths
- 11.3.2.3. HG Ventures Invests in and Partners with American Rare Earth to Expand Battery Recycling and Metals Supply for U.S. Manufacturing
- 11.3.3. Investment & Funding
- 11.3.3.1. Lynas Rare Earths gets USD 14 million Australian government grant to develop a project
- 11.3.3.2. Ucore Investing USD 75 Million to Establish Rare Earth Metals Manufacturing Facility in Alexandria
- 11.3.3.3. Encounter Resources taps Investors for USD 10 Million to Accelerate West Arunta Exploration
- 11.3.3.4. Cyclic Materials raises USD 27 million for critical mineral recycling
- 11.3.3.5. Australia's Lynas gets USD 120 Million Pentagon Contract for U.S. Rare Earths Project
- 11.3.4. Award, Recognition, & Expansion
- 11.3.4.1. American Rare Earths Announces New U.S. Headquarters
- 11.3.4.2. ABx Group Eyes Further Resource Growth at Deep Leads and Rubble Mounds Rare Earth Project, Tasmania
- 11.3.4.3. Rare earth metals producer Lynas announces USD 500 million expansion at Mt Weld mine
- 11.3.1. Merger & Acquisition
12. Competitive Portfolio
- 12.1. Key Company Profiles
- 12.1.1. ABx Limited
- 12.1.2. Alkane Resources Ltd.
- 12.1.3. Aluminium Corporation of China Limited
- 12.1.4. American Elements
- 12.1.5. American Rare Earths Limited
- 12.1.6. Arafura Resources Ltd.
- 12.1.7. Australian Rare Earths Limited
- 12.1.8. Avalon Advanced Materials Inc.
- 12.1.9. Canada Rare Earth Corporation
- 12.1.10. China Non-ferrous Metal Industry's Foreign Engineering and Construction Co., Ltd.
- 12.1.11. China Northern Rare Earth (Group) High-Tech Co., Ltd.
- 12.1.12. China Rare Earth Group Resources Technology Co., Ltd.
- 12.1.13. China Rare Earth Holdings Limited
- 12.1.14. Encounter Resources Limited
- 12.1.15. Energy Fuels Inc.
- 12.1.16. Energy Transition Minerals Ltd.
- 12.1.17. Enova Mining Limited
- 12.1.18. Eutectix, LLC
- 12.1.19. Frontier Rare Earths
- 12.1.20. Fujian Changting Golden Dragon Rare-Earth Co., Ltd.
- 12.1.21. GTS German Trading Service GmbH
- 12.1.22. Hebei Suoyi New Material Technology Co., Ltd.
- 12.1.23. HEFA Rare Earth Canada Ltd.
- 12.1.24. Iluka Resources Limited
- 12.1.25. JL MAG Rare-Earth Co., Ltd.
- 12.1.26. Krakatoa Resources Ltd.
- 12.1.27. Lynas Malaysia Sdn Bhd
- 12.1.28. Medallion Resources Ltd.
- 12.1.29. Mitsubishi Corporation RtM Japan Ltd.
- 12.1.30. MP Materials Corp.
- 12.1.31. Neo Performance Materials
- 12.1.32. NioCorp Development Ltd.
- 12.1.33. Norwegian company REEtec
- 12.1.34. Otto Chemie Pvt. Ltd.
- 12.1.35. Rare Element Resources Ltd.
- 12.1.36. Shin-Etsu Chemical Co., Ltd.
- 12.1.37. Solvay SA
- 12.1.38. Texas Mineral Resources Corp.
- 12.1.39. Ucore Rare Metals Inc.
- 12.2. Key Product Portfolio
13. Appendix
- 13.1. Discussion Guide
- 13.2. License & Pricing