|
|
市場調査レポート
商品コード
1072806
自動車用トルクコンバーターの世界市場(2022年~2026年)Global Automotive Torque Converter Market 2022-2026 |
||||||
|
|
|||||||
|
● お客様のご希望に応じて、既存データの加工や未掲載情報(例:国別セグメント)の追加などの対応が可能です。 詳細はお問い合わせください。 |
|||||||


| 自動車用トルクコンバーターの世界市場(2022年~2026年) |
|
出版日: 2022年04月26日
発行: TechNavio
ページ情報: 英文 120 Pages
納期: 即納可能
|
- 全表示
- 概要
- 図表
- 目次
世界の自動車用トルクコンバーターの市場規模は、2022年から2026年の予測期間中に5.3%のCAGRで推移し、15億2,000万米ドルの成長が見込まれています。
同市場の成長を後押しする主な要因には、自動車産業のグローバリゼーションによるアジア太平洋地域のオートマチックトランスミッション車の需要増加、オートマチックトランスミッションシステムの需要増加、低燃費車の需要増加などが挙げられます。
当レポートでは、世界の自動車用トルクコンバーター市場を調査しており、市場の概要、市場規模や予測、動向、成長要因および課題、顧客情勢、用途・地域別の分析、さらにベンダー情勢およびベンダー分析などを提供しています。
目次
第1章 エグゼクティブサマリー
- 市場概要
第2章 市場情勢
- 市場のエコシステム
第3章 市場規模
- 市場の定義
- 市場セグメント分析
- 市場規模:2021年
- 市場の見通し:2021年から2026年の予測
第4章 ファイブフォース分析
- ファイブフォースサマリー
- 買い手の交渉力
- 供給企業の交渉力
- 新規参入業者の脅威
- 代替品の脅威
- ライバル関係の脅威
- 市況
第5章 用途別の市場内訳
- 市場内訳
- 用途別比較
- 乗用車:市場規模と予測(2021年~2026年)
- 商用車:市場規模と予測(2021年~2026年)
- 用途別の市場機会
第6章 顧客情勢
- 顧客情勢の概要
第7章 地域別情勢
- 地域別セグメンテーション
- 地域別比較
- 北米:市場規模と予測(2021年~2026年)
- 欧州:市場規模と予測(2021年~2026年)
- アジア太平洋:市場規模と予測(2021年~2026年)
- 南米:市場規模と予測(2021年~2026年)
- 中東とアフリカ:市場規模と予測(2021年~2026年)
- 米国:市場規模と予測(2021年~2026年)
- 中国:市場規模と予測(2021年~2026年)
- 英国:市場規模と予測(2021年~2026年)
- ドイツ:市場規模と予測(2021年~2026年)
- 地域情勢別の市場機会
第8章 成長要因、課題、および動向
- 市場促進要因
- 市場の課題
- 成長要因と課題の影響
- 市場動向
第9章 ベンダー情勢
- 概要
- ベンダー情勢
- 混乱情勢
- 業界のリスク
第10章 ベンダー分析
- 対象ベンダー
- ベンダーの市場ポジショニング
- Aisin Corp.
- BorgWarner Inc.
- Schaeffler AG
- Sonnax Transmission Co. Inc.
- SUBARU Corp.
- Transtar Industries Inc.
- Valeo SAA
- Voith GmbH and Co. KGaA
- Yutaka Giken Co. Ltd.
- ZF Friedrichshafen AG
第11章 付録
- 調査範囲
- 包含および除外チェックリスト
- 米ドルの為替レート
- 調査手法
- 略語のリスト
図表:
- 図表1:エグゼクティブサマリー:市場概要のチャート
- 図表2:エグゼクティブサマリー:市場概要に関するデータテーブル
- 図表3:エグゼクティブサマリー:世界市場の特徴に関するチャート
- 図表4:エグゼクティブサマリー:地域別情勢の市場チャート
- 図表5:エグゼクティブサマリー:用途別の市場内訳に関するチャート
- 図表6:エグゼクティブサマリー:増分成長に関するチャート
- 図表7:エグゼクティブサマリー:増分成長に関するデータテーブル
- 図表8:エグゼクティブサマリー:ベンダー市場のポジショニングに関するチャート
- 図表9:親市場
- 図表10:市場の特徴
- 図表11:市場定義に含まれるベンダーの提供
- 図表12:市場セグメント
- 図表13:世界のチャート:市場規模と予測(2021年~2026年)
- 図表14:世界に関するデータ表:市場規模と予測(2021年~2026年)
- 図表15:世界市場のチャート:前年比成長率(2021年~2026年)
- 図表16:世界市場のデータ表:前年比成長(2021年~2026年)
- 図表17:ファイブフォース分析:2021年と2026年の比較
- 図表18:買い手の交渉力に関するチャート:2021年と2026年の主要な要因の影響
- 図表19:供給企業の交渉力:2021年と2026年の主要な要因の影響
- 図表20:新規参入業者の脅威:2021年と2026年の主要な要因の影響
- 図表21:代替品の脅威:2021年と2026年の主要な要因の影響
- 図表22:競争の脅威:2021年と2026年の主要な要因の影響
- 図表23:市況のチャート:2021年と2026年の5つの力
- 図表24:用途のチャート:市場シェア(2021年~2026年)
- 図表25:用途のデータ表:市場シェア(2021年~2026年)
- 図表26:用途別比較チャート
- 図表27:用途別比較データ表
- 図表28:乗用車のチャート:市場規模と予測(2021年~2026年)
- 図表29:乗用車のデータ表:市場規模と予測(2021年~2026年)
- 図表30:乗用車のチャート:前年比成長率(2021年~2026年)
- 図表31:乗用車のデータ表:前年比成長率(2021年~2026年)
- 図表32:商用車のチャート:市場規模と予測(2021年~2026年)
- 図表33:商用車のデータ表:市場規模と予測(2021年~2026年)
- 図表34:商用車のチャート:前年比成長率(2021年~2026年)
- 図表35:商用車のデータ表:前年比成長率(2021年~2026年)
- 図表36:用途別の市場機会
- 図表37:価格感応度、ライフサイクル、顧客購入バスケット、採用率、購入基準の分析
- 図表38:地域情勢別の市場シェアのチャート(%)(2021年~2026年)
- 図表39:地域情勢別の市場シェアのデータ表(%)(2021年~2026年)
- 図表40:地域別比較のチャート
- 図表41:地域別比較に関するデータ表
- 図表42:北米のチャート:市場規模と予測(2021年~2026年)
- 図表43:北米のデータ表:市場規模と予測(2021年~2026年)
- 図表44:北米のチャート:前年比成長率(2021年~2026年)
- 図表45:北米のデータ表:前年比成長率(2021年~2026年)
- 図表46:欧州のチャート:市場規模と予測(2021年~2026年)
- 図表47:欧州のデータ表:市場規模と予測(2021年~2026年)
- 図表48:欧州のチャート:前年比成長(2021年~2026年)
- 図表49:欧州のデータ表:前年比成長率(2021年~2026年)
- 図表50:アジア太平洋のチャート:市場規模と予測(2021年~2026年)
- 図表51:アジア太平洋のデータ表:市場規模と予測(2021年~2026年)
- 図表52:アジア太平洋のチャート:前年比成長率(2021年~2026年)
- 図表53:アジア太平洋のデータ表:前年比成長率(2021年~2026年)
- 図表54:南米のチャート:市場規模と予測(2021年~2026年)
- 図表55:南米のデータ表:市場規模と予測(2021年~2026年)
- 図表56:南米のチャート:前年比成長(2021年~2026年)
- 図表57:南米のデータ表:前年比成長率(2021年~2026年)
- 図表58:中東とアフリカのチャート:市場規模と予測(2021年~2026年)
- 図表59:中東・アフリカのデータ表:市場規模および予測(2021年~2026年)
- 図表60:中東・アフリカのチャート:前年比成長率(2021年~2026年)
- 図表61:中東・アフリカのデータ表:前年比成長率(2021年~2026年)
- 図表62:米国のチャート:市場規模と予測(2021年~2026年)
- 図表63:米国のデータ表:市場規模と予測(2021年~2026年)
- 図表64:米国のチャート:前年比成長率(2021年~2026年)
- 図表65:米国のデータ表:前年比成長率(2021年~2026年)
- 図表66:中国のチャート:市場規模と予測(2021年~2026年)
- 図表67:中国のデータ表:市場規模と予測(2021年~2026年)
- 図表68:中国のチャート:前年比成長率(2021年~2026年)
- 図表69:中国のデータ表:前年比成長率(2021年~2026年)
- 図表70:英国のチャート:市場規模と予測(2021年~2026年)
- 図表71:英国のデータ表:市場規模と予測(2021年~2026年)
- 図表72:英国のチャート:前年比成長率(2021年~2026年)
- 図表73:英国のデータ表:前年比成長率(2021年~2026年)
- 図表74:ドイツのチャート:市場規模と予測(2021年~2026年)
- 図表75:ドイツのデータ表:市場規模と予測(2021年~2026年)
- 図表76:ドイツのチャート:前年比成長率(2021年~2026年)
- 図表77:ドイツのデータ表:前年比成長率(2021年~2026年)
- 図表78:地域情勢別の市場機会
- 図表79:2021年と2026年の成長要因と課題の影響
- 図表80:インプットの重要性と差別化の要因に関する概要
- 図表81:混乱の要因の概要
- 図表82:主要なリスクがビジネスに与える影響
- 図表83:対象ベンダー
- 図表84:ベンダーの位置と分類に関するマトリックス
- 図表85:Aisin Corp.:概要
- 図表86:Aisin Corp.:事業セグメント
- 図表87:Aisin Corp.:主な製品
- 図表88:Aisin Corp.:セグメントフォーカス
- 図表89:BorgWarner Inc.:概要
- 図表90:BorgWarner Inc.:事業セグメント
- 図表91:BorgWarner Inc.:重要なニュース
- 図表92:BorgWarner Inc.:主な製品
- 図表93:BorgWarner Inc.:セグメントフォーカス
- 図表94:Schaeffler AG:概要
- 図表95:Schaeffler AG:事業セグメント
- 図表96:Schaeffler AG:主な製品
- 図表97:Schaeffler AG:セグメントフォーカス
- 図表98:Sonnax Transmission Co. Inc.:概要
- 図表99:Sonnax Transmission Co. Inc.:製品/サービス
- 図表100:Sonnax Transmission Co. Inc.:主な製品
- 図表101:SUBARU Corp.:概要
- 図表102:SUBARU Corp.:事業セグメント
- 図表103:SUBARU Corp.:主な製品
- 図表104:SUBARU Corp.:セグメントフォーカス
- 図表105:Transtar Industries Inc.:概要
- 図表106:Transtar Industries Inc.:製品/サービス
- 図表107:Transtar Industries Inc.:主な製品
- 図表108:Valeo SA:概要
- 図表109:Valeo SA:事業セグメント
- 図表110:Valeo SA:重要なニュース
- 図表111:Valeo SA:主な製品
- 図表112:Valeo SA:セグメントフォーカス
- 図表113:Voith GmbH and Co. KGaA:概要
- 図表114:Voith GmbH and Co. KGaA:事業セグメント
- 図表115:Voith GmbH and Co. KGaA:主な製品
- 図表116:Voith GmbH and Co. KGaA:セグメントフォーカス
- 図表117:Yutaka Giken Co. Ltd.:概要
- 図表118:Yutaka Giken Co. Ltd.:製品/サービス
- 図表119:Yutaka Giken Co. Ltd.:主な製品
- 図表120:ZF Friedrichshafen AG:概要
- 図表121:ZF Friedrichshafen AG:事業セグメント
- 図表122:ZF Friedrichshafen AG:重要なニュース
- 図表123:ZF Friedrichshafen AG:主な製品
- 図表124:ZFフリードリヒスハーフェンAG:セグメントフォーカス
- 図表125:包含チェックリスト
- 図表126:除外チェックリスト
- 図表127:米ドルの為替レート
- 図表128:調査手法
- 図表129:市場のサイジングに採用された検証手法
- 図表130:情報源
- 図表131:略語のリスト
Exhibits:
- Exhibits1: Executive Summary - Chart on Market Overview
- Exhibits2: Executive Summary - Data Table on Market Overview
- Exhibits3: Executive Summary - Chart on Global Market Characteristics
- Exhibits4: Executive Summary - Chart on Market By Geographical Landscape
- Exhibits5: Executive Summary - Chart on Market Segmentation by Application
- Exhibits6: Executive Summary - Chart on Incremental Growth
- Exhibits7: Executive Summary - Data Table on Incremental Growth
- Exhibits8: Executive Summary - Chart on Vendor Market Positioning
- Exhibits9: Parent market
- Exhibits10: Market Characteristics
- Exhibits11: Offerings of vendors included in the market definition
- Exhibits12: Market segments
- Exhibits13: Chart on Global - Market size and forecast 2021-2026 ($ million)
- Exhibits14: Data Table on Global - Market size and forecast 2021-2026 ($ million)
- Exhibits15: Chart on Global Market: Year-over-year growth 2021-2026 (%)
- Exhibits16: Data Table on Global Market: Year-over-year growth 2021-2026 (%)
- Exhibits17: Five forces analysis - Comparison between2021 and 2026
- Exhibits18: Chart on Bargaining power of buyers - Impact of key factors 2021 and 2026
- Exhibits19: Bargaining power of suppliers - Impact of key factors in 2021 and 2026
- Exhibits20: Threat of new entrants - Impact of key factors in 2021 and 2026
- Exhibits21: Threat of substitutes - Impact of key factors in 2021 and 2026
- Exhibits22: Threat of rivalry - Impact of key factors in 2021 and 2026
- Exhibits23: Chart on Market condition - Five forces 2021 and 2026
- Exhibits24: Chart on Application - Market share 2021-2026 (%)
- Exhibits25: Data Table on Application - Market share 2021-2026 (%)
- Exhibits26: Chart on Comparison by Application
- Exhibits27: Data Table on Comparison by Application
- Exhibits28: Chart on Passenger cars - Market size and forecast 2021-2026 ($ million)
- Exhibits29: Data Table on Passenger cars - Market size and forecast 2021-2026 ($ million)
- Exhibits30: Chart on Passenger cars - Year-over-year growth 2021-2026 (%)
- Exhibits31: Data Table on Passenger cars - Year-over-year growth 2021-2026 (%)
- Exhibits32: Chart on Commercial vehicles - Market size and forecast 2021-2026 ($ million)
- Exhibits33: Data Table on Commercial vehicles - Market size and forecast 2021-2026 ($ million)
- Exhibits34: Chart on Commercial vehicles - Year-over-year growth 2021-2026 (%)
- Exhibits35: Data Table on Commercial vehicles - Year-over-year growth 2021-2026 (%)
- Exhibits36: Market opportunity by Application ($ million)
- Exhibits37: Analysis of price sensitivity, lifecycle, customer purchase basket, adoption rates, and purchase criteria
- Exhibits38: Chart on Market share By Geographical Landscape 2021-2026 (%)
- Exhibits39: Data Table on Market share By Geographical Landscape 2021-2026 (%)
- Exhibits40: Chart on Geographic comparison
- Exhibits41: Data Table on Geographic comparison
- Exhibits42: Chart on North America - Market size and forecast 2021-2026 ($ million)
- Exhibits43: Data Table on North America - Market size and forecast 2021-2026 ($ million)
- Exhibits44: Chart on North America - Year-over-year growth 2021-2026 (%)
- Exhibits45: Data Table on North America - Year-over-year growth 2021-2026 (%)
- Exhibits46: Chart on Europe - Market size and forecast 2021-2026 ($ million)
- Exhibits47: Data Table on Europe - Market size and forecast 2021-2026 ($ million)
- Exhibits48: Chart on Europe - Year-over-year growth 2021-2026 (%)
- Exhibits49: Data Table on Europe - Year-over-year growth 2021-2026 (%)
- Exhibits50: Chart on APAC - Market size and forecast 2021-2026 ($ million)
- Exhibits51: Data Table on APAC - Market size and forecast 2021-2026 ($ million)
- Exhibits52: Chart on APAC - Year-over-year growth 2021-2026 (%)
- Exhibits53: Data Table on APAC - Year-over-year growth 2021-2026 (%)
- Exhibits54: Chart on South America - Market size and forecast 2021-2026 ($ million)
- Exhibits55: Data Table on South America - Market size and forecast 2021-2026 ($ million)
- Exhibits56: Chart on South America - Year-over-year growth 2021-2026 (%)
- Exhibits57: Data Table on South America - Year-over-year growth 2021-2026 (%)
- Exhibits58: Chart on Middle East and Africa - Market size and forecast 2021-2026 ($ million)
- Exhibits59: Data Table on Middle East and Africa - Market size and forecast 2021-2026 ($ million)
- Exhibits60: Chart on Middle East and Africa - Year-over-year growth 2021-2026 (%)
- Exhibits61: Data Table on Middle East and Africa - Year-over-year growth 2021-2026 (%)
- Exhibits62: Chart on US - Market size and forecast 2021-2026 ($ million)
- Exhibits63: Data Table on US - Market size and forecast 2021-2026 ($ million)
- Exhibits64: Chart on US - Year-over-year growth 2021-2026 (%)
- Exhibits65: Data Table on US - Year-over-year growth 2021-2026 (%)
- Exhibits66: Chart on China - Market size and forecast 2021-2026 ($ million)
- Exhibits67: Data Table on China - Market size and forecast 2021-2026 ($ million)
- Exhibits68: Chart on China - Year-over-year growth 2021-2026 (%)
- Exhibits69: Data Table on China - Year-over-year growth 2021-2026 (%)
- Exhibits70: Chart on UK - Market size and forecast 2021-2026 ($ million)
- Exhibits71: Data Table on UK - Market size and forecast 2021-2026 ($ million)
- Exhibits72: Chart on UK - Year-over-year growth 2021-2026 (%)
- Exhibits73: Data Table on UK - Year-over-year growth 2021-2026 (%)
- Exhibits74: Chart on Germany - Market size and forecast 2021-2026 ($ million)
- Exhibits75: Data Table on Germany - Market size and forecast 2021-2026 ($ million)
- Exhibits76: Chart on Germany - Year-over-year growth 2021-2026 (%)
- Exhibits77: Data Table on Germany - Year-over-year growth 2021-2026 (%)
- Exhibits78: Market opportunity By Geographical Landscape ($ million)
- Exhibits79: Impact of drivers and challenges in 2021 and 2026
- Exhibits80: Overview on Criticality of inputs and Factors of differentiation
- Exhibits81: Overview on factors of disruption
- Exhibits82: Impact of key risks on business
- Exhibits83: Vendors covered
- Exhibits84: Matrix on vendor position and classification
- Exhibits85: Aisin Corp. - Overview
- Exhibits86: Aisin Corp. - Business segments
- Exhibits87: Aisin Corp. - Key offerings
- Exhibits88: Aisin Corp. - Segment focus
- Exhibits89: BorgWarner Inc. - Overview
- Exhibits90: BorgWarner Inc. - Business segments
- Exhibits91: BorgWarner Inc. - Key news
- Exhibits92: BorgWarner Inc. - Key offerings
- Exhibits93: BorgWarner Inc. - Segment focus
- Exhibits94: Schaeffler AG - Overview
- Exhibits95: Schaeffler AG - Business segments
- Exhibits96: Schaeffler AG - Key offerings
- Exhibits97: Schaeffler AG - Segment focus
- Exhibits98: Sonnax Transmission Co. Inc. - Overview
- Exhibits99: Sonnax Transmission Co. Inc. - Product / Service
- Exhibits100: Sonnax Transmission Co. Inc. - Key offerings
- Exhibits101: SUBARU Corp. - Overview
- Exhibits102: SUBARU Corp. - Business segments
- Exhibits103: SUBARU Corp. - Key offerings
- Exhibits104: SUBARU Corp. - Segment focus
- Exhibits105: Transtar Industries Inc. - Overview
- Exhibits106: Transtar Industries Inc. - Product / Service
- Exhibits107: Transtar Industries Inc. - Key offerings
- Exhibits108: Valeo SA - Overview
- Exhibits109: Valeo SA - Business segments
- Exhibits110: Valeo SA - Key news
- Exhibits111: Valeo SA - Key offerings
- Exhibits112: Valeo SA - Segment focus
- Exhibits113: Voith GmbH and Co. KGaA - Overview
- Exhibits114: Voith GmbH and Co. KGaA - Business segments
- Exhibits115: Voith GmbH and Co. KGaA - Key offerings
- Exhibits116: Voith GmbH and Co. KGaA - Segment focus
- Exhibits117: Yutaka Giken Co. Ltd. - Overview
- Exhibits118: Yutaka Giken Co. Ltd. - Product / Service
- Exhibits119: Yutaka Giken Co. Ltd. - Key offerings
- Exhibits120: ZF Friedrichshafen AG - Overview
- Exhibits121: ZF Friedrichshafen AG - Business segments
- Exhibits122: ZF Friedrichshafen AG - Key news
- Exhibits123: ZF Friedrichshafen AG - Key offerings
- Exhibits124: ZF Friedrichshafen AG - Segment focus
- Exhibits125: Inclusions checklist
- Exhibits126: Exclusions checklist
- Exhibits127: Currency conversion rates for US$
- Exhibits128: Research methodology
- Exhibits129: Validation techniques employed for market sizing
- Exhibits130: Information sources
- Exhibits131: List of abbreviations
Technavio has been monitoring the automotive torque converter market and it is poised to grow by $ 1.52 bn during 2022-2026, accelerating at a CAGR of 5.3% during the forecast period. Our report on the automotive torque converter market provides a holistic analysis, market size and forecast, trends, growth drivers, and challenges, as well as vendor analysis covering around 25 vendors.
The report offers an up-to-date analysis of the current global market scenario, the latest trends and drivers, and the overall market environment. The market is driven by the globalization of the auto industry to increase the demand for automatic transmission vehicles in APAC, the rise in the demand for automatic transmission systems, and the increasing demand for fuel-efficient vehicles.
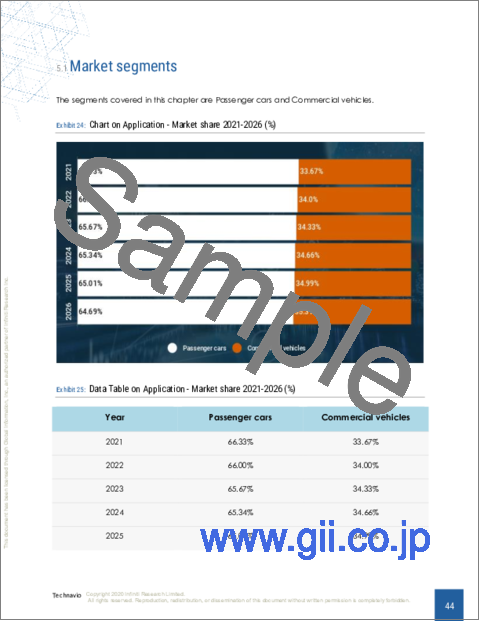
The automotive torque converter market analysis includes the application segment and geographic landscape.
Technavio's automotive torque converter market is segmented as below:
By Application
- Passenger cars
- Commercial vehicles
By Geographical Landscape
- North America
- Europe
- APAC
- South America
- The Middle East and Africa
This study identifies the increasing number of gears covering wider ratios for higher power and torque performance as one of the prime reasons driving the automotive torque converter market growth during the next few years. Also, technological advances in torque converters and the use of performance torque converters in drag racing will lead to sizable demand in the market.
Technavio presents a detailed picture of the market by the way of study, synthesis, and summation of data from multiple sources by an analysis of key parameters. Our report on the automotive torque converter market covers the following areas:
- Automotive torque converter market sizing
- Automotive torque converter market forecast
- Automotive torque converter market industry analysis
Technavio's robust vendor analysis is designed to help clients improve their market position, and in line with this, this report provides a detailed analysis of several leading automotive torque converter market vendors that include Aisin Corp., BorgWarner Inc., Continental AG, Dynamic Manufacturing Inc., EXEDY Corp., Robert Bosch GmbH, Schaeffler AG, Sonnax Transmission Co. Inc., SUBARU Corp., Transtar Industries Inc., Valeo SA, Voith GmbH and Co. KGaA, Yutaka Giken Co. Ltd., and ZF Friedrichshafen AG. Also, the automotive torque converter market analysis report includes information on upcoming trends and challenges that will influence market growth. This is to help companies strategize and leverage all forthcoming growth opportunities.
The study was conducted using an objective combination of primary and secondary information including inputs from key participants in the industry. The report contains a comprehensive market and vendor landscape in addition to an analysis of the key vendors.
Technavio presents a detailed picture of the market by the way of study, synthesis, and summation of data from multiple sources by an analysis of key parameters such as profit, pricing, competition, and promotions. It presents various market facets by identifying the key industry influencers. The data presented is comprehensive, reliable, and a result of extensive research - both primary and secondary. Technavio's market research reports provide a complete competitive landscape and an in-depth vendor selection methodology and analysis using qualitative and quantitative research to forecast accurate market growth.
Table of Contents
1 Executive Summary
- 1.1 Market overview
- Exhibit 01: Executive Summary - Chart on Market Overview
- Exhibit 02: Executive Summary - Data Table on Market Overview
- Exhibit 03: Executive Summary - Chart on Global Market Characteristics
- Exhibit 04: Executive Summary - Chart on Market By Geographical Landscape
- Exhibit 05: Executive Summary - Chart on Market Segmentation by Application
- Exhibit 06: Executive Summary - Chart on Incremental Growth
- Exhibit 07: Executive Summary - Data Table on Incremental Growth
- Exhibit 08: Executive Summary - Chart on Vendor Market Positioning
2 Market Landscape
- 2.1 Market ecosystem
- Exhibit 09: Parent market
- Exhibit 10: Market Characteristics
3 Market Sizing
- 3.1 Market definition
- Exhibit 11: Offerings of vendors included in the market definition
- 3.2 Market segment analysis
- Exhibit 12: Market segments
- 3.3 Market size 2021
- 3.4 Market outlook: Forecast for 2021-2026
- Exhibit 13: Chart on Global - Market size and forecast 2021-2026 ($ million)
- Exhibit 14: Data Table on Global - Market size and forecast 2021-2026 ($ million)
- Exhibit 15: Chart on Global Market: Year-over-year growth 2021-2026 (%)
- Exhibit 16: Data Table on Global Market: Year-over-year growth 2021-2026 (%)
4 Five Forces Analysis
- 4.1 Five forces summary
- Exhibit 17: Five forces analysis - Comparison between2021 and 2026
- 4.2 Bargaining power of buyers
- Exhibit 18: Chart on Bargaining power of buyers - Impact of key factors 2021 and 2026
- 4.3 Bargaining power of suppliers
- Exhibit 19: Bargaining power of suppliers - Impact of key factors in 2021 and 2026
- 4.4 Threat of new entrants
- Exhibit 20: Threat of new entrants - Impact of key factors in 2021 and 2026
- 4.5 Threat of substitutes
- Exhibit 21: Threat of substitutes - Impact of key factors in 2021 and 2026
- 4.6 Threat of rivalry
- Exhibit 22: Threat of rivalry - Impact of key factors in 2021 and 2026
- 4.7 Market condition
- Exhibit 23: Chart on Market condition - Five forces 2021 and 2026
5 Market Segmentation by Application
- 5.1 Market segments
- Exhibit 24: Chart on Application - Market share 2021-2026 (%)
- Exhibit 25: Data Table on Application - Market share 2021-2026 (%)
- 5.2 Comparison by Application
- Exhibit 26: Chart on Comparison by Application
- Exhibit 27: Data Table on Comparison by Application
- 5.3 Passenger cars - Market size and forecast 2021-2026
- Exhibit 28: Chart on Passenger cars - Market size and forecast 2021-2026 ($ million)
- Exhibit 29: Data Table on Passenger cars - Market size and forecast 2021-2026 ($ million)
- Exhibit 30: Chart on Passenger cars - Year-over-year growth 2021-2026 (%)
- Exhibit 31: Data Table on Passenger cars - Year-over-year growth 2021-2026 (%)
- 5.4 Commercial vehicles - Market size and forecast 2021-2026
- Exhibit 32: Chart on Commercial vehicles - Market size and forecast 2021-2026 ($ million)
- Exhibit 33: Data Table on Commercial vehicles - Market size and forecast 2021-2026 ($ million)
- Exhibit 34: Chart on Commercial vehicles - Year-over-year growth 2021-2026 (%)
- Exhibit 35: Data Table on Commercial vehicles - Year-over-year growth 2021-2026 (%)
- 5.5 Market opportunity by Application
- Exhibit 36: Market opportunity by Application ($ million)
6 Customer Landscape
- 6.1 Customer landscape overview
- Exhibit 37: Analysis of price sensitivity, lifecycle, customer purchase basket, adoption rates, and purchase criteria
7 Geographic Landscape
- 7.1 Geographic segmentation
- Exhibit 38: Chart on Market share By Geographical Landscape 2021-2026 (%)
- Exhibit 39: Data Table on Market share By Geographical Landscape 2021-2026 (%)
- 7.2 Geographic comparison
- Exhibit 40: Chart on Geographic comparison
- Exhibit 41: Data Table on Geographic comparison
- 7.3 North America - Market size and forecast 2021-2026
- Exhibit 42: Chart on North America - Market size and forecast 2021-2026 ($ million)
- Exhibit 43: Data Table on North America - Market size and forecast 2021-2026 ($ million)
- Exhibit 44: Chart on North America - Year-over-year growth 2021-2026 (%)
- Exhibit 45: Data Table on North America - Year-over-year growth 2021-2026 (%)
- 7.4 Europe - Market size and forecast 2021-2026
- Exhibit 46: Chart on Europe - Market size and forecast 2021-2026 ($ million)
- Exhibit 47: Data Table on Europe - Market size and forecast 2021-2026 ($ million)
- Exhibit 48: Chart on Europe - Year-over-year growth 2021-2026 (%)
- Exhibit 49: Data Table on Europe - Year-over-year growth 2021-2026 (%)
- 7.5 APAC - Market size and forecast 2021-2026
- Exhibit 50: Chart on APAC - Market size and forecast 2021-2026 ($ million)
- Exhibit 51: Data Table on APAC - Market size and forecast 2021-2026 ($ million)
- Exhibit 52: Chart on APAC - Year-over-year growth 2021-2026 (%)
- Exhibit 53: Data Table on APAC - Year-over-year growth 2021-2026 (%)
- 7.6 South America - Market size and forecast 2021-2026
- Exhibit 54: Chart on South America - Market size and forecast 2021-2026 ($ million)
- Exhibit 55: Data Table on South America - Market size and forecast 2021-2026 ($ million)
- Exhibit 56: Chart on South America - Year-over-year growth 2021-2026 (%)
- Exhibit 57: Data Table on South America - Year-over-year growth 2021-2026 (%)
- 7.7 Middle East and Africa - Market size and forecast 2021-2026
- Exhibit 58: Chart on Middle East and Africa - Market size and forecast 2021-2026 ($ million)
- Exhibit 59: Data Table on Middle East and Africa - Market size and forecast 2021-2026 ($ million)
- Exhibit 60: Chart on Middle East and Africa - Year-over-year growth 2021-2026 (%)
- Exhibit 61: Data Table on Middle East and Africa - Year-over-year growth 2021-2026 (%)
- 7.8 US - Market size and forecast 2021-2026
- Exhibit 62: Chart on US - Market size and forecast 2021-2026 ($ million)
- Exhibit 63: Data Table on US - Market size and forecast 2021-2026 ($ million)
- Exhibit 64: Chart on US - Year-over-year growth 2021-2026 (%)
- Exhibit 65: Data Table on US - Year-over-year growth 2021-2026 (%)
- 7.9 China - Market size and forecast 2021-2026
- Exhibit 66: Chart on China - Market size and forecast 2021-2026 ($ million)
- Exhibit 67: Data Table on China - Market size and forecast 2021-2026 ($ million)
- Exhibit 68: Chart on China - Year-over-year growth 2021-2026 (%)
- Exhibit 69: Data Table on China - Year-over-year growth 2021-2026 (%)
- 7.10 UK - Market size and forecast 2021-2026
- Exhibit 70: Chart on UK - Market size and forecast 2021-2026 ($ million)
- Exhibit 71: Data Table on UK - Market size and forecast 2021-2026 ($ million)
- Exhibit 72: Chart on UK - Year-over-year growth 2021-2026 (%)
- Exhibit 73: Data Table on UK - Year-over-year growth 2021-2026 (%)
- 7.11 Germany - Market size and forecast 2021-2026
- Exhibit 74: Chart on Germany - Market size and forecast 2021-2026 ($ million)
- Exhibit 75: Data Table on Germany - Market size and forecast 2021-2026 ($ million)
- Exhibit 76: Chart on Germany - Year-over-year growth 2021-2026 (%)
- Exhibit 77: Data Table on Germany - Year-over-year growth 2021-2026 (%)
- 7.12 Market opportunity By Geographical Landscape
- Exhibit 78: Market opportunity By Geographical Landscape ($ million)
8 Drivers, Challenges, and Trends
- 8.1 Market drivers
- 8.2 Market challenges
- 8.3 Impact of drivers and challenges
- Exhibit 79: Impact of drivers and challenges in 2021 and 2026
- 8.4 Market trends
9 Vendor Landscape
- 9.1 Overview
- 9.2 Vendor landscape
- Exhibit 80: Overview on Criticality of inputs and Factors of differentiation
- 9.3 Landscape disruption
- Exhibit 81: Overview on factors of disruption
- 9.4 Industry risks
- Exhibit 82: Impact of key risks on business
10 Vendor Analysis
- 10.1 Vendors covered
- Exhibit 83: Vendors covered
- 10.2 Market positioning of vendors
- Exhibit 84: Matrix on vendor position and classification
- 10.3 Aisin Corp.
- Exhibit 85: Aisin Corp. - Overview
- Exhibit 86: Aisin Corp. - Business segments
- Exhibit 87: Aisin Corp. - Key offerings
- Exhibit 88: Aisin Corp. - Segment focus
- 10.4 BorgWarner Inc.
- Exhibit 89: BorgWarner Inc. - Overview
- Exhibit 90: BorgWarner Inc. - Business segments
- Exhibit 91: BorgWarner Inc. - Key news
- Exhibit 92: BorgWarner Inc. - Key offerings
- Exhibit 93: BorgWarner Inc. - Segment focus
- 10.5 Schaeffler AG
- Exhibit 94: Schaeffler AG - Overview
- Exhibit 95: Schaeffler AG - Business segments
- Exhibit 96: Schaeffler AG - Key offerings
- Exhibit 97: Schaeffler AG - Segment focus
- 10.6 Sonnax Transmission Co. Inc.
- Exhibit 98: Sonnax Transmission Co. Inc. - Overview
- Exhibit 99: Sonnax Transmission Co. Inc. - Product / Service
- Exhibit 100: Sonnax Transmission Co. Inc. - Key offerings
- 10.7 SUBARU Corp.
- Exhibit 101: SUBARU Corp. - Overview
- Exhibit 102: SUBARU Corp. - Business segments
- Exhibit 103: SUBARU Corp. - Key offerings
- Exhibit 104: SUBARU Corp. - Segment focus
- 10.8 Transtar Industries Inc.
- Exhibit 105: Transtar Industries Inc. - Overview
- Exhibit 106: Transtar Industries Inc. - Product / Service
- Exhibit 107: Transtar Industries Inc. - Key offerings
- 10.9 Valeo SA
- Exhibit 108: Valeo SA - Overview
- Exhibit 109: Valeo SA - Business segments
- Exhibit 110: Valeo SA - Key news
- Exhibit 111: Valeo SA - Key offerings
- Exhibit 112: Valeo SA - Segment focus
- 10.10 Voith GmbH and Co. KGaA
- Exhibit 113: Voith GmbH and Co. KGaA - Overview
- Exhibit 114: Voith GmbH and Co. KGaA - Business segments
- Exhibit 115: Voith GmbH and Co. KGaA - Key offerings
- Exhibit 116: Voith GmbH and Co. KGaA - Segment focus
- 10.11 Yutaka Giken Co. Ltd.
- Exhibit 117: Yutaka Giken Co. Ltd. - Overview
- Exhibit 118: Yutaka Giken Co. Ltd. - Product / Service
- Exhibit 119: Yutaka Giken Co. Ltd. - Key offerings
- 10.12 ZF Friedrichshafen AG
- Exhibit 120: ZF Friedrichshafen AG - Overview
- Exhibit 121: ZF Friedrichshafen AG - Business segments
- Exhibit 122: ZF Friedrichshafen AG - Key news
- Exhibit 123: ZF Friedrichshafen AG - Key offerings
- Exhibit 124: ZF Friedrichshafen AG - Segment focus
11 Appendix
- 11.1 Scope of the report
- 11.2 Inclusions and exclusions checklist
- Exhibit 125: Inclusions checklist
- Exhibit 126: Exclusions checklist
- 11.3 Currency conversion rates for US$
- Exhibit 127: Currency conversion rates for US$
- 11.4 Research methodology
- Exhibit 128: Research methodology
- Exhibit 129: Validation techniques employed for market sizing
- Exhibit 130: Information sources
- 11.5 List of abbreviations
- Exhibit 131: List of abbreviations