|
|
市場調査レポート
商品コード
1076892
フォトンカウンターの世界市場:2022年~2026年Global Photon Counter Market 2022-2026 |
||||||
|
|
|||||||
|
● お客様のご希望に応じて、既存データの加工や未掲載情報(例:国別セグメント)の追加などの対応が可能です。 詳細はお問い合わせください。 |
|||||||


| フォトンカウンターの世界市場:2022年~2026年 |
|
出版日: 2022年05月11日
発行: TechNavio
ページ情報: 英文 120 Pages
納期: 即納可能
|
- 全表示
- 概要
- 図表
- 目次
世界のフォトンカウンターの市場規模は、2022年~2026年の間に4,312万米ドルの増加が見込まれ、予測期間中にCAGRで7.65%の成長が予測されています。
市場は、構造ヘルスモニタリング(SHM)システムの用途拡大、MPCCの関連性の高まり、ヘルスケア産業における開発への注目の高まりによって牽引されています。
当レポートでは、世界のフォトンカウンター市場について調査分析し、市場規模・予測、動向、促進要因、課題、さらに約25社のベンダーを網羅したベンダー分析を提供しています。
目次
第1章 エグゼクティブサマリー
- 市場概要
第2章 市場情勢
- 市場のエコシステム
第3章 市場規模
- 市場の定義
- 市場セグメント分析
- 市場規模:2021年
- 市場の見通し:2021年~2026年の予測
第4章 ファイブフォース分析
- ファイブフォースの要約
- 買い手の交渉力
- サプライヤーの交渉力
- 新興企業の脅威
- 代替品の脅威
- 競合企業の脅威
- 市況
第5章 市場セグメンテーション:エンドユーザー別
- 市場セグメント
- 比較:エンドユーザー別
- 医用画像 - 市場規模と予測:2021年~2026年
- 蛍光顕微鏡 - 市場規模と予測:2021年~2026年
- LiDARとSLR - 市場規模と予測:2021年~2026年
- その他 - 市場規模と予測:2021年~2026年
- 市場機会:エンドユーザー別
第6章 顧客情勢
- 顧客情勢の概要
第7章 地域別情勢
- 地域別セグメンテーション
- 地域別比較
- 北米 - 市場規模と予測:2021年~2026年
- 欧州 - 市場規模と予測:2021年~2026年
- アジア太平洋 - 市場規模と予測:2021年~2026年
- 中東とアフリカ - 市場規模と予測:2021年~2026年
- 南米 - 市場規模と予測:2021年~2026年
- 米国 - 市場規模と予測:2021年~2026年
- ドイツ - 市場規模と予測:2021年~2026年
- 中国 - 市場規模と予測:2021年~2026年
- 英国 - 市場規模と予測:2021年~2026年
- カナダ - 市場規模と予測:2021年~2026年
- 市場機会:地域情勢別
第8章 促進要因、課題、および動向
- 市場促進要因
- 市場の課題
- 促進要因と課題の影響
- 市場動向
第9章 ベンダー情勢
- 概要
- ベンダー情勢
- 混乱の状況
- 業界のリスク
第10章 ベンダー分析
- 対象ベンダー
- ベンダーの市場ポジショニング
- ADVACAM Oy
- Becker and Hickl GmbH
- Hidex Oy
- ID Quantique SA
- Laser Components GmbH
- Micro Photon Devices Srl
- PerkinElmer Inc.
- PicoQuant GmbH
- Thorlabs Inc.
- Tibidabo Scientific Industries Ltd.
第11章 付録
Exhibits:
- Exhibits1: Executive Summary - Chart on Market Overview
- Exhibits2: Executive Summary - Data Table on Market Overview
- Exhibits3: Executive Summary - Chart on Global Market Characteristics
- Exhibits4: Executive Summary - Chart on Market By Geographical Landscape
- Exhibits5: Executive Summary - Chart on Market Segmentation by End-user
- Exhibits6: Executive Summary - Chart on Incremental Growth
- Exhibits7: Executive Summary - Data Table on Incremental Growth
- Exhibits8: Executive Summary - Chart on Vendor Market Positioning
- Exhibits9: Parent market
- Exhibits10: Market Characteristics
- Exhibits11: Offerings of vendors included in the market definition
- Exhibits12: Market segments
- Exhibits13: Chart on Global - Market size and forecast 2021-2026 ($ million)
- Exhibits14: Data Table on Global - Market size and forecast 2021-2026 ($ million)
- Exhibits15: Chart on Global Market: Year-over-year growth 2021-2026 (%)
- Exhibits16: Data Table on Global Market: Year-over-year growth 2021-2026 (%)
- Exhibits17: Five forces analysis - Comparison between 2021 and 2026
- Exhibits18: Chart on Bargaining power of buyers - Impact of key factors 2021 and 2026
- Exhibits19: Bargaining power of suppliers - Impact of key factors in 2021 and 2026
- Exhibits20: Threat of new entrants - Impact of key factors in 2021 and 2026
- Exhibits21: Threat of substitutes - Impact of key factors in 2021 and 2026
- Exhibits22: Threat of rivalry - Impact of key factors in 2021 and 2026
- Exhibits23: Chart on Market condition - Five forces 2021 and 2026
- Exhibits24: Chart on End-user - Market share 2021-2026 (%)
- Exhibits25: Data Table on End-user - Market share 2021-2026 (%)
- Exhibits26: Chart on Comparison by End-user
- Exhibits27: Data Table on Comparison by End-user
- Exhibits28: Chart on Medical imaging - Market size and forecast 2021-2026 ($ million)
- Exhibits29: Data Table on Medical imaging - Market size and forecast 2021-2026 ($ million)
- Exhibits30: Chart on Medical imaging - Year-over-year growth 2021-2026 (%)
- Exhibits31: Data Table on Medical imaging - Year-over-year growth 2021-2026 (%)
- Exhibits32: Chart on Fluorescence microscopy - Market size and forecast 2021-2026 ($ million)
- Exhibits33: Data Table on Fluorescence microscopy - Market size and forecast 2021-2026 ($ million)
- Exhibits34: Chart on Fluorescence microscopy - Year-over-year growth 2021-2026 (%)
- Exhibits35: Data Table on Fluorescence microscopy - Year-over-year growth 2021-2026 (%)
- Exhibits36: Chart on LiDAR and SLR - Market size and forecast 2021-2026 ($ million)
- Exhibits37: Data Table on LiDAR and SLR - Market size and forecast 2021-2026 ($ million)
- Exhibits38: Chart on LiDAR and SLR - Year-over-year growth 2021-2026 (%)
- Exhibits39: Data Table on LiDAR and SLR - Year-over-year growth 2021-2026 (%)
- Exhibits40: Chart on Others - Market size and forecast 2021-2026 ($ million)
- Exhibits41: Data Table on Others - Market size and forecast 2021-2026 ($ million)
- Exhibits42: Chart on Others - Year-over-year growth 2021-2026 (%)
- Exhibits43: Data Table on Others - Year-over-year growth 2021-2026 (%)
- Exhibits44: Market opportunity by End-user ($ million)
- Exhibits45: Analysis of price sensitivity, lifecycle, customer purchase basket, adoption rates, and purchase criteria
- Exhibits46: Chart on Market share By Geographical Landscape 2021-2026 (%)
- Exhibits47: Data Table on Market share By Geographical Landscape 2021-2026 (%)
- Exhibits48: Chart on Geographic comparison
- Exhibits49: Data Table on Geographic comparison
- Exhibits50: Chart on North America - Market size and forecast 2021-2026 ($ million)
- Exhibits51: Data Table on North America - Market size and forecast 2021-2026 ($ million)
- Exhibits52: Chart on North America - Year-over-year growth 2021-2026 (%)
- Exhibits53: Data Table on North America - Year-over-year growth 2021-2026 (%)
- Exhibits54: Chart on Europe - Market size and forecast 2021-2026 ($ million)
- Exhibits55: Data Table on Europe - Market size and forecast 2021-2026 ($ million)
- Exhibits56: Chart on Europe - Year-over-year growth 2021-2026 (%)
- Exhibits57: Data Table on Europe - Year-over-year growth 2021-2026 (%)
- Exhibits58: Chart on APAC - Market size and forecast 2021-2026 ($ million)
- Exhibits59: Data Table on APAC - Market size and forecast 2021-2026 ($ million)
- Exhibits60: Chart on APAC - Year-over-year growth 2021-2026 (%)
- Exhibits61: Data Table on APAC - Year-over-year growth 2021-2026 (%)
- Exhibits62: Chart on Middle East and Africa - Market size and forecast 2021-2026 ($ million)
- Exhibits63: Data Table on Middle East and Africa - Market size and forecast 2021-2026 ($ million)
- Exhibits64: Chart on Middle East and Africa - Year-over-year growth 2021-2026 (%)
- Exhibits65: Data Table on Middle East and Africa - Year-over-year growth 2021-2026 (%)
- Exhibits66: Chart on South America - Market size and forecast 2021-2026 ($ million)
- Exhibits67: Data Table on South America - Market size and forecast 2021-2026 ($ million)
- Exhibits68: Chart on South America - Year-over-year growth 2021-2026 (%)
- Exhibits69: Data Table on South America - Year-over-year growth 2021-2026 (%)
- Exhibits70: Chart on US - Market size and forecast 2021-2026 ($ million)
- Exhibits71: Data Table on US - Market size and forecast 2021-2026 ($ million)
- Exhibits72: Chart on US - Year-over-year growth 2021-2026 (%)
- Exhibits73: Data Table on US - Year-over-year growth 2021-2026 (%)
- Exhibits74: Chart on Germany - Market size and forecast 2021-2026 ($ million)
- Exhibits75: Data Table on Germany - Market size and forecast 2021-2026 ($ million)
- Exhibits76: Chart on Germany - Year-over-year growth 2021-2026 (%)
- Exhibits77: Data Table on Germany - Year-over-year growth 2021-2026 (%)
- Exhibits78: Chart on China - Market size and forecast 2021-2026 ($ million)
- Exhibits79: Data Table on China - Market size and forecast 2021-2026 ($ million)
- Exhibits80: Chart on China - Year-over-year growth 2021-2026 (%)
- Exhibits81: Data Table on China - Year-over-year growth 2021-2026 (%)
- Exhibits82: Chart on UK - Market size and forecast 2021-2026 ($ million)
- Exhibits83: Data Table on UK - Market size and forecast 2021-2026 ($ million)
- Exhibits84: Chart on UK - Year-over-year growth 2021-2026 (%)
- Exhibits85: Data Table on UK - Year-over-year growth 2021-2026 (%)
- Exhibits86: Chart on Canada - Market size and forecast 2021-2026 ($ million)
- Exhibits87: Data Table on Canada - Market size and forecast 2021-2026 ($ million)
- Exhibits88: Chart on Canada - Year-over-year growth 2021-2026 (%)
- Exhibits89: Data Table on Canada - Year-over-year growth 2021-2026 (%)
- Exhibits90: Market opportunity By Geographical Landscape ($ million)
- Exhibits91: Impact of drivers and challenges in 2021 and 2026
- Exhibits92: Overview on Criticality of inputs and Factors of differentiation
- Exhibits93: Overview on factors of disruption
- Exhibits94: Impact of key risks on business
- Exhibits95: Vendors covered
- Exhibits96: Matrix on vendor position and classification
- Exhibits97: ADVACAM Oy - Overview
- Exhibits98: ADVACAM Oy - Product / Service
- Exhibits99: ADVACAM Oy - Key offerings
- Exhibits100: Becker and Hickl GmbH - Overview
- Exhibits101: Becker and Hickl GmbH - Product / Service
- Exhibits102: Becker and Hickl GmbH - Key offerings
- Exhibits103: Hidex Oy - Overview
- Exhibits104: Hidex Oy - Product / Service
- Exhibits105: Hidex Oy - Key offerings
- Exhibits106: ID Quantique SA - Overview
- Exhibits107: ID Quantique SA - Product / Service
- Exhibits108: ID Quantique SA - Key offerings
- Exhibits109: Laser Components GmbH - Overview
- Exhibits110: Laser Components GmbH - Product / Service
- Exhibits111: Laser Components GmbH - Key offerings
- Exhibits112: Micro Photon Devices Srl - Overview
- Exhibits113: Micro Photon Devices Srl - Product / Service
- Exhibits114: Micro Photon Devices Srl - Key offerings
- Exhibits115: PerkinElmer Inc. - Overview
- Exhibits116: PerkinElmer Inc. - Business segments
- Exhibits117: PerkinElmer Inc. - Key news
- Exhibits118: PerkinElmer Inc. - Key offerings
- Exhibits119: PerkinElmer Inc. - Segment focus
- Exhibits120: PicoQuant GmbH - Overview
- Exhibits121: PicoQuant GmbH - Product / Service
- Exhibits122: PicoQuant GmbH - Key offerings
- Exhibits123: Thorlabs Inc. - Overview
- Exhibits124: Thorlabs Inc. - Product / Service
- Exhibits125: Thorlabs Inc. - Key offerings
- Exhibits126: Tibidabo Scientific Industries Ltd. - Overview
- Exhibits127: Tibidabo Scientific Industries Ltd. - Product / Service
- Exhibits128: Tibidabo Scientific Industries Ltd. - Key offerings
- Exhibits129: Inclusions checklist
- Exhibits130: Exclusions checklist
- Exhibits131: Currency conversion rates for US$
- Exhibits132: Research methodology
- Exhibits133: Validation techniques employed for market sizing
- Exhibits134: Information sources
- Exhibits135: List of abbreviations
Technavio has been monitoring the photon counter market and it is poised to grow by $ 43.12 million during 2022-2026, accelerating at a CAGR of 7.65% during the forecast period. Our report on the photon counter market provides a holistic analysis, market size and forecast, trends, growth drivers, and challenges, as well as vendor analysis covering around 25 vendors.
The report offers an up-to-date analysis regarding the current global market scenario, latest trends and drivers, and the overall market environment. The market is driven by growing application of structural health monitoring (SHM) systems, growing relevance of MPCC, and increased focus on development in the healthcare industry.
The photon counter market analysis includes the end-user segment and geographic landscape.
Technavio's photon counter market is segmented as below:
By End-user
- Medical imaging
- Fluorescence microscopy
- LiDAR and SLR
- Others
By Geographical Landscape
- North America
- Europe
- APAC
- Middle East and Africa
- South America
This study identifies the internet of things (IoT) advantage as one of the prime reasons driving the photon counter market growth during the next few years. Also, applications of photon counters in digital holography and the emergence of x-ray photon counting will lead to sizable demand in the market.
Technavio presents a detailed picture of the market by the way of study, synthesis, and summation of data from multiple sources by an analysis of key parameters. Our report on photon counter market covers the following areas:
- Photon counter market sizing
- Photon counter market forecast
- Photon counter market industry analysis
Technavio's robust vendor analysis is designed to help clients improve their market position, and in line with this, this report provides a detailed analysis of several leading photon counter market vendors that include ADVACAM Oy, AUREA Technology, Becker and Hickl GmbH, Hamamatsu Photonics KK, Hidex Oy, ID Quantique SA, Laser Components GmbH, Micro Photon Devices Srl, PerkinElmer Inc., PicoQuant GmbH, Thorlabs Inc., and Tibidabo Scientific Industries Ltd. Also, the photon counter market analysis report includes information on upcoming trends and challenges that will influence market growth. This is to help companies strategize and leverage all forthcoming growth opportunities.
The study was conducted using an objective combination of primary and secondary information including inputs from key participants in the industry. The report contains a comprehensive market and vendor landscape in addition to an analysis of the key vendors.
Technavio presents a detailed picture of the market by the way of study, synthesis, and summation of data from multiple sources by an analysis of key parameters such as profit, pricing, competition, and promotions. It presents various market facets by identifying the key industry influencers. The data presented is comprehensive, reliable, and a result of extensive research - both primary and secondary. Technavio's market research reports provide a complete competitive landscape and an in-depth vendor selection methodology and analysis using qualitative and quantitative research to forecast the accurate market growth.
Table of Contents
1 Executive Summary
- 1.1 Market overview
- Exhibit 01: Executive Summary - Chart on Market Overview
- Exhibit 02: Executive Summary - Data Table on Market Overview
- Exhibit 03: Executive Summary - Chart on Global Market Characteristics
- Exhibit 04: Executive Summary - Chart on Market By Geographical Landscape
- Exhibit 05: Executive Summary - Chart on Market Segmentation by End-user
- Exhibit 06: Executive Summary - Chart on Incremental Growth
- Exhibit 07: Executive Summary - Data Table on Incremental Growth
- Exhibit 08: Executive Summary - Chart on Vendor Market Positioning
2 Market Landscape
- 2.1 Market ecosystem
- Exhibit 09: Parent market
- Exhibit 10: Market Characteristics
3 Market Sizing
- 3.1 Market definition
- Exhibit 11: Offerings of vendors included in the market definition
- 3.2 Market segment analysis
- Exhibit 12: Market segments
- 3.3 Market size 2021
- 3.4 Market outlook: Forecast for 2021-2026
- Exhibit 13: Chart on Global - Market size and forecast 2021-2026 ($ million)
- Exhibit 14: Data Table on Global - Market size and forecast 2021-2026 ($ million)
- Exhibit 15: Chart on Global Market: Year-over-year growth 2021-2026 (%)
- Exhibit 16: Data Table on Global Market: Year-over-year growth 2021-2026 (%)
4 Five Forces Analysis
- 4.1 Five forces summary
- Exhibit 17: Five forces analysis - Comparison between 2021 and 2026
- 4.2 Bargaining power of buyers
- Exhibit 18: Chart on Bargaining power of buyers - Impact of key factors 2021 and 2026
- 4.3 Bargaining power of suppliers
- Exhibit 19: Bargaining power of suppliers - Impact of key factors in 2021 and 2026
- 4.4 Threat of new entrants
- Exhibit 20: Threat of new entrants - Impact of key factors in 2021 and 2026
- 4.5 Threat of substitutes
- Exhibit 21: Threat of substitutes - Impact of key factors in 2021 and 2026
- 4.6 Threat of rivalry
- Exhibit 22: Threat of rivalry - Impact of key factors in 2021 and 2026
- 4.7 Market condition
- Exhibit 23: Chart on Market condition - Five forces 2021 and 2026
5 Market Segmentation by End-user
- 5.1 Market segments
- Exhibit 24: Chart on End-user - Market share 2021-2026 (%)
- Exhibit 25: Data Table on End-user - Market share 2021-2026 (%)
- 5.2 Comparison by End-user
- Exhibit 26: Chart on Comparison by End-user
- Exhibit 27: Data Table on Comparison by End-user
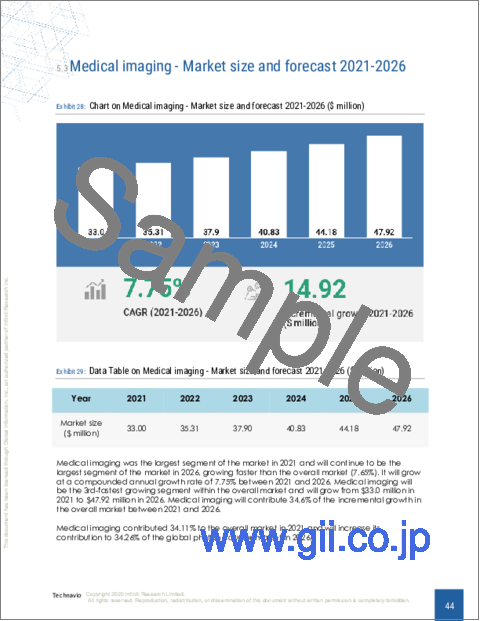
- 5.3 Medical imaging - Market size and forecast 2021-2026
- Exhibit 28: Chart on Medical imaging - Market size and forecast 2021-2026 ($ million)
- Exhibit 29: Data Table on Medical imaging - Market size and forecast 2021-2026 ($ million)
- Exhibit 30: Chart on Medical imaging - Year-over-year growth 2021-2026 (%)
- Exhibit 31: Data Table on Medical imaging - Year-over-year growth 2021-2026 (%)
- 5.4 Fluorescence microscopy - Market size and forecast 2021-2026
- Exhibit 32: Chart on Fluorescence microscopy - Market size and forecast 2021-2026 ($ million)
- Exhibit 33: Data Table on Fluorescence microscopy - Market size and forecast 2021-2026 ($ million)
- Exhibit 34: Chart on Fluorescence microscopy - Year-over-year growth 2021-2026 (%)
- Exhibit 35: Data Table on Fluorescence microscopy - Year-over-year growth 2021-2026 (%)
- 5.5 LiDAR and SLR - Market size and forecast 2021-2026
- Exhibit 36: Chart on LiDAR and SLR - Market size and forecast 2021-2026 ($ million)
- Exhibit 37: Data Table on LiDAR and SLR - Market size and forecast 2021-2026 ($ million)
- Exhibit 38: Chart on LiDAR and SLR - Year-over-year growth 2021-2026 (%)
- Exhibit 39: Data Table on LiDAR and SLR - Year-over-year growth 2021-2026 (%)
- 5.6 Others - Market size and forecast 2021-2026
- Exhibit 40: Chart on Others - Market size and forecast 2021-2026 ($ million)
- Exhibit 41: Data Table on Others - Market size and forecast 2021-2026 ($ million)
- Exhibit 42: Chart on Others - Year-over-year growth 2021-2026 (%)
- Exhibit 43: Data Table on Others - Year-over-year growth 2021-2026 (%)
- 5.7 Market opportunity by End-user
- Exhibit 44: Market opportunity by End-user ($ million)
6 Customer Landscape
- 6.1 Customer landscape overview
- Exhibit 45: Analysis of price sensitivity, lifecycle, customer purchase basket, adoption rates, and purchase criteria
7 Geographic Landscape
- 7.1 Geographic segmentation
- Exhibit 46: Chart on Market share By Geographical Landscape 2021-2026 (%)
- Exhibit 47: Data Table on Market share By Geographical Landscape 2021-2026 (%)
- 7.2 Geographic comparison
- Exhibit 48: Chart on Geographic comparison
- Exhibit 49: Data Table on Geographic comparison
- 7.3 North America - Market size and forecast 2021-2026
- Exhibit 50: Chart on North America - Market size and forecast 2021-2026 ($ million)
- Exhibit 51: Data Table on North America - Market size and forecast 2021-2026 ($ million)
- Exhibit 52: Chart on North America - Year-over-year growth 2021-2026 (%)
- Exhibit 53: Data Table on North America - Year-over-year growth 2021-2026 (%)
- 7.4 Europe - Market size and forecast 2021-2026
- Exhibit 54: Chart on Europe - Market size and forecast 2021-2026 ($ million)
- Exhibit 55: Data Table on Europe - Market size and forecast 2021-2026 ($ million)
- Exhibit 56: Chart on Europe - Year-over-year growth 2021-2026 (%)
- Exhibit 57: Data Table on Europe - Year-over-year growth 2021-2026 (%)
- 7.5 APAC - Market size and forecast 2021-2026
- Exhibit 58: Chart on APAC - Market size and forecast 2021-2026 ($ million)
- Exhibit 59: Data Table on APAC - Market size and forecast 2021-2026 ($ million)
- Exhibit 60: Chart on APAC - Year-over-year growth 2021-2026 (%)
- Exhibit 61: Data Table on APAC - Year-over-year growth 2021-2026 (%)
- 7.6 Middle East and Africa - Market size and forecast 2021-2026
- Exhibit 62: Chart on Middle East and Africa - Market size and forecast 2021-2026 ($ million)
- Exhibit 63: Data Table on Middle East and Africa - Market size and forecast 2021-2026 ($ million)
- Exhibit 64: Chart on Middle East and Africa - Year-over-year growth 2021-2026 (%)
- Exhibit 65: Data Table on Middle East and Africa - Year-over-year growth 2021-2026 (%)
- 7.7 South America - Market size and forecast 2021-2026
- Exhibit 66: Chart on South America - Market size and forecast 2021-2026 ($ million)
- Exhibit 67: Data Table on South America - Market size and forecast 2021-2026 ($ million)
- Exhibit 68: Chart on South America - Year-over-year growth 2021-2026 (%)
- Exhibit 69: Data Table on South America - Year-over-year growth 2021-2026 (%)
- 7.8 US - Market size and forecast 2021-2026
- Exhibit 70: Chart on US - Market size and forecast 2021-2026 ($ million)
- Exhibit 71: Data Table on US - Market size and forecast 2021-2026 ($ million)
- Exhibit 72: Chart on US - Year-over-year growth 2021-2026 (%)
- Exhibit 73: Data Table on US - Year-over-year growth 2021-2026 (%)
- 7.9 Germany - Market size and forecast 2021-2026
- Exhibit 74: Chart on Germany - Market size and forecast 2021-2026 ($ million)
- Exhibit 75: Data Table on Germany - Market size and forecast 2021-2026 ($ million)
- Exhibit 76: Chart on Germany - Year-over-year growth 2021-2026 (%)
- Exhibit 77: Data Table on Germany - Year-over-year growth 2021-2026 (%)
- 7.10 China - Market size and forecast 2021-2026
- Exhibit 78: Chart on China - Market size and forecast 2021-2026 ($ million)
- Exhibit 79: Data Table on China - Market size and forecast 2021-2026 ($ million)
- Exhibit 80: Chart on China - Year-over-year growth 2021-2026 (%)
- Exhibit 81: Data Table on China - Year-over-year growth 2021-2026 (%)
- 7.11 UK - Market size and forecast 2021-2026
- Exhibit 82: Chart on UK - Market size and forecast 2021-2026 ($ million)
- Exhibit 83: Data Table on UK - Market size and forecast 2021-2026 ($ million)
- Exhibit 84: Chart on UK - Year-over-year growth 2021-2026 (%)
- Exhibit 85: Data Table on UK - Year-over-year growth 2021-2026 (%)
- 7.12 Canada - Market size and forecast 2021-2026
- Exhibit 86: Chart on Canada - Market size and forecast 2021-2026 ($ million)
- Exhibit 87: Data Table on Canada - Market size and forecast 2021-2026 ($ million)
- Exhibit 88: Chart on Canada - Year-over-year growth 2021-2026 (%)
- Exhibit 89: Data Table on Canada - Year-over-year growth 2021-2026 (%)
- 7.13 Market opportunity By Geographical Landscape
- Exhibit 90: Market opportunity By Geographical Landscape ($ million)
8 Drivers, Challenges, and Trends
- 8.1 Market drivers
- 8.2 Market challenges
- 8.3 Impact of drivers and challenges
- Exhibit 91: Impact of drivers and challenges in 2021 and 2026
- 8.4 Market trends
9 Vendor Landscape
- 9.1 Overview
- 9.2 Vendor landscape
- Exhibit 92: Overview on Criticality of inputs and Factors of differentiation
- 9.3 Landscape disruption
- Exhibit 93: Overview on factors of disruption
- 9.4 Industry risks
- Exhibit 94: Impact of key risks on business
10 Vendor Analysis
- 10.1 Vendors covered
- Exhibit 95: Vendors covered
- 10.2 Market positioning of vendors
- Exhibit 96: Matrix on vendor position and classification
- 10.3 ADVACAM Oy
- Exhibit 97: ADVACAM Oy - Overview
- Exhibit 98: ADVACAM Oy - Product / Service
- Exhibit 99: ADVACAM Oy - Key offerings
- 10.4 Becker and Hickl GmbH
- Exhibit 100: Becker and Hickl GmbH - Overview
- Exhibit 101: Becker and Hickl GmbH - Product / Service
- Exhibit 102: Becker and Hickl GmbH - Key offerings
- 10.5 Hidex Oy
- Exhibit 103: Hidex Oy - Overview
- Exhibit 104: Hidex Oy - Product / Service
- Exhibit 105: Hidex Oy - Key offerings
- 10.6 ID Quantique SA
- Exhibit 106: ID Quantique SA - Overview
- Exhibit 107: ID Quantique SA - Product / Service
- Exhibit 108: ID Quantique SA - Key offerings
- 10.7 Laser Components GmbH
- Exhibit 109: Laser Components GmbH - Overview
- Exhibit 110: Laser Components GmbH - Product / Service
- Exhibit 111: Laser Components GmbH - Key offerings
- 10.8 Micro Photon Devices Srl
- Exhibit 112: Micro Photon Devices Srl - Overview
- Exhibit 113: Micro Photon Devices Srl - Product / Service
- Exhibit 114: Micro Photon Devices Srl - Key offerings
- 10.9 PerkinElmer Inc.
- Exhibit 115: PerkinElmer Inc. - Overview
- Exhibit 116: PerkinElmer Inc. - Business segments
- Exhibit 117: PerkinElmer Inc. - Key news
- Exhibit 118: PerkinElmer Inc. - Key offerings
- Exhibit 119: PerkinElmer Inc. - Segment focus
- 10.10 PicoQuant GmbH
- Exhibit 120: PicoQuant GmbH - Overview
- Exhibit 121: PicoQuant GmbH - Product / Service
- Exhibit 122: PicoQuant GmbH - Key offerings
- 10.11 Thorlabs Inc.
- Exhibit 123: Thorlabs Inc. - Overview
- Exhibit 124: Thorlabs Inc. - Product / Service
- Exhibit 125: Thorlabs Inc. - Key offerings
- 10.12 Tibidabo Scientific Industries Ltd.
- Exhibit 126: Tibidabo Scientific Industries Ltd. - Overview
- Exhibit 127: Tibidabo Scientific Industries Ltd. - Product / Service
- Exhibit 128: Tibidabo Scientific Industries Ltd. - Key offerings
11 Appendix
- 11.1 Scope of the report
- 11.2 Inclusions and exclusions checklist
- Exhibit 129: Inclusions checklist
- Exhibit 130: Exclusions checklist
- 11.3 Currency conversion rates for US$
- Exhibit 131: Currency conversion rates for US$
- 11.4 Research methodology
- Exhibit 132: Research methodology
- Exhibit 133: Validation techniques employed for market sizing
- Exhibit 134: Information sources
- 11.5 List of abbreviations
- Exhibit 135: List of abbreviations
- of skilled human resource: Test and measurement equipment such as tunable diode laser analyzer (TDLA), optical time-domain reflectometer (OTDR), and process analyzers are required to be used by an expert in chemical and instrumentation engineering. Many of these equipment are used in manufacturing or production process. The individuals using this equipment need to have an overall understanding of the process to operate the equipment efficiently. One of the major challenges to the market is the lack of skilled human resource in the market. In many instances, end-users are not really satisfied with the use of these test and measurement equipment if they were not properly installed, serviced or calibrated properly. This also deters potential buyers to invest in these test and measurement equipment.