|
|
市場調査レポート
商品コード
1072783
ペット用家具の世界市場(2022年~2026年)Global Pet Furniture Market 2022-2026 |
||||||
|
|
|||||||
|
● お客様のご希望に応じて、既存データの加工や未掲載情報(例:国別セグメント)の追加などの対応が可能です。 詳細はお問い合わせください。 |
|||||||


| ペット用家具の世界市場(2022年~2026年) |
|
出版日: 2022年04月28日
発行: TechNavio
ページ情報: 英文 120 Pages
納期: 即納可能
|
- 全表示
- 概要
- 図表
- 目次
世界のペット用家具の市場規模は、2022年から2026年の予測期間中に6.55%のCAGRで推移し、49億5,000万米ドルの成長が予測されています。
同市場の成長を後押しする主な要因には、ファッション性や多機能性を備えた幅広いラインアップのペット用家具が入手可能であること、ペット所有者数の増加とペットへの支出増加、先進国を中心とした世界の高齢化率の上昇などが挙げられます。
当レポートでは、世界のペット用家具市場を調査しており、市場の概要、市場規模や予測、動向、成長要因および課題、顧客情勢、製品・エンドユーザー・地域別の分析、さらにベンダー情勢およびベンダー分析などを提供しています。
目次
第1章 エグゼクティブサマリー
- 市場概要
第2章 市場情勢
- 市場のエコシステム
第3章 市場規模
- 市場の定義
- 市場セグメント分析
- 市場規模:2021年
- 市場の見通し:2021年から2026年の予測
第4章 ファイブフォース分析
- ファイブフォースサマリー
- 買い手の交渉力
- 供給企業の交渉力
- 新規参入業者の脅威
- 代替品の脅威
- ライバルの脅威
- 市況
第5章 製品別の市場内訳
- 市場内訳
- 製品別の比較
- ペットハウス:市場規模と予測(2021年~2026年)
- ペット用ベッドとソファ:市場規模と予測(2021年~2026年)
- ペット用ツリーとマンション:市場規模と予測(2021年~2026年)
- その他:市場規模と予測(2021年~2026年)
- 製品別の市場機会
第6章 エンドユーザー別の市場内訳
- 市場内訳
- エンドユーザー別比較
- 犬:市場規模と予測(2021年~2026年)
- 猫:市場規模と予測(2021年~2026年)
- その他:市場規模と予測(2021年~2026年)
- エンドユーザー別市場機会
第7章 顧客情勢
- 顧客情勢の概要
第8章 地域別情勢
- 地域別セグメンテーション
- 地域別比較
- 北米:市場規模と予測(2021年~2026年)
- 欧州:市場規模と予測(2021年~2026年)
- アジア太平洋:市場規模と予測(2021年~2026年)
- 南米:市場規模と予測(2021年~2026年)
- 中東・アフリカ:市場規模と予測(2021年~2026年)
- 米国:市場規模と予測(2021年~2026年)
- 中国:市場規模と予測(2021年~2026年)
- フランス:市場規模と予測(2021年~2026年)
- ブラジル:市場規模と予測(2021年~2026年)
- ドイツ:市場規模と予測(2021年~2026年)
- 地域情勢別の市場機会
第9章 成長要因、課題、動向
- 市場促進要因
- 市場の課題
- 成長要因と課題の影響
- 市場動向
第10章 ベンダー情勢
- 概要
- ベンダー情勢
- 混乱情勢
- 業界のリスク
第11章 ベンダー分析
- 対象ベンダー
- ベンダーの市場ポジショニング
- Doskocil Manufacturing Co. Inc.
- Go Pet Club
- Hangzhou Tianyuan Pet ProductsCo.Ltd.
- Inter IKEAHoldingBV
- MiaCara GmbH andCo.KG
- MidWest Homes for Pets
- North American Pet Products
- PetPals Group Inc.
- Prevue Pet Products
- Ware Manufacturing Inc.
第12章 付録
- 調査範囲
- 包含および除外チェックリスト
- 米ドルの通貨換算レート
- 調査手法
- 略語のリスト
図表:
- 図表1:エグゼクティブサマリー:市場概要のチャート
- 図表2:エグゼクティブサマリー:市場概要に関するデータテーブル
- 図表3:エグゼクティブサマリー:世界市場の特徴に関するチャート
- 図表4:エグゼクティブサマリー:地域別情勢の市場チャート
- 図表5:エグゼクティブサマリー:製品別の市場内訳に関するチャート
- 図表6:エグゼクティブサマリー:エンドユーザー別の市場内訳に関するチャート
- 図表7:エグゼクティブサマリー:増分成長に関するチャート
- 図表8:エグゼクティブサマリー:増分成長に関するデータテーブル
- 図表9:エグゼクティブサマリー:ベンダー市場のポジショニングに関するチャート
- 図表10:親市場
- 図表11:市場の特徴
- 図表12:市場定義に含まれるベンダーの提供
- 図表13:市場セグメント
- 図表14:世界のチャート:市場規模と予測(2021年~2026年)
- 図表15:世界のに関するデータ表:市場規模と予測(2021年~2026年)
- 図表16:世界市場のチャート:前年比成長率(2021年~2026年)
- 図表17:世界市場のデータ表:前年比成長(2021年~2026年)
- 図表18:ファイブフォース分析:2021年と2026年の比較
- 図表19:買い手の交渉力に関するチャート:2021年と2026年の主要な要因の影響
- 図表20:供給企業の交渉力:2021年と2026年の主要な要因の影響
- 図表21:新規参入業者の脅威:2021年と2026年の主要な要因の影響
- 図表22:代替品の脅威:2021年と2026年の主要な要因の影響
- 図表23:競争の脅威:2021年と2026年の主要な要因の影響
- 図表24:市況のチャート:2021年と2026年の5つの力
- 図表25:製品のチャート:市場シェア(2021年~2026年)
- 図表26:製品のデータ表:市場シェア(2021年~2026年)
- 図表27:製品別比較表
- 図表28:製品別の比較に関するデータ表
- 図表29:ペットハウスのチャート:市場規模と予測(2021年~2026年)
- 図表30:ペットハウスのデータ表:市場規模と予測(2021年~2026年)
- 図表31:ペットハウスのチャート:前年比成長率(2021年~2026年)
- 図表32:ペットハウスのデータ表:前年比成長率(2021年~2026年)
- 図表33:ペット用ベッドとソファのチャート:市場規模と予測(2021年~2026年)
- 図表34:ペット用ベッドとソファのデータ表:市場規模と予測(2021年~2026年)
- 図表35:ペット用ベッドとソファのチャート:前年比成長率(2021年~2026年)
- 図表36:ペット用ベッドとソファのデータ表:前年比成長率(2021年~2026年)
- 図表37:ペット用ツリーとマンションのチャート:市場規模と予測(2021年~2026年)
- 図表38:ペット用ツリーとマンションのデータ表:市場規模と予測(2021年~2026年)
- 図表39:ペット用ツリーとマンションのチャート:前年比成長率(2021年~2026年)
- 図表40:ペット用ツリーとマンションのデータ表:前年比成長率(2021年~2026年)
- 図表41:その他のチャート:市場規模と予測(2021年~2026年)
- 図表42:その他のデータ表:市場規模と予測(2021年~2026年)
- 図表43:その他のチャート:前年比成長率(2021年~2026年)
- 図表44:その他のデータ表:前年比成長率(2021年~2026年)
- 図表45:製品別の市場機会(百万米ドル)
- 図表46:エンドユーザーのチャート:市場シェア(2021年~2026年)
- 図表47:エンドユーザーのデータ表:市場シェア(2021年~2026年)
- 図表48:エンドユーザー別比較のチャート
- 図表49:エンドユーザー別比較に関するデータ表
- 図表50:犬のチャート:市場規模と予測(2021年~2026年)
- 図表51:犬のデータ表:市場規模と予測(2021年~2026年)
- 図表52:犬のチャート:前年比成長率(2021年~2026年)
- 図表53:犬のデータ表:前年比成長率(2021年~2026年)
- 図表54:猫のチャート:市場規模と予測(2021年~2026年)
- 図表55:猫のデータ表:市場規模と予測(2021年~2026年)
- 図表56:猫のチャート:前年比成長率(2021年~2026年)
- 図表57:猫のデータ表:前年比成長率(2021年~2026年)
- 図表58:その他のチャート:市場規模と予測(2021年~2026年)
- 図表59:その他のデータ表:市場規模と予測(2021年~2026年)
- 図表60:その他のチャート:前年比成長率(2021年~2026年)
- 図表61:その他のデータ表:前年比成長率(2021年~2026年)
- 図表62:エンドユーザー別市場機会
- 図表63:価格感応度、ライフサイクル、顧客購入バスケット、採用率、購入基準の分析
- 図表64:地域情勢別の市場シェアのチャート(2021年~2026年)
- 図表65:地域情勢別の市場シェアのデータ表(2021年~2026年)
- 図表66:地域別比較のチャート
- 図表67:地域別比較に関するデータ表
- 図表68:北米のチャート:市場規模と予測(2021年~2026年)
- 図表69:北米のデータ表:市場規模と予測(2021年~2026年)
- 図表70:北米のチャート:前年比成長率(2021年~2026年)
- 図表71:北米のデータ表:前年比成長率(2021年~2026年)
- 図表72:欧州のチャート:市場規模と予測(2021年~2026年)
- 図表73:欧州のデータ表:市場規模と予測(2021年~2026年)
- 図表74:欧州のチャート:前年比成長(2021年~2026年)
- 図表75:欧州のデータ表:前年比成長率(2021年~2026年)
- 図表76:アジア太平洋のチャート:市場規模と予測(2021年~2026年)
- 図表77:アジア太平洋のデータ表:市場規模と予測(2021年~2026年)
- 図表78:アジア太平洋のチャート:前年比成長率(2021年~2026年)
- 図表79:アジア太平洋のデータ表:前年比成長率(2021年~2026年)
- 図表80:南米のチャート:市場規模と予測(2021年~2026年)
- 図表81:南米のデータ表:市場規模および予測(2021年~2026年)
- 図表82:南米のチャート:前年比成長(2021年~2026年)
- 図表83:南米のデータ表:前年比成長(2021年~2026年)
- 図表84:中東・アフリカのチャート:市場規模と予測(2021年~2026年)
- 図表85:中東・アフリカのデータ表:市場規模および予測(2021年~2026年)
- 図表86:中東・アフリカのチャート:前年比成長率(2021年~2026年)
- 図表87:中東・アフリカのデータ表:前年比成長率(2021年~2026年)
- 図表88:米国のチャート:市場規模と予測(2021年~2026年)
- 図表89:米国のデータ表:市場規模と予測(2021年~2026年)
- 図表90:米国のチャート:前年比成長率(2021年~2026年)
- 図表91:米国のデータ表:前年比成長率(2021年~2026年)
- 図表92:中国のチャート:市場規模と予測(2021年~2026年)
- 図表93:中国のデータ表:市場規模と予測(2021年~2026年)
- 図表94:中国のチャート:前年比成長率(2021年~2026年)
- 図表95:中国のデータ表:前年比成長率(2021年~2026年)
- 図表96:フランスのチャート:市場規模と予測(2021年~2026年)
- 図表97:フランスのデータテーブル:市場規模と予測(2021年~2026年)
- 図表98:フランスのチャート:前年比成長率(2021年~2026年)
- 図表99:フランスのデータ表:前年比成長率(2021年~2026年)
- 図表100:ブラジルのチャート:市場規模と予測(2021年~2026年)
- 図表101:ブラジルのデータテーブル:市場規模と予測(2021年~2026年)
- 図表102:ブラジルのチャート:前年比成長率(2021年~2026年)
- 図表103:ブラジルのデータ表:前年比成長率(2021年~2026年)
- 図表104:ドイツのチャート:市場規模と予測(2021年~2026年)
- 図表105:ドイツのデータ表:市場規模と予測(2021年~2026年)
- 図表106:ドイツのチャート:前年比成長率(2021年~2026年)
- 図表107:ドイツのデータ表:前年比成長率(2021年~2026年)
- 図表108:地域情勢別の市場機会
- 図表109:2021年と2026年の成長要因と課題の影響
- 図表110:インプットの重要性と差別化の要因に関する概要
- 図表111:混乱の要因の概要
- 図表112:主要なリスクがビジネスに与える影響
- 図表113:対象ベンダー
- 図表114:ベンダーの位置と分類に関するマトリックス
- 図表115:Doskocil Manufacturing Co. Inc.:概要
- 図表116:Doskocil Manufacturing Co. Inc.:製品/サービス
- 図表117:Doskocil Manufacturing Co. Inc.:主な製品
- 図表118:Go Pet Club:概要
- 図表119:Go Pet Club:製品/サービス
- 図表120:Go Pet Club:主なサービス
- 図表121:Hangzhou Tianyuan Pet ProductsCo.Ltd.:概要
- 図表122:Hangzhou Tianyuan Pet ProductsCo.Ltd.:製品/サービス
- 図表123:Hangzhou Tianyuan Pet ProductsCo.Ltd.:主な製品
- 図表124:Inter IKEAHoldingBV:概要
- 図表125:Inter IKEAHoldingBV:製品/サービス
- 図表126:Inter IKEAHoldingBV:重要なニュース
- 図表127:Inter IKEAHoldingBV:主な製品
- 図表128:MiaCara GmbH andCo.KG:概要
- 図表129:MiaCara GmbH andCo.KG:製品/サービス
- 図表130:MiaCara GmbH andCo.KG:主な製品
- 図表131:MidWest Homes for Pets:概要
- 図表132:MidWest Homes for Pets:製品/サービス
- 図表133:MidWest Homes for Pets:主な提供物
- 図表134:North American Pet Products:概要
- 図表135:North American Pet Products:製品/サービス
- 図表136:North American Pet Products:主な製品
- 図表137:PetPals Group Inc.:概要
- 図表138:PetPals Group Inc.:製品/サービス
- 図表139:PetPals Group Inc.:主な製品
- 図表140:PrevuePetProducts:概要
- 図表141:PrevuePetProducts:製品/サービス
- 図表142:PrevuePetProducts:主な製品
- 図表143:Ware Manufacturing Inc.:概要
- 図表144:Ware Manufacturing Inc.:製品/サービス
- 図表145:Ware Manufacturing Inc.:主な製品
- 図表146:包含チェックリスト
- 図表147:除外チェックリスト
- 図表148:米ドルの通貨換算レート
- 図表149:調査手法
- 図表150:市場のサイジングに採用された検証手法
- 図表151:情報源
- 図表152:略語のリスト
Exhibits:
- Exhibits1: Executive Summary - Chart on Market Overview
- Exhibits2: Executive Summary - Data Table on Market Overview
- Exhibits3: Executive Summary - Chart on Global Market Characteristics
- Exhibits4: Executive Summary - Chart on Market By Geographical Landscape
- Exhibits5: Executive Summary - Chart on Market Segmentation by Product
- Exhibits6: Executive Summary - Chart on Market Segmentation by End-user
- Exhibits7: Executive Summary - Chart on Incremental Growth
- Exhibits8: Executive Summary - Data Table on Incremental Growth
- Exhibits9: Executive Summary - Chart on Vendor Market Positioning
- Exhibits10: Parent market
- Exhibits11: Market Characteristics
- Exhibits12: Offerings of vendors included in the market definition
- Exhibits13: Market segments
- Exhibits14: Chart on Global - Market size and forecast 2021-2026 ($ million)
- Exhibits15: Data Table on Global - Market size and forecast 2021-2026 ($ million)
- Exhibits16: Chart on Global Market: Year-over-year growth 2021-2026 (%)
- Exhibits17: Data Table on Global Market: Year-over-year growth 2021-2026 (%)
- Exhibits18: Five forces analysis - Comparison between2021 and 2026
- Exhibits19: Chart on Bargaining power of buyers - Impact of key factors 2021 and 2026
- Exhibits20: Bargaining power of suppliers - Impact of key factors in 2021 and 2026
- Exhibits21: Threat of new entrants - Impact of key factors in 2021 and 2026
- Exhibits22: Threat of substitutes - Impact of key factors in 2021 and 2026
- Exhibits23: Threat of rivalry - Impact of key factors in 2021 and 2026
- Exhibits24: Chart on Market condition - Five forces 2021 and 2026
- Exhibits25: Chart on Product - Market share 2021-2026 (%)
- Exhibits26: Data Table on Product - Market share 2021-2026 (%)
- Exhibits27: Chart on Comparison by Product
- Exhibits28: Data Table on Comparison by Product
- Exhibits29: Chart on Pet house - Market size and forecast 2021-2026 ($ million)
- Exhibits30: Data Table on Pet house - Market size and forecast 2021-2026 ($ million)
- Exhibits31: Chart on Pet house - Year-over-year growth 2021-2026 (%)
- Exhibits32: Data Table on Pet house - Year-over-year growth 2021-2026 (%)
- Exhibits33: Chart on Pet bed and sofa - Market size and forecast 2021-2026 ($ million)
- Exhibits34: Data Table on Pet bed and sofa - Market size and forecast 2021-2026 ($ million)
- Exhibits35: Chart on Pet bed and sofa - Year-over-year growth 2021-2026 (%)
- Exhibits36: Data Table on Pet bed and sofa - Year-over-year growth 2021-2026 (%)
- Exhibits37: Chart on Pet tree and condo - Market size and forecast 2021-2026 ($ million)
- Exhibits38: Data Table on Pet tree and condo - Market size and forecast 2021-2026 ($ million)
- Exhibits39: Chart on Pet tree and condo - Year-over-year growth 2021-2026 (%)
- Exhibits40: Data Table on Pet tree and condo - Year-over-year growth 2021-2026 (%)
- Exhibits41: Chart on Others - Market size and forecast 2021-2026 ($ million)
- Exhibits42: Data Table on Others - Market size and forecast 2021-2026 ($ million)
- Exhibits43: Chart on Others - Year-over-year growth 2021-2026 (%)
- Exhibits44: Data Table on Others - Year-over-year growth 2021-2026 (%)
- Exhibits45: Market opportunity by Product ($ million)
- Exhibits46: Chart on End-user - Market share 2021-2026 (%)
- Exhibits47: Data Table on End-user - Market share 2021-2026 (%)
- Exhibits48: Chart on Comparison by End-user
- Exhibits49: Data Table on Comparison by End-user
- Exhibits50: Chart on Dogs - Market size and forecast 2021-2026 ($ million)
- Exhibits51: Data Table on Dogs - Market size and forecast 2021-2026 ($ million)
- Exhibits52: Chart on Dogs - Year-over-year growth 2021-2026 (%)
- Exhibits53: Data Table on Dogs - Year-over-year growth 2021-2026 (%)
- Exhibits54: Chart on Cats - Market size and forecast 2021-2026 ($ million)
- Exhibits55: Data Table on Cats - Market size and forecast 2021-2026 ($ million)
- Exhibits56: Chart on Cats - Year-over-year growth 2021-2026 (%)
- Exhibits57: Data Table on Cats - Year-over-year growth 2021-2026 (%)
- Exhibits58: Chart on Others - Market size and forecast 2021-2026 ($ million)
- Exhibits59: Data Table on Others - Market size and forecast 2021-2026 ($ million)
- Exhibits60: Chart on Others - Year-over-year growth 2021-2026 (%)
- Exhibits61: Data Table on Others - Year-over-year growth 2021-2026 (%)
- Exhibits62: Market opportunity by End-user ($ million)
- Exhibits63: Analysis of price sensitivity, lifecycle, customer purchase basket, adoption rates, and purchase criteria
- Exhibits64: Chart on Market share By Geographical Landscape 2021-2026 (%)
- Exhibits65: Data Table on Market share By Geographical Landscape 2021-2026 (%)
- Exhibits66: Chart on Geographic comparison
- Exhibits67: Data Table on Geographic comparison
- Exhibits68: Chart on North America - Market size and forecast 2021-2026 ($ million)
- Exhibits69: Data Table on North America - Market size and forecast 2021-2026 ($ million)
- Exhibits70: Chart on North America - Year-over-year growth 2021-2026 (%)
- Exhibits71: Data Table on North America - Year-over-year growth 2021-2026 (%)
- Exhibits72: Chart on Europe - Market size and forecast 2021-2026 ($ million)
- Exhibits73: Data Table on Europe - Market size and forecast 2021-2026 ($ million)
- Exhibits74: Chart on Europe - Year-over-year growth 2021-2026 (%)
- Exhibits75: Data Table on Europe - Year-over-year growth 2021-2026 (%)
- Exhibits76: Chart on APAC - Market size and forecast 2021-2026 ($ million)
- Exhibits77: Data Table on APAC - Market size and forecast 2021-2026 ($ million)
- Exhibits78: Chart on APAC - Year-over-year growth 2021-2026 (%)
- Exhibits79: Data Table on APAC - Year-over-year growth 2021-2026 (%)
- Exhibits80: Chart on South America - Market size and forecast 2021-2026 ($ million)
- Exhibits81: Data Table on South America - Market size and forecast 2021-2026 ($ million)
- Exhibits82: Chart on South America - Year-over-year growth 2021-2026 (%)
- Exhibits83: Data Table on South America - Year-over-year growth 2021-2026 (%)
- Exhibits84: Chart on Middle East and Africa - Market size and forecast 2021-2026 ($ million)
- Exhibits85: Data Table on Middle East and Africa - Market size and forecast 2021-2026 ($ million)
- Exhibits86: Chart on Middle East and Africa - Year-over-year growth 2021-2026 (%)
- Exhibits87: Data Table on Middle East and Africa - Year-over-year growth 2021-2026 (%)
- Exhibits88: Chart on US - Market size and forecast 2021-2026 ($ million)
- Exhibits89: Data Table on US - Market size and forecast 2021-2026 ($ million)
- Exhibits90: Chart on US - Year-over-year growth 2021-2026 (%)
- Exhibits91: Data Table on US - Year-over-year growth 2021-2026 (%)
- Exhibits92: Chart on China - Market size and forecast 2021-2026 ($ million)
- Exhibits93: Data Table on China - Market size and forecast 2021-2026 ($ million)
- Exhibits94: Chart on China - Year-over-year growth 2021-2026 (%)
- Exhibits95: Data Table on China - Year-over-year growth 2021-2026 (%)
- Exhibits96: Chart on France - Market size and forecast 2021-2026 ($ million)
- Exhibits97: Data Table on France - Market size and forecast 2021-2026 ($ million)
- Exhibits98: Chart on France - Year-over-year growth 2021-2026 (%)
- Exhibits99: Data Table on France - Year-over-year growth 2021-2026 (%)
- Exhibits100: Chart on Brazil - Market size and forecast 2021-2026 ($ million)
- Exhibits101: Data Table on Brazil - Market size and forecast 2021-2026 ($ million)
- Exhibits102: Chart on Brazil - Year-over-year growth 2021-2026 (%)
- Exhibits103: Data Table on Brazil - Year-over-year growth 2021-2026 (%)
- Exhibits104: Chart on Germany - Market size and forecast 2021-2026 ($ million)
- Exhibits105: Data Table on Germany - Market size and forecast 2021-2026 ($ million)
- Exhibits106: Chart on Germany - Year-over-year growth 2021-2026 (%)
- Exhibits107: Data Table on Germany - Year-over-year growth 2021-2026 (%)
- Exhibits108: Market opportunity By Geographical Landscape ($ million)
- Exhibits109: Impact of drivers and challenges in 2021 and 2026
- Exhibits110: Overview on Criticality of inputs and Factors of differentiation
- Exhibits111: Overview on factors of disruption
- Exhibits112: Impact of key risks on business
- Exhibits113: Vendors covered
- Exhibits114: Matrix on vendor position and classification
- Exhibits115: Doskocil Manufacturing Co. Inc. - Overview
- Exhibits116: Doskocil Manufacturing Co. Inc. - Product / Service
- Exhibits117: Doskocil Manufacturing Co. Inc. - Key offerings
- Exhibits118: Go Pet Club - Overview
- Exhibits119: Go Pet Club - Product / Service
- Exhibits120: Go Pet Club - Key offerings
- Exhibits121: Hangzhou Tianyuan Pet Products Co. Ltd. - Overview
- Exhibits122: Hangzhou Tianyuan Pet Products Co. Ltd. - Product / Service
- Exhibits123: Hangzhou Tianyuan Pet Products Co. Ltd. - Key offerings
- Exhibits124: Inter IKEA Holding BV - Overview
- Exhibits125: Inter IKEA Holding BV - Product / Service
- Exhibits126: Inter IKEA Holding BV - Key news
- Exhibits127: Inter IKEA Holding BV - Key offerings
- Exhibits128: MiaCara GmbH and Co. KG - Overview
- Exhibits129: MiaCara GmbH and Co. KG - Product / Service
- Exhibits130: MiaCara GmbH and Co. KG - Key offerings
- Exhibits131: MidWest Homes for Pets - Overview
- Exhibits132: MidWest Homes for Pets - Product / Service
- Exhibits133: MidWest Homes for Pets - Key offerings
- Exhibits134: North American Pet Products - Overview
- Exhibits135: North American Pet Products - Product / Service
- Exhibits136: North American Pet Products - Key offerings
- Exhibits137: PetPals Group Inc. - Overview
- Exhibits138: PetPals Group Inc. - Product / Service
- Exhibits139: PetPals Group Inc. - Key offerings
- Exhibits140: Prevue Pet Products - Overview
- Exhibits141: Prevue Pet Products - Product / Service
- Exhibits142: Prevue Pet Products - Key offerings
- Exhibits143: Ware Manufacturing Inc. - Overview
- Exhibits144: Ware Manufacturing Inc. - Product / Service
- Exhibits145: Ware Manufacturing Inc. - Key offerings
- Exhibits146: Inclusions checklist
- Exhibits147: Exclusions checklist
- Exhibits148: Currency conversion rates for US$
- Exhibits149: Research methodology
- Exhibits150: Validation techniques employed for market sizing
- Exhibits151: Information sources
- Exhibits152: List of abbreviations
Technavio has been monitoring the pet furniture market and it is poised to grow by $ 4.95 bn during 2022-2026, accelerating at a CAGR of 6.55% during the forecast period. Our report on the pet furniture market provides a holistic analysis, market size and forecast, trends, growth drivers, and challenges, as well as vendor analysis covering around 25 vendors.
The report offers an up-to-date analysis regarding the current global market scenario, the latest trends and drivers, and the overall market environment. The market is driven by availability of a wide range of fashionable and multifunctional pet furniture, increase in the number of pet owners and increased spending on pets, and rise in the aging population globally, especially in developed countries.
The pet furniture market analysis includes the product, end-user segment and geographic landscape.
Technavio's pet furniture market is segmented as below:
By Product
- Pet house
- Pet bed and sofa
- Pet tree and condo
- Others
By End-user
- Dogs
- Cats,
- Others
By Geographical Landscape
- North America
- Europe
- APAC
- South America
- The Middle East and Africa
This study identifies the advent of smart pet beds as one of the prime reasons driving the pet furniture market growth during the next few years. Also, the popularity of customization in pet furniture and the growing inclination toward product premiumization will lead to sizable demand in the market.
Technavio presents a detailed picture of the market by the way of study, synthesis, and summation of data from multiple sources by an analysis of key parameters. Our report on the pet furniture market covers the following areas:
- Pet furniture market sizing
- Pet furniture market forecast
- Pet furniture market industry analysis
Technavio's robust vendor analysis is designed to help clients improve their market position, and in line with this, this report provides a detailed analysis of several leading pet furniture market vendors that include Catipilla Ltd., Central Garden, and Pet Co., Designer Pet Products, Doskocil Manufacturing Co. Inc., Enchanted Home Pet, Fantasy Manufacturing Ltd., Go Pet Club, Hangzhou Tianyuan Pet Products Co. Ltd., Inter IKEA Holding BV, Kitty Mansions, Lord Lou, Meyou Paris SAS, MiaCara GmbH and Co. KG, MidWest Homes for Pets, North American Pet Products, Omega Paw Inc., PetPals Group Inc., Petz Podz Ltd., Prevue Pet Products, and Ware Manufacturing Inc. Also, the pet furniture market analysis report includes information on upcoming trends and challenges that will influence market growth. This is to help companies strategize and leverage all forthcoming growth opportunities.
The study was conducted using an objective combination of primary and secondary information including inputs from key participants in the industry. The report contains a comprehensive market and vendor landscape in addition to an analysis of the key vendors.
Technavio presents a detailed picture of the market by the way of study, synthesis, and summation of data from multiple sources by an analysis of key parameters such as profit, pricing, competition, and promotions. It presents various market facets by identifying the key industry influencers. The data presented is comprehensive, reliable, and a result of extensive research - both primary and secondary. Technavio's market research reports provide a complete competitive landscape and an in-depth vendor selection methodology and analysis using qualitative and quantitative research to forecast accurate market growth.
Table of Contents
1 Executive Summary
- 1.1 Market overview
- Exhibit 01: Executive Summary - Chart on Market Overview
- Exhibit 02: Executive Summary - Data Table on Market Overview
- Exhibit 03: Executive Summary - Chart on Global Market Characteristics
- Exhibit 04: Executive Summary - Chart on Market By Geographical Landscape
- Exhibit 05: Executive Summary - Chart on Market Segmentation by Product
- Exhibit 06: Executive Summary - Chart on Market Segmentation by End-user
- Exhibit 07: Executive Summary - Chart on Incremental Growth
- Exhibit 08: Executive Summary - Data Table on Incremental Growth
- Exhibit 09: Executive Summary - Chart on Vendor Market Positioning
2 Market Landscape
- 2.1 Market ecosystem
- Exhibit 10: Parent market
- Exhibit 11: Market Characteristics
3 Market Sizing
- 3.1 Market definition
- Exhibit 12: Offerings of vendors included in the market definition
- 3.2 Market segment analysis
- Exhibit 13: Market segments
- 3.3 Market size 2021
- 3.4 Market outlook: Forecast for 2021-2026
- Exhibit 14: Chart on Global - Market size and forecast 2021-2026 ($ million)
- Exhibit 15: Data Table on Global - Market size and forecast 2021-2026 ($ million)
- Exhibit 16: Chart on Global Market: Year-over-year growth 2021-2026 (%)
- Exhibit 17: Data Table on Global Market: Year-over-year growth 2021-2026 (%)
4 Five Forces Analysis
- 4.1 Five forces summary
- Exhibit 18: Five forces analysis - Comparison between2021 and 2026
- 4.2 Bargaining power of buyers
- Exhibit 19: Chart on Bargaining power of buyers - Impact of key factors 2021 and 2026
- 4.3 Bargaining power of suppliers
- Exhibit 20: Bargaining power of suppliers - Impact of key factors in 2021 and 2026
- 4.4 Threat of new entrants
- Exhibit 21: Threat of new entrants - Impact of key factors in 2021 and 2026
- 4.5 Threat of substitutes
- Exhibit 22: Threat of substitutes - Impact of key factors in 2021 and 2026
- 4.6 Threat of rivalry
- Exhibit 23: Threat of rivalry - Impact of key factors in 2021 and 2026
- 4.7 Market condition
- Exhibit 24: Chart on Market condition - Five forces 2021 and 2026
5 Market Segmentation by Product
- 5.1 Market segments
- Exhibit 25: Chart on Product - Market share 2021-2026 (%)
- Exhibit 26: Data Table on Product - Market share 2021-2026 (%)
- 5.2 Comparison by Product
- Exhibit 27: Chart on Comparison by Product
- Exhibit 28: Data Table on Comparison by Product
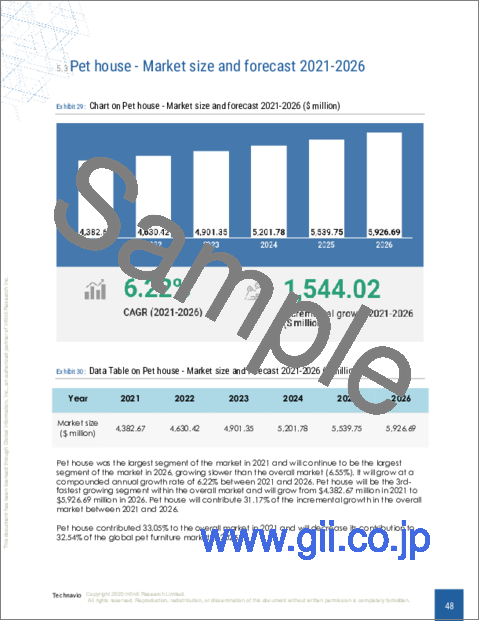
- 5.3 Pet house - Market size and forecast 2021-2026
- Exhibit 29: Chart on Pet house - Market size and forecast 2021-2026 ($ million)
- Exhibit 30: Data Table on Pet house - Market size and forecast 2021-2026 ($ million)
- Exhibit 31: Chart on Pet house - Year-over-year growth 2021-2026 (%)
- Exhibit 32: Data Table on Pet house - Year-over-year growth 2021-2026 (%)
- 5.4 Pet bed and sofa - Market size and forecast 2021-2026
- Exhibit 33: Chart on Pet bed and sofa - Market size and forecast 2021-2026 ($ million)
- Exhibit 34: Data Table on Pet bed and sofa - Market size and forecast 2021-2026 ($ million)
- Exhibit 35: Chart on Pet bed and sofa - Year-over-year growth 2021-2026 (%)
- Exhibit 36: Data Table on Pet bed and sofa - Year-over-year growth 2021-2026 (%)
- 5.5 Pet tree and condo - Market size and forecast 2021-2026
- Exhibit 37: Chart on Pet tree and condo - Market size and forecast 2021-2026 ($ million)
- Exhibit 38: Data Table on Pet tree and condo - Market size and forecast 2021-2026 ($ million)
- Exhibit 39: Chart on Pet tree and condo - Year-over-year growth 2021-2026 (%)
- Exhibit 40: Data Table on Pet tree and condo - Year-over-year growth 2021-2026 (%)
- 5.6 Others - Market size and forecast 2021-2026
- Exhibit 41: Chart on Others - Market size and forecast 2021-2026 ($ million)
- Exhibit 42: Data Table on Others - Market size and forecast 2021-2026 ($ million)
- Exhibit 43: Chart on Others - Year-over-year growth 2021-2026 (%)
- Exhibit 44: Data Table on Others - Year-over-year growth 2021-2026 (%)
- 5.7 Market opportunity by Product
- Exhibit 45: Market opportunity by Product ($ million)
6 Market Segmentation by End-user
- 6.1 Market segments
- Exhibit 46: Chart on End-user - Market share 2021-2026 (%)
- Exhibit 47: Data Table on End-user - Market share 2021-2026 (%)
- 6.2 Comparison by End-user
- Exhibit 48: Chart on Comparison by End-user
- Exhibit 49: Data Table on Comparison by End-user
- 6.3 Dogs - Market size and forecast 2021-2026
- Exhibit 50: Chart on Dogs - Market size and forecast 2021-2026 ($ million)
- Exhibit 51: Data Table on Dogs - Market size and forecast 2021-2026 ($ million)
- Exhibit 52: Chart on Dogs - Year-over-year growth 2021-2026 (%)
- Exhibit 53: Data Table on Dogs - Year-over-year growth 2021-2026 (%)
- 6.4 Cats - Market size and forecast 2021-2026
- Exhibit 54: Chart on Cats - Market size and forecast 2021-2026 ($ million)
- Exhibit 55: Data Table on Cats - Market size and forecast 2021-2026 ($ million)
- Exhibit 56: Chart on Cats - Year-over-year growth 2021-2026 (%)
- Exhibit 57: Data Table on Cats - Year-over-year growth 2021-2026 (%)
- 6.5 Others - Market size and forecast 2021-2026
- Exhibit 58: Chart on Others - Market size and forecast 2021-2026 ($ million)
- Exhibit 59: Data Table on Others - Market size and forecast 2021-2026 ($ million)
- Exhibit 60: Chart on Others - Year-over-year growth 2021-2026 (%)
- Exhibit 61: Data Table on Others - Year-over-year growth 2021-2026 (%)
- 6.6 Market opportunity by End-user
- Exhibit 62: Market opportunity by End-user ($ million)
7 Customer Landscape
- 7.1 Customer landscape overview
- Exhibit 63: Analysis of price sensitivity, lifecycle, customer purchase basket, adoption rates, and purchase criteria
8 Geographic Landscape
- 8.1 Geographic segmentation
- Exhibit 64: Chart on Market share By Geographical Landscape 2021-2026 (%)
- Exhibit 65: Data Table on Market share By Geographical Landscape 2021-2026 (%)
- 8.2 Geographic comparison
- Exhibit 66: Chart on Geographic comparison
- Exhibit 67: Data Table on Geographic comparison
- 8.3 North America - Market size and forecast 2021-2026
- Exhibit 68: Chart on North America - Market size and forecast 2021-2026 ($ million)
- Exhibit 69: Data Table on North America - Market size and forecast 2021-2026 ($ million)
- Exhibit 70: Chart on North America - Year-over-year growth 2021-2026 (%)
- Exhibit 71: Data Table on North America - Year-over-year growth 2021-2026 (%)
- 8.4 Europe - Market size and forecast 2021-2026
- Exhibit 72: Chart on Europe - Market size and forecast 2021-2026 ($ million)
- Exhibit 73: Data Table on Europe - Market size and forecast 2021-2026 ($ million)
- Exhibit 74: Chart on Europe - Year-over-year growth 2021-2026 (%)
- Exhibit 75: Data Table on Europe - Year-over-year growth 2021-2026 (%)
- 8.5 APAC - Market size and forecast 2021-2026
- Exhibit 76: Chart on APAC - Market size and forecast 2021-2026 ($ million)
- Exhibit 77: Data Table on APAC - Market size and forecast 2021-2026 ($ million)
- Exhibit 78: Chart on APAC - Year-over-year growth 2021-2026 (%)
- Exhibit 79: Data Table on APAC - Year-over-year growth 2021-2026 (%)
- 8.6 South America - Market size and forecast 2021-2026
- Exhibit 80: Chart on South America - Market size and forecast 2021-2026 ($ million)
- Exhibit 81: Data Table on South America - Market size and forecast 2021-2026 ($ million)
- Exhibit 82: Chart on South America - Year-over-year growth 2021-2026 (%)
- Exhibit 83: Data Table on South America - Year-over-year growth 2021-2026 (%)
- 8.7 Middle East and Africa - Market size and forecast 2021-2026
- Exhibit 84: Chart on Middle East and Africa - Market size and forecast 2021-2026 ($ million)
- Exhibit 85: Data Table on Middle East and Africa - Market size and forecast 2021-2026 ($ million)
- Exhibit 86: Chart on Middle East and Africa - Year-over-year growth 2021-2026 (%)
- Exhibit 87: Data Table on Middle East and Africa - Year-over-year growth 2021-2026 (%)
- 8.8 US - Market size and forecast 2021-2026
- Exhibit 88: Chart on US - Market size and forecast 2021-2026 ($ million)
- Exhibit 89: Data Table on US - Market size and forecast 2021-2026 ($ million)
- Exhibit 90: Chart on US - Year-over-year growth 2021-2026 (%)
- Exhibit 91: Data Table on US - Year-over-year growth 2021-2026 (%)
- 8.9 China - Market size and forecast 2021-2026
- Exhibit 92: Chart on China - Market size and forecast 2021-2026 ($ million)
- Exhibit 93: Data Table on China - Market size and forecast 2021-2026 ($ million)
- Exhibit 94: Chart on China - Year-over-year growth 2021-2026 (%)
- Exhibit 95: Data Table on China - Year-over-year growth 2021-2026 (%)
- 8.10 France - Market size and forecast 2021-2026
- Exhibit 96: Chart on France - Market size and forecast 2021-2026 ($ million)
- Exhibit 97: Data Table on France - Market size and forecast 2021-2026 ($ million)
- Exhibit 98: Chart on France - Year-over-year growth 2021-2026 (%)
- Exhibit 99: Data Table on France - Year-over-year growth 2021-2026 (%)
- 8.11 Brazil - Market size and forecast 2021-2026
- Exhibit 100: Chart on Brazil - Market size and forecast 2021-2026 ($ million)
- Exhibit 101: Data Table on Brazil - Market size and forecast 2021-2026 ($ million)
- Exhibit 102: Chart on Brazil - Year-over-year growth 2021-2026 (%)
- Exhibit 103: Data Table on Brazil - Year-over-year growth 2021-2026 (%)
- 8.12 Germany - Market size and forecast 2021-2026
- Exhibit 104: Chart on Germany - Market size and forecast 2021-2026 ($ million)
- Exhibit 105: Data Table on Germany - Market size and forecast 2021-2026 ($ million)
- Exhibit 106: Chart on Germany - Year-over-year growth 2021-2026 (%)
- Exhibit 107: Data Table on Germany - Year-over-year growth 2021-2026 (%)
- 8.13 Market opportunity By Geographical Landscape
- Exhibit 108: Market opportunity By Geographical Landscape ($ million)
9 Drivers, Challenges, and Trends
- 9.1 Market drivers
- 9.2 Market challenges
- 9.3 Impact of drivers and challenges
- Exhibit 109: Impact of drivers and challenges in 2021 and 2026
- 9.4 Market trends
10 Vendor Landscape
- 10.1 Overview
- 10.2 Vendor landscape
- Exhibit 110: Overview on Criticality of inputs and Factors of differentiation
- 10.3 Landscape disruption
- Exhibit 111: Overview on factors of disruption
- 10.4 Industry risks
- Exhibit 112: Impact of key risks on business
11 Vendor Analysis
- 11.1 Vendors covered
- Exhibit 113: Vendors covered
- 11.2 Market positioning of vendors
- Exhibit 114: Matrix on vendor position and classification
- 11.3 Doskocil Manufacturing Co. Inc.
- Exhibit 115: Doskocil Manufacturing Co. Inc. - Overview
- Exhibit 116: Doskocil Manufacturing Co. Inc. - Product / Service
- Exhibit 117: Doskocil Manufacturing Co. Inc. - Key offerings
- 11.4 Go Pet Club
- Exhibit 118: Go Pet Club - Overview
- Exhibit 119: Go Pet Club - Product / Service
- Exhibit 120: Go Pet Club - Key offerings
- 11.5 Hangzhou Tianyuan Pet Products Co. Ltd.
- Exhibit 121: Hangzhou Tianyuan Pet Products Co. Ltd. - Overview
- Exhibit 122: Hangzhou Tianyuan Pet Products Co. Ltd. - Product / Service
- Exhibit 123: Hangzhou Tianyuan Pet Products Co. Ltd. - Key offerings
- 11.6 Inter IKEA Holding BV
- Exhibit 124: Inter IKEA Holding BV - Overview
- Exhibit 125: Inter IKEA Holding BV - Product / Service
- Exhibit 126: Inter IKEA Holding BV - Key news
- Exhibit 127: Inter IKEA Holding BV - Key offerings
- 11.7 MiaCara GmbH and Co. KG
- Exhibit 128: MiaCara GmbH and Co. KG - Overview
- Exhibit 129: MiaCara GmbH and Co. KG - Product / Service
- Exhibit 130: MiaCara GmbH and Co. KG - Key offerings
- 11.8 MidWest Homes for Pets
- Exhibit 131: MidWest Homes for Pets - Overview
- Exhibit 132: MidWest Homes for Pets - Product / Service
- Exhibit 133: MidWest Homes for Pets - Key offerings
- 11.9 North American Pet Products
- Exhibit 134: North American Pet Products - Overview
- Exhibit 135: North American Pet Products - Product / Service
- Exhibit 136: North American Pet Products - Key offerings
- 11.10 PetPals Group Inc.
- Exhibit 137: PetPals Group Inc. - Overview
- Exhibit 138: PetPals Group Inc. - Product / Service
- Exhibit 139: PetPals Group Inc. - Key offerings
- 11.11 Prevue Pet Products
- Exhibit 140: Prevue Pet Products - Overview
- Exhibit 141: Prevue Pet Products - Product / Service
- Exhibit 142: Prevue Pet Products - Key offerings
- 11.12 Ware Manufacturing Inc.
- Exhibit 143: Ware Manufacturing Inc. - Overview
- Exhibit 144: Ware Manufacturing Inc. - Product / Service
- Exhibit 145: Ware Manufacturing Inc. - Key offerings
12 Appendix
- 12.1 Scope of the report
- 12.2 Inclusions and exclusions checklist
- Exhibit 146: Inclusions checklist
- Exhibit 147: Exclusions checklist
- 12.3 Currency conversion rates for US$
- Exhibit 148: Currency conversion rates for US$
- 12.4 Research methodology
- Exhibit 149: Research methodology
- Exhibit 150: Validation techniques employed for market sizing
- Exhibit 151: Information sources
- 12.5 List of abbreviations
- Exhibit 152: List of abbreviations