|
|
市場調査レポート
商品コード
1253537
ハードアセット機器オンラインオークションの世界市場 2023-2027Global Hard Asset Equipment Online Auction Market 2023-2027 |
||||||
|
|
|||||||
|
● お客様のご希望に応じて、既存データの加工や未掲載情報(例:国別セグメント)の追加などの対応が可能です。 詳細はお問い合わせください。 |
|||||||


| ハードアセット機器オンラインオークションの世界市場 2023-2027 |
|
出版日: 2023年03月08日
発行: TechNavio
ページ情報: 英文 165 Pages
納期: 即納可能
|
- 全表示
- 概要
- 図表
- 目次
当レポートでは、ハードアセット機器オンラインオークション市場を監視し、2022年から2027年の間に21億27万米ドルの増加が見込まれ、予測期間中に18.65%のCAGRで成長すると予測しています。
当レポートでは、ハードアセット機器オンラインオークション市場について、全体的な分析、市場規模と予測、動向、成長促進要因・課題、さらに約25のベンダーを網羅したベンダー分析を行っています。
現在の市場シナリオ、最新動向と促進要因、市場環境全体に関する最新の分析を提供しています。市場は、従来のオークションからオンラインオークションへの嗜好の変化、中古機器オークションの需要の増加、政府の余剰資産オークションの増加によって牽引されています。
本調査では、今後数年間のハードアセット機器オンラインオークション市場の成長を促進する主な理由の一つとして、AIベースのオンラインオークションの出現を挙げています。また、海外バイヤーの参入企業の増加や、モバイルオークションの人気の高まりは、市場の大きな需要につながるでしょう。
目次
第1章 エグゼクティブサマリー
- 市場概要
第2章 市場情勢
- 市場エコシステム
第3章 市場規模
- 市場の定義
- 市場別分析
- 市場規模 2022
- 市場の見通し 2022-2027
第4章 市場規模実績
- ハードアセット機器オンラインオークションの世界市場 2017-2021
- 製品タイプセグメント分析 2017-2021
- 用途別分析 2017-2021
- 地域別分析 2017-2021
- 国別分析 2017-2021
第5章 ファイブフォース分析
- ファイブフォースの要約
- 買い手の交渉力
- 供給企業の交渉力
- 新規参入業者の脅威
- 代替品の脅威
- 競争の脅威
- 市況
第6章 市場セグメンテーション:製品タイプ別
- 市場セグメント
- 比較:製品タイプ別
- 工事:市場規模と予測 2022-2027
- 交通機関:市場規模と予測 2022-2027
- 農業:市場規模と予測 2022-2027
- その他:市場規模と予測 2022-2027
- 市場機会:製品タイプ別
第7章 市場セグメンテーション:用途別
- 市場セグメント
- 比較:用途別
- エンタープライズバイヤー:市場規模と予測 2022-2027
- 個人のバイヤー:市場規模と予測 2022-2027
- 市場機会:用途別
第8章 顧客情勢
- 顧客情勢の概要
第9章 地域別情勢
- 地域別セグメンテーション
- 地域別比較
- 北米:市場規模と予測 2022-2027
- 欧州:市場規模と予測 2022-2027
- アジア太平洋:市場規模と予測 2022-2027
- 中東・アフリカ:市場規模と予測 2022-2027
- 南米:市場規模と予測 2022-2027
- 米国:市場規模と予測 2022-2027
- 中国:市場規模と予測 2022-2027
- ドイツ:市場規模と予測 2022-2027
- 英国:市場規模と予測 2022-2027
- フランス:市場規模と予測 2022-2027
- 市場機会:地域別
第10章 促進要因、課題、および動向
- 市場促進要因
- 市場の課題
- 促進要因と課題の影響
- 市場動向
第11章 ベンダー情勢
- 概要
- ベンダー情勢
- 混乱の状況
- 業界のリスク
第12章 ベンダー分析
- 対象ベンダー
- ベンダーの市場ポジショニング
- Absolute Auctions and Realty Inc.
- Alex Lyon and Son Sales Managers and Auctioneers Inc.
- AllStar Auctions Inc.
- Auction Technology Group Plc
- Bar None Auction
- bidadoo Inc.
- BPI Auctions Ltd.
- Bruce Schapansky Auctioneers Inc.
- Euro Auctions UK Ltd.
- Hess Auction Group
- Joey Martin Auctioneers LLC
- KAR Auction Services Inc.
- MachineWeb Inc.
- NetBid Industrie-Auktionen AG
- Ritchie Bros. Auctioneers Inc.
第13章 付録
Exhibits:
- Exhibits1: Executive Summary - Chart on Market Overview
- Exhibits2: Executive Summary - Data Table on Market Overview
- Exhibits3: Executive Summary - Chart on Global Market Characteristics
- Exhibits4: Executive Summary - Chart on Market by Geography
- Exhibits5: Executive Summary - Chart on Market Segmentation by Product Type
- Exhibits6: Executive Summary - Chart on Market Segmentation by Application
- Exhibits7: Executive Summary - Chart on Incremental Growth
- Exhibits8: Executive Summary - Data Table on Incremental Growth
- Exhibits9: Executive Summary - Chart on Vendor Market Positioning
- Exhibits10: Parent market
- Exhibits11: Market Characteristics
- Exhibits12: Offerings of vendors included in the market definition
- Exhibits13: Market segments
- Exhibits14: Chart on Global - Market size and forecast 2022-2027 ($ million)
- Exhibits15: Data Table on Global - Market size and forecast 2022-2027 ($ million)
- Exhibits16: Chart on Global Market: Year-over-year growth 2022-2027 (%)
- Exhibits17: Data Table on Global Market: Year-over-year growth 2022-2027 (%)
- Exhibits18: Historic Market Size - Data Table on Global hard asset equipment online auction market 2017 - 2021 ($ million)
- Exhibits19: Historic Market Size - Product type Segment 2017 - 2021 ($ million)
- Exhibits20: Historic Market Size - Application Segment 2017 - 2021 ($ million)
- Exhibits21: Historic Market Size - Geography Segment 2017 - 2021 ($ million)
- Exhibits22: Historic Market Size - Country Segment 2017 - 2021 ($ million)
- Exhibits23: Five forces analysis - Comparison between 2022 and 2027
- Exhibits24: Chart on Bargaining power of buyers - Impact of key factors 2022 and 2027
- Exhibits25: Bargaining power of suppliers - Impact of key factors in 2022 and 2027
- Exhibits26: Threat of new entrants - Impact of key factors in 2022 and 2027
- Exhibits27: Threat of substitutes - Impact of key factors in 2022 and 2027
- Exhibits28: Threat of rivalry - Impact of key factors in 2022 and 2027
- Exhibits29: Chart on Market condition - Five forces 2022 and 2027
- Exhibits30: Chart on Product Type - Market share 2022-2027 (%)
- Exhibits31: Data Table on Product Type - Market share 2022-2027 (%)
- Exhibits32: Chart on Comparison by Product Type
- Exhibits33: Data Table on Comparison by Product Type
- Exhibits34: Chart on Construction - Market size and forecast 2022-2027 ($ million)
- Exhibits35: Data Table on Construction - Market size and forecast 2022-2027 ($ million)
- Exhibits36: Chart on Construction - Year-over-year growth 2022-2027 (%)
- Exhibits37: Data Table on Construction - Year-over-year growth 2022-2027 (%)
- Exhibits38: Chart on Transportation - Market size and forecast 2022-2027 ($ million)
- Exhibits39: Data Table on Transportation - Market size and forecast 2022-2027 ($ million)
- Exhibits40: Chart on Transportation - Year-over-year growth 2022-2027 (%)
- Exhibits41: Data Table on Transportation - Year-over-year growth 2022-2027 (%)
- Exhibits42: Chart on Agriculture - Market size and forecast 2022-2027 ($ million)
- Exhibits43: Data Table on Agriculture - Market size and forecast 2022-2027 ($ million)
- Exhibits44: Chart on Agriculture - Year-over-year growth 2022-2027 (%)
- Exhibits45: Data Table on Agriculture - Year-over-year growth 2022-2027 (%)
- Exhibits46: Chart on Others - Market size and forecast 2022-2027 ($ million)
- Exhibits47: Data Table on Others - Market size and forecast 2022-2027 ($ million)
- Exhibits48: Chart on Others - Year-over-year growth 2022-2027 (%)
- Exhibits49: Data Table on Others - Year-over-year growth 2022-2027 (%)
- Exhibits50: Market opportunity by Product Type ($ million)
- Exhibits51: Data Table on Market opportunity by Product Type ($ million)
- Exhibits52: Chart on Application - Market share 2022-2027 (%)
- Exhibits53: Data Table on Application - Market share 2022-2027 (%)
- Exhibits54: Chart on Comparison by Application
- Exhibits55: Data Table on Comparison by Application
- Exhibits56: Chart on Enterprise buyer - Market size and forecast 2022-2027 ($ million)
- Exhibits57: Data Table on Enterprise buyer - Market size and forecast 2022-2027 ($ million)
- Exhibits58: Chart on Enterprise buyer - Year-over-year growth 2022-2027 (%)
- Exhibits59: Data Table on Enterprise buyer - Year-over-year growth 2022-2027 (%)
- Exhibits60: Chart on Private buyer - Market size and forecast 2022-2027 ($ million)
- Exhibits61: Data Table on Private buyer - Market size and forecast 2022-2027 ($ million)
- Exhibits62: Chart on Private buyer - Year-over-year growth 2022-2027 (%)
- Exhibits63: Data Table on Private buyer - Year-over-year growth 2022-2027 (%)
- Exhibits64: Market opportunity by Application ($ million)
- Exhibits65: Data Table on Market opportunity by Application ($ million)
- Exhibits66: Analysis of price sensitivity, lifecycle, customer purchase basket, adoption rates, and purchase criteria
- Exhibits67: Chart on Market share by geography 2022-2027 (%)
- Exhibits68: Data Table on Market share by geography 2022-2027 (%)
- Exhibits69: Chart on Geographic comparison
- Exhibits70: Data Table on Geographic comparison
- Exhibits71: Chart on North America - Market size and forecast 2022-2027 ($ million)
- Exhibits72: Data Table on North America - Market size and forecast 2022-2027 ($ million)
- Exhibits73: Chart on North America - Year-over-year growth 2022-2027 (%)
- Exhibits74: Data Table on North America - Year-over-year growth 2022-2027 (%)
- Exhibits75: Chart on Europe - Market size and forecast 2022-2027 ($ million)
- Exhibits76: Data Table on Europe - Market size and forecast 2022-2027 ($ million)
- Exhibits77: Chart on Europe - Year-over-year growth 2022-2027 (%)
- Exhibits78: Data Table on Europe - Year-over-year growth 2022-2027 (%)
- Exhibits79: Chart on APAC - Market size and forecast 2022-2027 ($ million)
- Exhibits80: Data Table on APAC - Market size and forecast 2022-2027 ($ million)
- Exhibits81: Chart on APAC - Year-over-year growth 2022-2027 (%)
- Exhibits82: Data Table on APAC - Year-over-year growth 2022-2027 (%)
- Exhibits83: Chart on Middle East and Africa - Market size and forecast 2022-2027 ($ million)
- Exhibits84: Data Table on Middle East and Africa - Market size and forecast 2022-2027 ($ million)
- Exhibits85: Chart on Middle East and Africa - Year-over-year growth 2022-2027 (%)
- Exhibits86: Data Table on Middle East and Africa - Year-over-year growth 2022-2027 (%)
- Exhibits87: Chart on South America - Market size and forecast 2022-2027 ($ million)
- Exhibits88: Data Table on South America - Market size and forecast 2022-2027 ($ million)
- Exhibits89: Chart on South America - Year-over-year growth 2022-2027 (%)
- Exhibits90: Data Table on South America - Year-over-year growth 2022-2027 (%)
- Exhibits91: Chart on US - Market size and forecast 2022-2027 ($ million)
- Exhibits92: Data Table on US - Market size and forecast 2022-2027 ($ million)
- Exhibits93: Chart on US - Year-over-year growth 2022-2027 (%)
- Exhibits94: Data Table on US - Year-over-year growth 2022-2027 (%)
- Exhibits95: Chart on China - Market size and forecast 2022-2027 ($ million)
- Exhibits96: Data Table on China - Market size and forecast 2022-2027 ($ million)
- Exhibits97: Chart on China - Year-over-year growth 2022-2027 (%)
- Exhibits98: Data Table on China - Year-over-year growth 2022-2027 (%)
- Exhibits99: Chart on Germany - Market size and forecast 2022-2027 ($ million)
- Exhibits100: Data Table on Germany - Market size and forecast 2022-2027 ($ million)
- Exhibits101: Chart on Germany - Year-over-year growth 2022-2027 (%)
- Exhibits102: Data Table on Germany - Year-over-year growth 2022-2027 (%)
- Exhibits103: Chart on UK - Market size and forecast 2022-2027 ($ million)
- Exhibits104: Data Table on UK - Market size and forecast 2022-2027 ($ million)
- Exhibits105: Chart on UK - Year-over-year growth 2022-2027 (%)
- Exhibits106: Data Table on UK - Year-over-year growth 2022-2027 (%)
- Exhibits107: Chart on France - Market size and forecast 2022-2027 ($ million)
- Exhibits108: Data Table on France - Market size and forecast 2022-2027 ($ million)
- Exhibits109: Chart on France - Year-over-year growth 2022-2027 (%)
- Exhibits110: Data Table on France - Year-over-year growth 2022-2027 (%)
- Exhibits111: Market opportunity by geography ($ million)
- Exhibits112: Data Tables on Market opportunity by geography ($ million)
- Exhibits113: Impact of drivers and challenges in 2022 and 2027
- Exhibits114: Overview on Criticality of inputs and Factors of differentiation
- Exhibits115: Overview on factors of disruption
- Exhibits116: Impact of key risks on business
- Exhibits117: Vendors covered
- Exhibits118: Matrix on vendor position and classification
- Exhibits119: Absolute Auctions and Realty Inc. - Overview
- Exhibits120: Absolute Auctions and Realty Inc. - Product / Service
- Exhibits121: Absolute Auctions and Realty Inc. - Key offerings
- Exhibits122: Alex Lyon and Son Sales Managers and Auctioneers Inc. - Overview
- Exhibits123: Alex Lyon and Son Sales Managers and Auctioneers Inc. - Product / Service
- Exhibits124: Alex Lyon and Son Sales Managers and Auctioneers Inc. - Key offerings
- Exhibits125: AllStar Auctions Inc. - Overview
- Exhibits126: AllStar Auctions Inc. - Product / Service
- Exhibits127: AllStar Auctions Inc. - Key offerings
- Exhibits128: Auction Technology Group Plc - Overview
- Exhibits129: Auction Technology Group Plc - Business segments
- Exhibits130: Auction Technology Group Plc - Key offerings
- Exhibits131: Auction Technology Group Plc - Segment focus
- Exhibits132: Bar None Auction - Overview
- Exhibits133: Bar None Auction - Product / Service
- Exhibits134: Bar None Auction - Key offerings
- Exhibits135: bidadoo Inc. - Overview
- Exhibits136: bidadoo Inc. - Product / Service
- Exhibits137: bidadoo Inc. - Key offerings
- Exhibits138: BPI Auctions Ltd. - Overview
- Exhibits139: BPI Auctions Ltd. - Product / Service
- Exhibits140: BPI Auctions Ltd. - Key offerings
- Exhibits141: Bruce Schapansky Auctioneers Inc. - Overview
- Exhibits142: Bruce Schapansky Auctioneers Inc. - Product / Service
- Exhibits143: Bruce Schapansky Auctioneers Inc. - Key offerings
- Exhibits144: Euro Auctions UK Ltd. - Overview
- Exhibits145: Euro Auctions UK Ltd. - Product / Service
- Exhibits146: Euro Auctions UK Ltd. - Key offerings
- Exhibits147: Hess Auction Group - Overview
- Exhibits148: Hess Auction Group - Product / Service
- Exhibits149: Hess Auction Group - Key offerings
- Exhibits150: Joey Martin Auctioneers LLC - Overview
- Exhibits151: Joey Martin Auctioneers LLC - Product / Service
- Exhibits152: Joey Martin Auctioneers LLC - Key offerings
- Exhibits153: KAR Auction Services Inc. - Overview
- Exhibits154: KAR Auction Services Inc. - Business segments
- Exhibits155: KAR Auction Services Inc. - Key offerings
- Exhibits156: KAR Auction Services Inc. - Segment focus
- Exhibits157: MachineWeb Inc. - Overview
- Exhibits158: MachineWeb Inc. - Product / Service
- Exhibits159: MachineWeb Inc. - Key offerings
- Exhibits160: NetBid Industrie-Auktionen AG - Overview
- Exhibits161: NetBid Industrie-Auktionen AG - Product / Service
- Exhibits162: NetBid Industrie-Auktionen AG - Key offerings
- Exhibits163: Ritchie Bros. Auctioneers Inc. - Overview
- Exhibits164: Ritchie Bros. Auctioneers Inc. - Business segments
- Exhibits165: Ritchie Bros. Auctioneers Inc. - Key offerings
- Exhibits166: Ritchie Bros. Auctioneers Inc. - Segment focus
- Exhibits167: Inclusions checklist
- Exhibits168: Exclusions checklist
- Exhibits169: Currency conversion rates for US$
- Exhibits170: Research methodology
- Exhibits171: Validation techniques employed for market sizing
- Exhibits172: Information sources
- Exhibits173: List of abbreviations
Technavio has been monitoring the hard asset equipment online auction market and is forecast to grow by USD 2100.27 mn during 2022-2027, accelerating at a CAGR of 18.65% during the forecast period. Our report on the hard asset equipment online auction market provides a holistic analysis, market size and forecast, trends, growth drivers, and challenges, as well as vendor analysis covering around 25 vendors.
The report offers an up-to-date analysis regarding the current market scenario, the latest trends and drivers, and the overall market environment. The market is driven by shift in preference toward online auctioning from conventional auctioning, rise in demand for used equipment auctions, and rise in government surplus asset auctions.
Technavio's hard asset equipment online auction market is segmented as below:
By Product Type
- Construction
- Transportation
- Agriculture
- Others
By Application
- Enterprise buyer
- Private buyer
By Geography
- North America
- Europe
- APAC
- Middle East and Africa
- South America
This study identifies the emergence of ai-based online auctions as one of the prime reasons driving the hard asset equipment online auction market growth during the next few years. Also, the growing participation of overseas buyers and the growing popularity of mobile auctioning will lead to sizable demand in the market.
Technavio presents a detailed picture of the market by the way of study, synthesis, and summation of data from multiple sources by an analysis of key parameters. Our report on the hard asset equipment online auction market covers the following areas:
- Hard asset equipment online auction market sizing
- Hard asset equipment online auction market forecast
- Hard asset equipment online auction market industry analysis
Technavio's robust vendor analysis is designed to help clients improve their market position, and in line with this, this report provides a detailed analysis of several leading hard asset equipment online auction market vendors that include Absolute Auctions and Realty Inc., Alex Lyon and Son Sales Managers and Auctioneers Inc., AllStar Auctions Inc., Auction Technology Group Plc, Bar None Auction, bidadoo Inc., BPI Auctions Ltd., Bruce Schapansky Auctioneers Inc., Euro Auctions UK Ltd., Hess Auction Group, Joey Martin Auctioneers LLC, KAR Auction Services Inc., MachineWeb Inc., NetBid Industrie-Auktionen AG, Ritchason Auctioneers Inc., Ritchie Bros. Auctioneers Inc., Sullivan Auctioneers LLC, and TBAuctions B.V. Also, the hard asset equipment online auction market analysis report includes information on upcoming trends and challenges that will influence market growth. This is to help companies strategize and leverage all forthcoming growth opportunities.
The study was conducted using an objective combination of primary and secondary information including inputs from key participants in the industry. The report contains a comprehensive market and vendor landscape in addition to an analysis of the key vendors.
Technavio presents a detailed picture of the market by the way of study, synthesis, and summation of data from multiple sources by an analysis of key parameters such as profit, pricing, competition, and promotions. It presents various market facets by identifying the key industry influencers. The data presented is comprehensive, reliable, and a result of extensive research - both primary and secondary. Technavio's market research reports provide a complete competitive landscape and an in-depth vendor selection methodology and analysis using qualitative and quantitative research to forecast accurate market growth.
Table of Contents
1 Executive Summary
- 1.1 Market overview
- Exhibit 01: Executive Summary - Chart on Market Overview
- Exhibit 02: Executive Summary - Data Table on Market Overview
- Exhibit 03: Executive Summary - Chart on Global Market Characteristics
- Exhibit 04: Executive Summary - Chart on Market by Geography
- Exhibit 05: Executive Summary - Chart on Market Segmentation by Product Type
- Exhibit 06: Executive Summary - Chart on Market Segmentation by Application
- Exhibit 07: Executive Summary - Chart on Incremental Growth
- Exhibit 08: Executive Summary - Data Table on Incremental Growth
- Exhibit 09: Executive Summary - Chart on Vendor Market Positioning
2 Market Landscape
- 2.1 Market ecosystem
- Exhibit 10: Parent market
- Exhibit 11: Market Characteristics
3 Market Sizing
- 3.1 Market definition
- Exhibit 12: Offerings of vendors included in the market definition
- 3.2 Market segment analysis
- Exhibit 13: Market segments
- 3.3 Market size 2022
- 3.4 Market outlook: Forecast for 2022-2027
- Exhibit 14: Chart on Global - Market size and forecast 2022-2027 ($ million)
- Exhibit 15: Data Table on Global - Market size and forecast 2022-2027 ($ million)
- Exhibit 16: Chart on Global Market: Year-over-year growth 2022-2027 (%)
- Exhibit 17: Data Table on Global Market: Year-over-year growth 2022-2027 (%)
4 Historic Market Size
- 4.1 Global hard asset equipment online auction market 2017 - 2021
- Exhibit 18: Historic Market Size - Data Table on Global hard asset equipment online auction market 2017 - 2021 ($ million)
- 4.2 Product type Segment Analysis 2017 - 2021
- Exhibit 19: Historic Market Size - Product type Segment 2017 - 2021 ($ million)
- 4.3 Application Segment Analysis 2017 - 2021
- Exhibit 20: Historic Market Size - Application Segment 2017 - 2021 ($ million)
- 4.4 Geography Segment Analysis 2017 - 2021
- Exhibit 21: Historic Market Size - Geography Segment 2017 - 2021 ($ million)
- 4.5 Country Segment Analysis 2017 - 2021
- Exhibit 22: Historic Market Size - Country Segment 2017 - 2021 ($ million)
5 Five Forces Analysis
- 5.1 Five forces summary
- Exhibit 23: Five forces analysis - Comparison between 2022 and 2027
- 5.2 Bargaining power of buyers
- Exhibit 24: Chart on Bargaining power of buyers - Impact of key factors 2022 and 2027
- 5.3 Bargaining power of suppliers
- Exhibit 25: Bargaining power of suppliers - Impact of key factors in 2022 and 2027
- 5.4 Threat of new entrants
- Exhibit 26: Threat of new entrants - Impact of key factors in 2022 and 2027
- 5.5 Threat of substitutes
- Exhibit 27: Threat of substitutes - Impact of key factors in 2022 and 2027
- 5.6 Threat of rivalry
- Exhibit 28: Threat of rivalry - Impact of key factors in 2022 and 2027
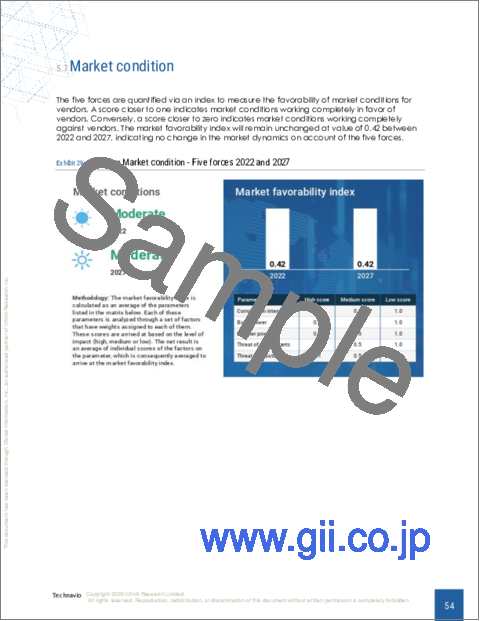
- 5.7 Market condition
- Exhibit 29: Chart on Market condition - Five forces 2022 and 2027
6 Market Segmentation by Product Type
- 6.1 Market segments
- Exhibit 30: Chart on Product Type - Market share 2022-2027 (%)
- Exhibit 31: Data Table on Product Type - Market share 2022-2027 (%)
- 6.2 Comparison by Product Type
- Exhibit 32: Chart on Comparison by Product Type
- Exhibit 33: Data Table on Comparison by Product Type
- 6.3 Construction - Market size and forecast 2022-2027
- Exhibit 34: Chart on Construction - Market size and forecast 2022-2027 ($ million)
- Exhibit 35: Data Table on Construction - Market size and forecast 2022-2027 ($ million)
- Exhibit 36: Chart on Construction - Year-over-year growth 2022-2027 (%)
- Exhibit 37: Data Table on Construction - Year-over-year growth 2022-2027 (%)
- 6.4 Transportation - Market size and forecast 2022-2027
- Exhibit 38: Chart on Transportation - Market size and forecast 2022-2027 ($ million)
- Exhibit 39: Data Table on Transportation - Market size and forecast 2022-2027 ($ million)
- Exhibit 40: Chart on Transportation - Year-over-year growth 2022-2027 (%)
- Exhibit 41: Data Table on Transportation - Year-over-year growth 2022-2027 (%)
- 6.5 Agriculture - Market size and forecast 2022-2027
- Exhibit 42: Chart on Agriculture - Market size and forecast 2022-2027 ($ million)
- Exhibit 43: Data Table on Agriculture - Market size and forecast 2022-2027 ($ million)
- Exhibit 44: Chart on Agriculture - Year-over-year growth 2022-2027 (%)
- Exhibit 45: Data Table on Agriculture - Year-over-year growth 2022-2027 (%)
- 6.6 Others - Market size and forecast 2022-2027
- Exhibit 46: Chart on Others - Market size and forecast 2022-2027 ($ million)
- Exhibit 47: Data Table on Others - Market size and forecast 2022-2027 ($ million)
- Exhibit 48: Chart on Others - Year-over-year growth 2022-2027 (%)
- Exhibit 49: Data Table on Others - Year-over-year growth 2022-2027 (%)
- 6.7 Market opportunity by Product Type
- Exhibit 50: Market opportunity by Product Type ($ million)
- Exhibit 51: Data Table on Market opportunity by Product Type ($ million)
7 Market Segmentation by Application
- 7.1 Market segments
- Exhibit 52: Chart on Application - Market share 2022-2027 (%)
- Exhibit 53: Data Table on Application - Market share 2022-2027 (%)
- 7.2 Comparison by Application
- Exhibit 54: Chart on Comparison by Application
- Exhibit 55: Data Table on Comparison by Application
- 7.3 Enterprise buyer - Market size and forecast 2022-2027
- Exhibit 56: Chart on Enterprise buyer - Market size and forecast 2022-2027 ($ million)
- Exhibit 57: Data Table on Enterprise buyer - Market size and forecast 2022-2027 ($ million)
- Exhibit 58: Chart on Enterprise buyer - Year-over-year growth 2022-2027 (%)
- Exhibit 59: Data Table on Enterprise buyer - Year-over-year growth 2022-2027 (%)
- 7.4 Private buyer - Market size and forecast 2022-2027
- Exhibit 60: Chart on Private buyer - Market size and forecast 2022-2027 ($ million)
- Exhibit 61: Data Table on Private buyer - Market size and forecast 2022-2027 ($ million)
- Exhibit 62: Chart on Private buyer - Year-over-year growth 2022-2027 (%)
- Exhibit 63: Data Table on Private buyer - Year-over-year growth 2022-2027 (%)
- 7.5 Market opportunity by Application
- Exhibit 64: Market opportunity by Application ($ million)
- Exhibit 65: Data Table on Market opportunity by Application ($ million)
8 Customer Landscape
- 8.1 Customer landscape overview
- Exhibit 66: Analysis of price sensitivity, lifecycle, customer purchase basket, adoption rates, and purchase criteria
9 Geographic Landscape
- 9.1 Geographic segmentation
- Exhibit 67: Chart on Market share by geography 2022-2027 (%)
- Exhibit 68: Data Table on Market share by geography 2022-2027 (%)
- 9.2 Geographic comparison
- Exhibit 69: Chart on Geographic comparison
- Exhibit 70: Data Table on Geographic comparison
- 9.3 North America - Market size and forecast 2022-2027
- Exhibit 71: Chart on North America - Market size and forecast 2022-2027 ($ million)
- Exhibit 72: Data Table on North America - Market size and forecast 2022-2027 ($ million)
- Exhibit 73: Chart on North America - Year-over-year growth 2022-2027 (%)
- Exhibit 74: Data Table on North America - Year-over-year growth 2022-2027 (%)
- 9.4 Europe - Market size and forecast 2022-2027
- Exhibit 75: Chart on Europe - Market size and forecast 2022-2027 ($ million)
- Exhibit 76: Data Table on Europe - Market size and forecast 2022-2027 ($ million)
- Exhibit 77: Chart on Europe - Year-over-year growth 2022-2027 (%)
- Exhibit 78: Data Table on Europe - Year-over-year growth 2022-2027 (%)
- 9.5 APAC - Market size and forecast 2022-2027
- Exhibit 79: Chart on APAC - Market size and forecast 2022-2027 ($ million)
- Exhibit 80: Data Table on APAC - Market size and forecast 2022-2027 ($ million)
- Exhibit 81: Chart on APAC - Year-over-year growth 2022-2027 (%)
- Exhibit 82: Data Table on APAC - Year-over-year growth 2022-2027 (%)
- 9.6 Middle East and Africa - Market size and forecast 2022-2027
- Exhibit 83: Chart on Middle East and Africa - Market size and forecast 2022-2027 ($ million)
- Exhibit 84: Data Table on Middle East and Africa - Market size and forecast 2022-2027 ($ million)
- Exhibit 85: Chart on Middle East and Africa - Year-over-year growth 2022-2027 (%)
- Exhibit 86: Data Table on Middle East and Africa - Year-over-year growth 2022-2027 (%)
- 9.7 South America - Market size and forecast 2022-2027
- Exhibit 87: Chart on South America - Market size and forecast 2022-2027 ($ million)
- Exhibit 88: Data Table on South America - Market size and forecast 2022-2027 ($ million)
- Exhibit 89: Chart on South America - Year-over-year growth 2022-2027 (%)
- Exhibit 90: Data Table on South America - Year-over-year growth 2022-2027 (%)
- 9.8 US - Market size and forecast 2022-2027
- Exhibit 91: Chart on US - Market size and forecast 2022-2027 ($ million)
- Exhibit 92: Data Table on US - Market size and forecast 2022-2027 ($ million)
- Exhibit 93: Chart on US - Year-over-year growth 2022-2027 (%)
- Exhibit 94: Data Table on US - Year-over-year growth 2022-2027 (%)
- 9.9 China - Market size and forecast 2022-2027
- Exhibit 95: Chart on China - Market size and forecast 2022-2027 ($ million)
- Exhibit 96: Data Table on China - Market size and forecast 2022-2027 ($ million)
- Exhibit 97: Chart on China - Year-over-year growth 2022-2027 (%)
- Exhibit 98: Data Table on China - Year-over-year growth 2022-2027 (%)
- 9.10 Germany - Market size and forecast 2022-2027
- Exhibit 99: Chart on Germany - Market size and forecast 2022-2027 ($ million)
- Exhibit 100: Data Table on Germany - Market size and forecast 2022-2027 ($ million)
- Exhibit 101: Chart on Germany - Year-over-year growth 2022-2027 (%)
- Exhibit 102: Data Table on Germany - Year-over-year growth 2022-2027 (%)
- 9.11 UK - Market size and forecast 2022-2027
- Exhibit 103: Chart on UK - Market size and forecast 2022-2027 ($ million)
- Exhibit 104: Data Table on UK - Market size and forecast 2022-2027 ($ million)
- Exhibit 105: Chart on UK - Year-over-year growth 2022-2027 (%)
- Exhibit 106: Data Table on UK - Year-over-year growth 2022-2027 (%)
- 9.12 France - Market size and forecast 2022-2027
- Exhibit 107: Chart on France - Market size and forecast 2022-2027 ($ million)
- Exhibit 108: Data Table on France - Market size and forecast 2022-2027 ($ million)
- Exhibit 109: Chart on France - Year-over-year growth 2022-2027 (%)
- Exhibit 110: Data Table on France - Year-over-year growth 2022-2027 (%)
- 9.13 Market opportunity by geography
- Exhibit 111: Market opportunity by geography ($ million)
- Exhibit 112: Data Tables on Market opportunity by geography ($ million)
10 Drivers, Challenges, and Trends
- 10.1 Market drivers
- 10.2 Market challenges
- 10.3 Impact of drivers and challenges
- Exhibit 113: Impact of drivers and challenges in 2022 and 2027
- 10.4 Market trends
11 Vendor Landscape
- 11.1 Overview
- 11.2 Vendor landscape
- Exhibit 114: Overview on Criticality of inputs and Factors of differentiation
- 11.3 Landscape disruption
- Exhibit 115: Overview on factors of disruption
- 11.4 Industry risks
- Exhibit 116: Impact of key risks on business
12 Vendor Analysis
- 12.1 Vendors covered
- Exhibit 117: Vendors covered
- 12.2 Market positioning of vendors
- Exhibit 118: Matrix on vendor position and classification
- 12.3 Absolute Auctions and Realty Inc.
- Exhibit 119: Absolute Auctions and Realty Inc. - Overview
- Exhibit 120: Absolute Auctions and Realty Inc. - Product / Service
- Exhibit 121: Absolute Auctions and Realty Inc. - Key offerings
- 12.4 Alex Lyon and Son Sales Managers and Auctioneers Inc.
- Exhibit 122: Alex Lyon and Son Sales Managers and Auctioneers Inc. - Overview
- Exhibit 123: Alex Lyon and Son Sales Managers and Auctioneers Inc. - Product / Service
- Exhibit 124: Alex Lyon and Son Sales Managers and Auctioneers Inc. - Key offerings
- 12.5 AllStar Auctions Inc.
- Exhibit 125: AllStar Auctions Inc. - Overview
- Exhibit 126: AllStar Auctions Inc. - Product / Service
- Exhibit 127: AllStar Auctions Inc. - Key offerings
- 12.6 Auction Technology Group Plc
- Exhibit 128: Auction Technology Group Plc - Overview
- Exhibit 129: Auction Technology Group Plc - Business segments
- Exhibit 130: Auction Technology Group Plc - Key offerings
- Exhibit 131: Auction Technology Group Plc - Segment focus
- 12.7 Bar None Auction
- Exhibit 132: Bar None Auction - Overview
- Exhibit 133: Bar None Auction - Product / Service
- Exhibit 134: Bar None Auction - Key offerings
- 12.8 bidadoo Inc.
- Exhibit 135: bidadoo Inc. - Overview
- Exhibit 136: bidadoo Inc. - Product / Service
- Exhibit 137: bidadoo Inc. - Key offerings
- 12.9 BPI Auctions Ltd.
- Exhibit 138: BPI Auctions Ltd. - Overview
- Exhibit 139: BPI Auctions Ltd. - Product / Service
- Exhibit 140: BPI Auctions Ltd. - Key offerings
- 12.10 Bruce Schapansky Auctioneers Inc.
- Exhibit 141: Bruce Schapansky Auctioneers Inc. - Overview
- Exhibit 142: Bruce Schapansky Auctioneers Inc. - Product / Service
- Exhibit 143: Bruce Schapansky Auctioneers Inc. - Key offerings
- 12.11 Euro Auctions UK Ltd.
- Exhibit 144: Euro Auctions UK Ltd. - Overview
- Exhibit 145: Euro Auctions UK Ltd. - Product / Service
- Exhibit 146: Euro Auctions UK Ltd. - Key offerings
- 12.12 Hess Auction Group
- Exhibit 147: Hess Auction Group - Overview
- Exhibit 148: Hess Auction Group - Product / Service
- Exhibit 149: Hess Auction Group - Key offerings
- 12.13 Joey Martin Auctioneers LLC
- Exhibit 150: Joey Martin Auctioneers LLC - Overview
- Exhibit 151: Joey Martin Auctioneers LLC - Product / Service
- Exhibit 152: Joey Martin Auctioneers LLC - Key offerings
- 12.14 KAR Auction Services Inc.
- Exhibit 153: KAR Auction Services Inc. - Overview
- Exhibit 154: KAR Auction Services Inc. - Business segments
- Exhibit 155: KAR Auction Services Inc. - Key offerings
- Exhibit 156: KAR Auction Services Inc. - Segment focus
- 12.15 MachineWeb Inc.
- Exhibit 157: MachineWeb Inc. - Overview
- Exhibit 158: MachineWeb Inc. - Product / Service
- Exhibit 159: MachineWeb Inc. - Key offerings
- 12.16 NetBid Industrie-Auktionen AG
- Exhibit 160: NetBid Industrie-Auktionen AG - Overview
- Exhibit 161: NetBid Industrie-Auktionen AG - Product / Service
- Exhibit 162: NetBid Industrie-Auktionen AG - Key offerings
- 12.17 Ritchie Bros. Auctioneers Inc.
- Exhibit 163: Ritchie Bros. Auctioneers Inc. - Overview
- Exhibit 164: Ritchie Bros. Auctioneers Inc. - Business segments
- Exhibit 165: Ritchie Bros. Auctioneers Inc. - Key offerings
- Exhibit 166: Ritchie Bros. Auctioneers Inc. - Segment focus
13 Appendix
- 13.1 Scope of the report
- 13.2 Inclusions and exclusions checklist
- Exhibit 167: Inclusions checklist
- Exhibit 168: Exclusions checklist
- 13.3 Currency conversion rates for US$
- Exhibit 169: Currency conversion rates for US$
- 13.4 Research methodology
- Exhibit 170: Research methodology
- Exhibit 171: Validation techniques employed for market sizing
- Exhibit 172: Information sources
- 13.5 List of abbreviations
- Exhibit 173: List of abbreviations