|
|
市場調査レポート
商品コード
1071354
サイトメガロウイルス(CMV)治療薬の世界市場:2022年~2026年Global Cytomegalovirus (CMV) Therapeutics Market 2022-2026 |
||||||
|
|
|||||||
|
● お客様のご希望に応じて、既存データの加工や未掲載情報(例:国別セグメント)の追加などの対応が可能です。 詳細はお問い合わせください。 |
|||||||


| サイトメガロウイルス(CMV)治療薬の世界市場:2022年~2026年 |
|
出版日: 2022年04月19日
発行: TechNavio
ページ情報: 英文 120 Pages
納期: 即納可能
|
- 全表示
- 概要
- 図表
- 目次
世界のサイトメガロウイルス(CMV)治療薬の市場規模は、2022年から2026年の間に3億3,221万米ドル成長し、予測期間中は5.44%のCAGRで成長する見込みです。
同市場は、CMVのリスク因子の増加、疾患の再発性、先天性CMVの高い有病率によって牽引されています。
当レポートでは、サイトメガロウイルス(CMV)治療薬の世界市場の全体的な分析、市場規模と予測、動向、成長促進要因、課題、および約25のベンダーをカバーする分析を提供しています。
目次
第1章 エグゼクティブサマリー
- 市場概要
第2章 市場情勢
- 市場のエコシステム
第3章 市場規模
- 市場の定義
- 市場セグメント分析
- 2021年の市場規模
- 市場の見通し:2021年から2026年の予測
第4章 ファイブフォース分析
- ファイブフォースまとめ
- 買い手の交渉力
- 供給企業の交渉力
- 新規参入業者の脅威
- 代替品の脅威
- 競争の脅威
- 市況
第5章 市場セグメンテーション:RoA別
- 市場セグメント
- RoA別の比較
- 経口:市場規模と予測(2021年~2026年)
- 非経口:市場規模と予測(2021年~2026年)
- その他:市場規模と予測(2021年~2026年)
- RoA別の市場機会
第6章 顧客情勢
- 顧客情勢の概要
第7章 地域別情勢
- 地域別セグメンテーション
- 地域別の比較
- 北米:市場規模と予測(2021年~2026年)
- 欧州:市場規模と予測(2021年~2026年)
- アジア:市場規模と予測(2021年~2026年)
- その他の地域:市場規模と予測(2021年~2026年)
- 米国:市場規模と予測(2021年~2026年)
- デンマーク:市場規模と予測(2021年~2026年)
- 中国:市場規模と予測(2021年~2026年)
- カナダ:市場規模と予測(2021年~2026年)
- インド:市場規模と予測(2021年~2026年)
- 地域情勢別の市場機会
第8章 推進要因、課題、および動向
- 市場推進要因
- 市場の課題
- 推進要因と課題の影響
- 市場動向
第9章 ベンダー情勢
- 概要
- ベンダー情勢
- 混乱の状況
- 業界のリスク
第10章 ベンダー分析
- 対象ベンダー
- ベンダーの市場ポジショニング
- AstraZeneca Plc
- Bausch Health Companies Inc.
- Chimerix Inc.
- Exela Pharma Sciences LLC
- F. Hoffmann La Roche Ltd.
- Fortress Biotech Inc.
- Gilead Sciences Inc.
- Merck and Co. Inc.
- Takeda Pharmaceutical Co. Ltd.
- Teva Pharmaceutical Industries Ltd.
第11章 付録
- 調査範囲
- 包含と除外のチェックリスト
- US$の為替レート
- 調査手法
- 略語のリスト
Exhibits:
- Exhibits1: Executive Summary - Chart on Market Overview
- Exhibits2: Executive Summary - Data Table on Market Overview
- Exhibits3: Executive Summary - Chart on Global Market Characteristics
- Exhibits4: Executive Summary - Chart on Market By Geographical Landscape
- Exhibits5: Executive Summary - Chart on Market Segmentation by Route of Administration
- Exhibits6: Executive Summary - Chart on Incremental Growth
- Exhibits7: Executive Summary - Data Table on Incremental Growth
- Exhibits8: Executive Summary - Chart on Vendor Market Positioning
- Exhibits9: Parent market
- Exhibits10: Market Characteristics
- Exhibits11: Offerings of vendors included in the market definition
- Exhibits12: Market segments
- Exhibits13: Chart on Global - Market size and forecast 2021-2026 ($ million)
- Exhibits14: Data Table on Global - Market size and forecast 2021-2026 ($ million)
- Exhibits15: Chart on Global Market: Year-over-year growth 2021-2026 (%)
- Exhibits16: Data Table on Global Market: Year-over-year growth 2021-2026 (%)
- Exhibits17: Five forces analysis - Comparison between2021 and 2026
- Exhibits18: Chart on Bargaining power of buyers - Impact of key factors 2021 and 2026
- Exhibits19: Bargaining power of suppliers - Impact of key factors in 2021 and 2026
- Exhibits20: Threat of new entrants - Impact of key factors in 2021 and 2026
- Exhibits21: Threat of substitutes - Impact of key factors in 2021 and 2026
- Exhibits22: Threat of rivalry - Impact of key factors in 2021 and 2026
- Exhibits23: Chart on Market condition - Five forces 2021 and 2026
- Exhibits24: Chart on Route of Administration - Market share 2021-2026 (%)
- Exhibits25: Data Table on Route of Administration - Market share 2021-2026 (%)
- Exhibits26: Chart on Comparison by Route of Administration
- Exhibits27: Data Table on Comparison by Route of Administration
- Exhibits28: Chart on Oral - Market size and forecast 2021-2026 ($ million)
- Exhibits29: Data Table on Oral - Market size and forecast 2021-2026 ($ million)
- Exhibits30: Chart on Oral - Year-over-year growth 2021-2026 (%)
- Exhibits31: Data Table on Oral - Year-over-year growth 2021-2026 (%)
- Exhibits32: Chart on Parenteral - Market size and forecast 2021-2026 ($ million)
- Exhibits33: Data Table on Parenteral - Market size and forecast 2021-2026 ($ million)
- Exhibits34: Chart on Parenteral - Year-over-year growth 2021-2026 (%)
- Exhibits35: Data Table on Parenteral - Year-over-year growth 2021-2026 (%)
- Exhibits36: Chart on Others - Market size and forecast 2021-2026 ($ million)
- Exhibits37: Data Table on Others - Market size and forecast 2021-2026 ($ million)
- Exhibits38: Chart on Others - Year-over-year growth 2021-2026 (%)
- Exhibits39: Data Table on Others - Year-over-year growth 2021-2026 (%)
- Exhibits40: Market opportunity by Route of Administration ($ million)
- Exhibits41: Analysis of price sensitivity, lifecycle, customer purchase basket, adoption rates, and purchase criteria
- Exhibits42: Chart on Market share By Geographical Landscape 2021-2026 (%)
- Exhibits43: Data Table on Market share By Geographical Landscape 2021-2026 (%)
- Exhibits44: Chart on Geographic comparison
- Exhibits45: Data Table on Geographic comparison
- Exhibits46: Chart on North America - Market size and forecast 2021-2026 ($ million)
- Exhibits47: Data Table on North America - Market size and forecast 2021-2026 ($ million)
- Exhibits48: Chart on North America - Year-over-year growth 2021-2026 (%)
- Exhibits49: Data Table on North America - Year-over-year growth 2021-2026 (%)
- Exhibits50: Chart on Europe - Market size and forecast 2021-2026 ($ million)
- Exhibits51: Data Table on Europe - Market size and forecast 2021-2026 ($ million)
- Exhibits52: Chart on Europe - Year-over-year growth 2021-2026 (%)
- Exhibits53: Data Table on Europe - Year-over-year growth 2021-2026 (%)
- Exhibits54: Chart on Asia - Market size and forecast 2021-2026 ($ million)
- Exhibits55: Data Table on Asia - Market size and forecast 2021-2026 ($ million)
- Exhibits56: Chart on Asia - Year-over-year growth 2021-2026 (%)
- Exhibits57: Data Table on Asia - Year-over-year growth 2021-2026 (%)
- Exhibits58: Chart on Rest of World (ROW) - Market size and forecast 2021-2026 ($ million)
- Exhibits59: Data Table on Rest of World (ROW) - Market size and forecast 2021-2026 ($ million)
- Exhibits60: Chart on Rest of World (ROW) - Year-over-year growth 2021-2026 (%)
- Exhibits61: Data Table on Rest of World (ROW) - Year-over-year growth 2021-2026 (%)
- Exhibits62: Chart on US - Market size and forecast 2021-2026 ($ million)
- Exhibits63: Data Table on US - Market size and forecast 2021-2026 ($ million)
- Exhibits64: Chart on US - Year-over-year growth 2021-2026 (%)
- Exhibits65: Data Table on US - Year-over-year growth 2021-2026 (%)
- Exhibits66: Chart on Denmark - Market size and forecast 2021-2026 ($ million)
- Exhibits67: Data Table on Denmark - Market size and forecast 2021-2026 ($ million)
- Exhibits68: Chart on Denmark - Year-over-year growth 2021-2026 (%)
- Exhibits69: Data Table on Denmark - Year-over-year growth 2021-2026 (%)
- Exhibits70: Chart on China - Market size and forecast 2021-2026 ($ million)
- Exhibits71: Data Table on China - Market size and forecast 2021-2026 ($ million)
- Exhibits72: Chart on China - Year-over-year growth 2021-2026 (%)
- Exhibits73: Data Table on China - Year-over-year growth 2021-2026 (%)
- Exhibits74: Chart on Canada - Market size and forecast 2021-2026 ($ million)
- Exhibits75: Data Table on Canada - Market size and forecast 2021-2026 ($ million)
- Exhibits76: Chart on Canada - Year-over-year growth 2021-2026 (%)
- Exhibits77: Data Table on Canada - Year-over-year growth 2021-2026 (%)
- Exhibits78: Chart on India - Market size and forecast 2021-2026 ($ million)
- Exhibits79: Data Table on India - Market size and forecast 2021-2026 ($ million)
- Exhibits80: Chart on India - Year-over-year growth 2021-2026 (%)
- Exhibits81: Data Table on India - Year-over-year growth 2021-2026 (%)
- Exhibits82: Market opportunity By Geographical Landscape ($ million)
- Exhibits83: Impact of drivers and challenges in 2021 and 2026
- Exhibits84: Overview on Criticality of inputs and Factors of differentiation
- Exhibits85: Overview on factors of disruption
- Exhibits86: Impact of key risks on business
- Exhibits87: Vendors covered
- Exhibits88: Matrix on vendor position and classification
- Exhibits89: AstraZeneca Plc - Overview
- Exhibits90: AstraZeneca Plc - Product / Service
- Exhibits91: AstraZeneca Plc - Key news
- Exhibits92: AstraZeneca Plc - Key offerings
- Exhibits93: Bausch Health Companies Inc. - Overview
- Exhibits94: Bausch Health Companies Inc. - Business segments
- Exhibits95: Bausch Health Companies Inc. - Key news
- Exhibits96: Bausch Health Companies Inc. - Key offerings
- Exhibits97: Bausch Health Companies Inc. - Segment focus
- Exhibits98: Chimerix Inc. - Overview
- Exhibits99: Chimerix Inc. - Product / Service
- Exhibits100: Chimerix Inc. - Key offerings
- Exhibits101: Exela Pharma Sciences LLC - Overview
- Exhibits102: Exela Pharma Sciences LLC - Product / Service
- Exhibits103: Exela Pharma Sciences LLC - Key offerings
- Exhibits104: F. Hoffmann La Roche Ltd. - Overview
- Exhibits105: F. Hoffmann La Roche Ltd. - Business segments
- Exhibits106: F. Hoffmann La Roche Ltd. - Key news
- Exhibits107: F. Hoffmann La Roche Ltd. - Key offerings
- Exhibits108: F. Hoffmann La Roche Ltd. - Segment focus
- Exhibits109: Fortress Biotech Inc. - Overview
- Exhibits110: Fortress Biotech Inc. - Business segments
- Exhibits111: Fortress Biotech Inc. - Key offerings
- Exhibits112: Fortress Biotech Inc. - Segment focus
- Exhibits113: Gilead Sciences Inc. - Overview
- Exhibits114: Gilead Sciences Inc. - Product / Service
- Exhibits115: Gilead Sciences Inc. - Key news
- Exhibits116: Gilead Sciences Inc. - Key offerings
- Exhibits117: Merck and Co. Inc. - Overview
- Exhibits118: Merck and Co. Inc. - Business segments
- Exhibits119: Merck and Co. Inc. - Key news
- Exhibits120: Merck and Co. Inc. - Key offerings
- Exhibits121: Merck and Co. Inc. - Segment focus
- Exhibits122: Takeda Pharmaceutical Co. Ltd. - Overview
- Exhibits123: Takeda Pharmaceutical Co. Ltd. - Product / Service
- Exhibits124: Takeda Pharmaceutical Co. Ltd. - Key news
- Exhibits125: Takeda Pharmaceutical Co. Ltd. - Key offerings
- Exhibits126: Teva Pharmaceutical Industries Ltd. - Overview
- Exhibits127: Teva Pharmaceutical Industries Ltd. - Business segments
- Exhibits128: Teva Pharmaceutical Industries Ltd. - Key news
- Exhibits129: Teva Pharmaceutical Industries Ltd. - Key offerings
- Exhibits130: Teva Pharmaceutical Industries Ltd. - Segment focus
- Exhibits131: Inclusions checklist
- Exhibits132: Exclusions checklist
- Exhibits133: Currency conversion rates for US$
- Exhibits134: Research methodology
- Exhibits135: Validation techniques employed for market sizing
- Exhibits136: Information sources
- Exhibits137: List of abbreviations
Technavio has been monitoring the cytomegalovirus (CMV) therapeutics market and it is poised to grow by $ 332.21 mn during 2022-2026, accelerating at a CAGR of 5.44% during the forecast period. Our report on the cytomegalovirus (CMV) therapeutics market provides a holistic analysis, market size and forecast, trends, growth drivers, and challenges, as well as vendor analysis covering around 25 vendors.
The report offers an up-to-date analysis of the current global market scenario, the latest trends and drivers, and the overall market environment. The market is driven by growing risk factors for CMV, the recurring nature of the disease, and the high prevalence of congenital CMV.
The cytomegalovirus (CMV) therapeutics market analysis includes the route of administration segment and geographic landscape.
Technavio's cytomegalovirus (CMV) therapeutics market is segmented as below:
By Route of Administration
- Oral
- Parenteral
- Others
By Geographical Landscape
- North America
- Europe
- Asia
- Rest of World (ROW)
This study identifies the reformulation of drugs as one of the prime reasons driving the cytomegalovirus (CMV) therapeutics market growth during the next few years. Also, the advent of vaccines and newborn screening will lead to sizable demand in the market.
Technavio presents a detailed picture of the market by the way of study, synthesis, and summation of data from multiple sources by an analysis of key parameters. Our report on the cytomegalovirus (CMV) therapeutics market covers the following areas:
- Cytomegalovirus (CMV) therapeutics market sizing
- Cytomegalovirus (CMV) therapeutics market forecast
- Cytomegalovirus (CMV) therapeutics market industry analysis
Technavio's robust vendor analysis is designed to help clients improve their market position, and in line with this, this report provides a detailed analysis of several leading cytomegalovirus (CMV) therapeutics market vendors that include Astellas Pharma Inc., AstraZeneca Plc, Bausch Health Companies Inc., Chimerix Inc., Clinigen Group Plc, Exela Pharma Sciences LLC, F. Hoffmann La Roche Ltd., Fortress Biotech Inc., Fresenius SE, and Co. KGaA, Genentech Inc., Gilead Sciences Inc., Merck and Co. Inc., Takeda Pharmaceutical Co. Ltd., Teva Pharmaceutical Industries Ltd., Thermo Fisher Scientific Inc., UbiVac, and VBI Vaccines Inc. Also, the cytomegalovirus (CMV) therapeutics market analysis report includes information on upcoming trends and challenges that will influence market growth. This is to help companies strategize and leverage all forthcoming growth opportunities.
The study was conducted using an objective combination of primary and secondary information including inputs from key participants in the industry. The report contains a comprehensive market and vendor landscape in addition to an analysis of the key vendors.
Technavio presents a detailed picture of the market by the way of study, synthesis, and summation of data from multiple sources by an analysis of key parameters such as profit, pricing, competition, and promotions. It presents various market facets by identifying the key industry influencers. The data presented is comprehensive, reliable, and a result of extensive research - both primary and secondary. Technavio's market research reports provide a complete competitive landscape and an in-depth vendor selection methodology and analysis using qualitative and quantitative research to forecast accurate market growth.
Table of Contents
1 Executive Summary
- 1.1 Market overview
- Exhibit 01: Executive Summary - Chart on Market Overview
- Exhibit 02: Executive Summary - Data Table on Market Overview
- Exhibit 03: Executive Summary - Chart on Global Market Characteristics
- Exhibit 04: Executive Summary - Chart on Market By Geographical Landscape
- Exhibit 05: Executive Summary - Chart on Market Segmentation by Route of Administration
- Exhibit 06: Executive Summary - Chart on Incremental Growth
- Exhibit 07: Executive Summary - Data Table on Incremental Growth
- Exhibit 08: Executive Summary - Chart on Vendor Market Positioning
2 Market Landscape
- 2.1 Market ecosystem
- Exhibit 09: Parent market
- Exhibit 10: Market Characteristics
3 Market Sizing
- 3.1 Market definition
- Exhibit 11: Offerings of vendors included in the market definition
- 3.2 Market segment analysis
- Exhibit 12: Market segments
- 3.3 Market size 2021
- 3.4 Market outlook: Forecast for 2021-2026
- Exhibit 13: Chart on Global - Market size and forecast 2021-2026 ($ million)
- Exhibit 14: Data Table on Global - Market size and forecast 2021-2026 ($ million)
- Exhibit 15: Chart on Global Market: Year-over-year growth 2021-2026 (%)
- Exhibit 16: Data Table on Global Market: Year-over-year growth 2021-2026 (%)
4 Five Forces Analysis
- 4.1 Five forces summary
- Exhibit 17: Five forces analysis - Comparison between2021 and 2026
- 4.2 Bargaining power of buyers
- Exhibit 18: Chart on Bargaining power of buyers - Impact of key factors 2021 and 2026
- 4.3 Bargaining power of suppliers
- Exhibit 19: Bargaining power of suppliers - Impact of key factors in 2021 and 2026
- 4.4 Threat of new entrants
- Exhibit 20: Threat of new entrants - Impact of key factors in 2021 and 2026
- 4.5 Threat of substitutes
- Exhibit 21: Threat of substitutes - Impact of key factors in 2021 and 2026
- 4.6 Threat of rivalry
- Exhibit 22: Threat of rivalry - Impact of key factors in 2021 and 2026
- 4.7 Market condition
- Exhibit 23: Chart on Market condition - Five forces 2021 and 2026
5 Market Segmentation by Route of Administration
- 5.1 Market segments
- Exhibit 24: Chart on Route of Administration - Market share 2021-2026 (%)
- Exhibit 25: Data Table on Route of Administration - Market share 2021-2026 (%)
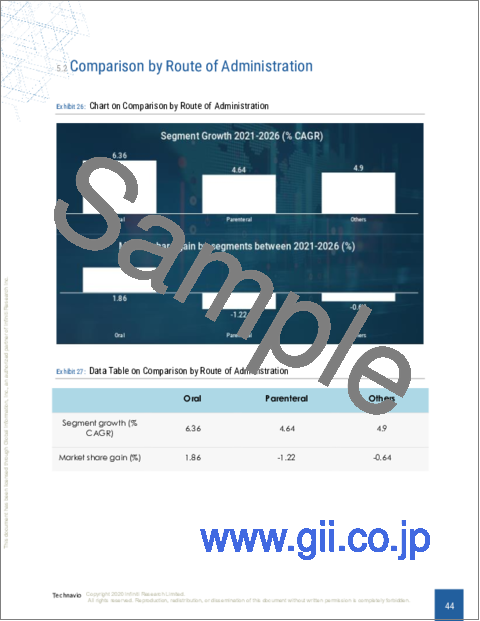
- 5.2 Comparison by Route of Administration
- Exhibit 26: Chart on Comparison by Route of Administration
- Exhibit 27: Data Table on Comparison by Route of Administration
- 5.3 Oral - Market size and forecast 2021-2026
- Exhibit 28: Chart on Oral - Market size and forecast 2021-2026 ($ million)
- Exhibit 29: Data Table on Oral - Market size and forecast 2021-2026 ($ million)
- Exhibit 30: Chart on Oral - Year-over-year growth 2021-2026 (%)
- Exhibit 31: Data Table on Oral - Year-over-year growth 2021-2026 (%)
- 5.4 Parenteral - Market size and forecast 2021-2026
- Exhibit 32: Chart on Parenteral - Market size and forecast 2021-2026 ($ million)
- Exhibit 33: Data Table on Parenteral - Market size and forecast 2021-2026 ($ million)
- Exhibit 34: Chart on Parenteral - Year-over-year growth 2021-2026 (%)
- Exhibit 35: Data Table on Parenteral - Year-over-year growth 2021-2026 (%)
- 5.5 Others - Market size and forecast 2021-2026
- Exhibit 36: Chart on Others - Market size and forecast 2021-2026 ($ million)
- Exhibit 37: Data Table on Others - Market size and forecast 2021-2026 ($ million)
- Exhibit 38: Chart on Others - Year-over-year growth 2021-2026 (%)
- Exhibit 39: Data Table on Others - Year-over-year growth 2021-2026 (%)
- 5.6 Market opportunity by Route of Administration
- Exhibit 40: Market opportunity by Route of Administration ($ million)
6 Customer Landscape
- 6.1 Customer landscape overview
- Exhibit 41: Analysis of price sensitivity, lifecycle, customer purchase basket, adoption rates, and purchase criteria
7 Geographic Landscape
- 7.1 Geographic segmentation
- Exhibit 42: Chart on Market share By Geographical Landscape 2021-2026 (%)
- Exhibit 43: Data Table on Market share By Geographical Landscape 2021-2026 (%)
- 7.2 Geographic comparison
- Exhibit 44: Chart on Geographic comparison
- Exhibit 45: Data Table on Geographic comparison
- 7.3 North America - Market size and forecast 2021-2026
- Exhibit 46: Chart on North America - Market size and forecast 2021-2026 ($ million)
- Exhibit 47: Data Table on North America - Market size and forecast 2021-2026 ($ million)
- Exhibit 48: Chart on North America - Year-over-year growth 2021-2026 (%)
- Exhibit 49: Data Table on North America - Year-over-year growth 2021-2026 (%)
- 7.4 Europe - Market size and forecast 2021-2026
- Exhibit 50: Chart on Europe - Market size and forecast 2021-2026 ($ million)
- Exhibit 51: Data Table on Europe - Market size and forecast 2021-2026 ($ million)
- Exhibit 52: Chart on Europe - Year-over-year growth 2021-2026 (%)
- Exhibit 53: Data Table on Europe - Year-over-year growth 2021-2026 (%)
- 7.5 Asia - Market size and forecast 2021-2026
- Exhibit 54: Chart on Asia - Market size and forecast 2021-2026 ($ million)
- Exhibit 55: Data Table on Asia - Market size and forecast 2021-2026 ($ million)
- Exhibit 56: Chart on Asia - Year-over-year growth 2021-2026 (%)
- Exhibit 57: Data Table on Asia - Year-over-year growth 2021-2026 (%)
- 7.6 Rest of World (ROW) - Market size and forecast 2021-2026
- Exhibit 58: Chart on Rest of World (ROW) - Market size and forecast 2021-2026 ($ million)
- Exhibit 59: Data Table on Rest of World (ROW) - Market size and forecast 2021-2026 ($ million)
- Exhibit 60: Chart on Rest of World (ROW) - Year-over-year growth 2021-2026 (%)
- Exhibit 61: Data Table on Rest of World (ROW) - Year-over-year growth 2021-2026 (%)
- 7.7 US - Market size and forecast 2021-2026
- Exhibit 62: Chart on US - Market size and forecast 2021-2026 ($ million)
- Exhibit 63: Data Table on US - Market size and forecast 2021-2026 ($ million)
- Exhibit 64: Chart on US - Year-over-year growth 2021-2026 (%)
- Exhibit 65: Data Table on US - Year-over-year growth 2021-2026 (%)
- 7.8 Denmark - Market size and forecast 2021-2026
- Exhibit 66: Chart on Denmark - Market size and forecast 2021-2026 ($ million)
- Exhibit 67: Data Table on Denmark - Market size and forecast 2021-2026 ($ million)
- Exhibit 68: Chart on Denmark - Year-over-year growth 2021-2026 (%)
- Exhibit 69: Data Table on Denmark - Year-over-year growth 2021-2026 (%)
- 7.9 China - Market size and forecast 2021-2026
- Exhibit 70: Chart on China - Market size and forecast 2021-2026 ($ million)
- Exhibit 71: Data Table on China - Market size and forecast 2021-2026 ($ million)
- Exhibit 72: Chart on China - Year-over-year growth 2021-2026 (%)
- Exhibit 73: Data Table on China - Year-over-year growth 2021-2026 (%)
- 7.10 Canada - Market size and forecast 2021-2026
- Exhibit 74: Chart on Canada - Market size and forecast 2021-2026 ($ million)
- Exhibit 75: Data Table on Canada - Market size and forecast 2021-2026 ($ million)
- Exhibit 76: Chart on Canada - Year-over-year growth 2021-2026 (%)
- Exhibit 77: Data Table on Canada - Year-over-year growth 2021-2026 (%)
- 7.11 India - Market size and forecast 2021-2026
- Exhibit 78: Chart on India - Market size and forecast 2021-2026 ($ million)
- Exhibit 79: Data Table on India - Market size and forecast 2021-2026 ($ million)
- Exhibit 80: Chart on India - Year-over-year growth 2021-2026 (%)
- Exhibit 81: Data Table on India - Year-over-year growth 2021-2026 (%)
- 7.12 Market opportunity By Geographical Landscape
- Exhibit 82: Market opportunity By Geographical Landscape ($ million)
8 Drivers, Challenges, and Trends
- 8.1 Market drivers
- 8.2 Market challenges
- 8.3 Impact of drivers and challenges
- Exhibit 83: Impact of drivers and challenges in 2021 and 2026
- 8.4 Market trends
9 Vendor Landscape
- 9.1 Overview
- 9.2 Vendor landscape
- Exhibit 84: Overview on Criticality of inputs and Factors of differentiation
- 9.3 Landscape disruption
- Exhibit 85: Overview on factors of disruption
- 9.4 Industry risks
- Exhibit 86: Impact of key risks on business
10 Vendor Analysis
- 10.1 Vendors covered
- Exhibit 87: Vendors covered
- 10.2 Market positioning of vendors
- Exhibit 88: Matrix on vendor position and classification
- 10.3 AstraZeneca Plc
- Exhibit 89: AstraZeneca Plc - Overview
- Exhibit 90: AstraZeneca Plc - Product / Service
- Exhibit 91: AstraZeneca Plc - Key news
- Exhibit 92: AstraZeneca Plc - Key offerings
- 10.4 Bausch Health Companies Inc.
- Exhibit 93: Bausch Health Companies Inc. - Overview
- Exhibit 94: Bausch Health Companies Inc. - Business segments
- Exhibit 95: Bausch Health Companies Inc. - Key news
- Exhibit 96: Bausch Health Companies Inc. - Key offerings
- Exhibit 97: Bausch Health Companies Inc. - Segment focus
- 10.5 Chimerix Inc.
- Exhibit 98: Chimerix Inc. - Overview
- Exhibit 99: Chimerix Inc. - Product / Service
- Exhibit 100: Chimerix Inc. - Key offerings
- 10.6 Exela Pharma Sciences LLC
- Exhibit 101: Exela Pharma Sciences LLC - Overview
- Exhibit 102: Exela Pharma Sciences LLC - Product / Service
- Exhibit 103: Exela Pharma Sciences LLC - Key offerings
- 10.7 F. Hoffmann La Roche Ltd.
- Exhibit 104: F. Hoffmann La Roche Ltd. - Overview
- Exhibit 105: F. Hoffmann La Roche Ltd. - Business segments
- Exhibit 106: F. Hoffmann La Roche Ltd. - Key news
- Exhibit 107: F. Hoffmann La Roche Ltd. - Key offerings
- Exhibit 108: F. Hoffmann La Roche Ltd. - Segment focus
- 10.8 Fortress Biotech Inc.
- Exhibit 109: Fortress Biotech Inc. - Overview
- Exhibit 110: Fortress Biotech Inc. - Business segments
- Exhibit 111: Fortress Biotech Inc. - Key offerings
- Exhibit 112: Fortress Biotech Inc. - Segment focus
- 10.9 Gilead Sciences Inc.
- Exhibit 113: Gilead Sciences Inc. - Overview
- Exhibit 114: Gilead Sciences Inc. - Product / Service
- Exhibit 115: Gilead Sciences Inc. - Key news
- Exhibit 116: Gilead Sciences Inc. - Key offerings
- 10.10 Merck and Co. Inc.
- Exhibit 117: Merck and Co. Inc. - Overview
- Exhibit 118: Merck and Co. Inc. - Business segments
- Exhibit 119: Merck and Co. Inc. - Key news
- Exhibit 120: Merck and Co. Inc. - Key offerings
- Exhibit 121: Merck and Co. Inc. - Segment focus
- 10.11 Takeda Pharmaceutical Co. Ltd.
- Exhibit 122: Takeda Pharmaceutical Co. Ltd. - Overview
- Exhibit 123: Takeda Pharmaceutical Co. Ltd. - Product / Service
- Exhibit 124: Takeda Pharmaceutical Co. Ltd. - Key news
- Exhibit 125: Takeda Pharmaceutical Co. Ltd. - Key offerings
- 10.12 Teva Pharmaceutical Industries Ltd.
- Exhibit 126: Teva Pharmaceutical Industries Ltd. - Overview
- Exhibit 127: Teva Pharmaceutical Industries Ltd. - Business segments
- Exhibit 128: Teva Pharmaceutical Industries Ltd. - Key news
- Exhibit 129: Teva Pharmaceutical Industries Ltd. - Key offerings
- Exhibit 130: Teva Pharmaceutical Industries Ltd. - Segment focus
11 Appendix
- 11.1 Scope of the report
- 11.2 Inclusions and exclusions checklist
- Exhibit 131: Inclusions checklist
- Exhibit 132: Exclusions checklist
- 11.3 Currency conversion rates for US$
- Exhibit 133: Currency conversion rates for US$
- 11.4 Research methodology
- Exhibit 134: Research methodology
- Exhibit 135: Validation techniques employed for market sizing
- Exhibit 136: Information sources
- 11.5 List of abbreviations
- Exhibit 137: List of abbreviations