|
|
市場調査レポート
商品コード
1111297
カーワックスの世界市場(2022年~2026年)Global Car Wax Market 2022-2026 |
||||||
|
|
|||||||
|
● お客様のご希望に応じて、既存データの加工や未掲載情報(例:国別セグメント)の追加などの対応が可能です。 詳細はお問い合わせください。 |
|||||||


| カーワックスの世界市場(2022年~2026年) |
|
出版日: 2022年08月05日
発行: TechNavio
ページ情報: 英文 120 Pages
納期: 即納可能
|
- 全表示
- 概要
- 図表
- 目次
世界のカーワックスの市場規模は、2022年から2026年の間に5.94%のCAGRで推移し、5億560万米ドルの成長が見込まれています。
同市場の成長を後押しする主な要因には、自動車の寿命が延びたことによる自動車の普及、主要国での可処分所得の増加、自動車の再販価値を高めるカーワックス、高級グレードのカーワックスの開拓、自動車用品のオンライン販売などが挙げられます。
当レポートでは、世界のカーワックス市場を調査しており、市場の概要、市場規模や予測、動向、成長要因および課題、顧客情勢、タイプ・地域別の分析、さらにベンダー情勢およびベンダー分析などを提供しています。
目次
第1章 エグゼクティブサマリー
- 市場概要
第2章 市場情勢
- 市場エコシステム
第3章 市場規模
- 市場の定義
- 市場セグメント分析
- 市場規模:2021年
- 市場の見通し:2021年から2026年の予測
第4章 ファイブフォース分析
- ファイブフォースサマリー
- 買い手の交渉力
- 供給企業の交渉力
- 新規参入業者の脅威
- 代替品の脅威
- 競争の脅威
- 市況
第5章 タイプ別の市場セグメンテーション
- 市場内訳
- タイプ別比較
- 合成ワックス-市場規模と予測(2021年~2026年)
- 天然ワックス-市場規模と予測(2021年~2026年)
- タイプ別の市場機会
第6章 顧客情勢
- 顧客情勢の概要
第7章 地域別の情勢
- 地域別セグメンテーション
- 地域別比較
- アジア太平洋-市場規模と予測(2021年~2026年)
- 北米-市場規模と予測(2021年~2026年)
- 欧州-市場規模と予測(2021年~2026年)
- 南米-市場規模と予測(2021年~2026年)
- 中東およびアフリカ-市場規模と予測(2021年~2026年)
- 米国-市場規模と予測(2021年~2026年)
- 中国-市場規模と予測(2021年~2026年)
- ドイツ-市場規模と予測(2021年~2026年)
- 日本-市場規模と予測(2021年~2026年)
- 英国-市場規模と予測(2021年~2026年)
- 地域情勢別の市場機会
第8章 促進要因、課題、および動向
- 市場促進要因
- 市場の課題
- 推進要因と課題の影響
- 市場動向
第9章 ベンダー情勢
- 概要
- ベンダー情勢
- 混乱情勢
- 業界のリスク
第10章 ベンダー分析
- 対象ベンダー
- ベンダーの市場ポジショニング
- 3M Co.
- Aero Cosmetics Products LLC
- Chemical Guys
- Henkel AG and Co. KGaA
- Malco Products Inc.
- Mitchell and King Car Wax and Detailing Products
- Mothers Polishes Waxes Cleaners Inc.
- SONAX GmbH
- The Darent Wax Company Ltd.
- Turtle Wax Inc.
第11章 付録
Exhibits:
- Exhibits1: Executive Summary - Chart on Market Overview
- Exhibits2: Executive Summary - Data Table on Market Overview
- Exhibits3: Executive Summary - Chart on Global Market Characteristics
- Exhibits4: Executive Summary - Chart on Market By Geographical Landscape
- Exhibits5: Executive Summary - Chart on Market Segmentation by Type
- Exhibits6: Executive Summary - Chart on Incremental Growth
- Exhibits7: Executive Summary - Data Table on Incremental Growth
- Exhibits8: Executive Summary - Chart on Vendor Market Positioning
- Exhibits9: Parent market
- Exhibits10: Market Characteristics
- Exhibits11: Offerings of vendors included in the market definition
- Exhibits12: Market segments
- Exhibits13: Chart on Global - Market size and forecast 2021-2026 ($ million)
- Exhibits14: Data Table on Global - Market size and forecast 2021-2026 ($ million)
- Exhibits15: Chart on Global Market: Year-over-year growth 2021-2026 (%)
- Exhibits16: Data Table on Global Market: Year-over-year growth 2021-2026 (%)
- Exhibits17: Five forces analysis - Comparison between 2021 and 2026
- Exhibits18: Chart on Bargaining power of buyers - Impact of key factors 2021 and 2026
- Exhibits19: Bargaining power of suppliers - Impact of key factors in 2021 and 2026
- Exhibits20: Threat of new entrants - Impact of key factors in 2021 and 2026
- Exhibits21: Threat of substitutes - Impact of key factors in 2021 and 2026
- Exhibits22: Threat of rivalry - Impact of key factors in 2021 and 2026
- Exhibits23: Chart on Market condition - Five forces 2021 and 2026
- Exhibits24: Chart on Type - Market share 2021-2026 (%)
- Exhibits25: Data Table on Type - Market share 2021-2026 (%)
- Exhibits26: Chart on Comparison by Type
- Exhibits27: Data Table on Comparison by Type
- Exhibits28: Chart on Synthetic wax - Market size and forecast 2021-2026 ($ million)
- Exhibits29: Data Table on Synthetic wax - Market size and forecast 2021-2026 ($ million)
- Exhibits30: Chart on Synthetic wax - Year-over-year growth 2021-2026 (%)
- Exhibits31: Data Table on Synthetic wax - Year-over-year growth 2021-2026 (%)
- Exhibits32: Chart on Natural wax - Market size and forecast 2021-2026 ($ million)
- Exhibits33: Data Table on Natural wax - Market size and forecast 2021-2026 ($ million)
- Exhibits34: Chart on Natural wax - Year-over-year growth 2021-2026 (%)
- Exhibits35: Data Table on Natural wax - Year-over-year growth 2021-2026 (%)
- Exhibits36: Market opportunity by Type ($ million)
- Exhibits37: Analysis of price sensitivity, lifecycle, customer purchase basket, adoption rates, and purchase criteria
- Exhibits38: Chart on Market share By Geographical Landscape 2021-2026 (%)
- Exhibits39: Data Table on Market share By Geographical Landscape 2021-2026 (%)
- Exhibits40: Chart on Geographic comparison
- Exhibits41: Data Table on Geographic comparison
- Exhibits42: Chart on APAC - Market size and forecast 2021-2026 ($ million)
- Exhibits43: Data Table on APAC - Market size and forecast 2021-2026 ($ million)
- Exhibits44: Chart on APAC - Year-over-year growth 2021-2026 (%)
- Exhibits45: Data Table on APAC - Year-over-year growth 2021-2026 (%)
- Exhibits46: Chart on North America - Market size and forecast 2021-2026 ($ million)
- Exhibits47: Data Table on North America - Market size and forecast 2021-2026 ($ million)
- Exhibits48: Chart on North America - Year-over-year growth 2021-2026 (%)
- Exhibits49: Data Table on North America - Year-over-year growth 2021-2026 (%)
- Exhibits50: Chart on Europe - Market size and forecast 2021-2026 ($ million)
- Exhibits51: Data Table on Europe - Market size and forecast 2021-2026 ($ million)
- Exhibits52: Chart on Europe - Year-over-year growth 2021-2026 (%)
- Exhibits53: Data Table on Europe - Year-over-year growth 2021-2026 (%)
- Exhibits54: Chart on South America - Market size and forecast 2021-2026 ($ million)
- Exhibits55: Data Table on South America - Market size and forecast 2021-2026 ($ million)
- Exhibits56: Chart on South America - Year-over-year growth 2021-2026 (%)
- Exhibits57: Data Table on South America - Year-over-year growth 2021-2026 (%)
- Exhibits58: Chart on Middle East and Africa - Market size and forecast 2021-2026 ($ million)
- Exhibits59: Data Table on Middle East and Africa - Market size and forecast 2021-2026 ($ million)
- Exhibits60: Chart on Middle East and Africa - Year-over-year growth 2021-2026 (%)
- Exhibits61: Data Table on Middle East and Africa - Year-over-year growth 2021-2026 (%)
- Exhibits62: Chart on US - Market size and forecast 2021-2026 ($ million)
- Exhibits63: Data Table on US - Market size and forecast 2021-2026 ($ million)
- Exhibits64: Chart on US - Year-over-year growth 2021-2026 (%)
- Exhibits65: Data Table on US - Year-over-year growth 2021-2026 (%)
- Exhibits66: Chart on China - Market size and forecast 2021-2026 ($ million)
- Exhibits67: Data Table on China - Market size and forecast 2021-2026 ($ million)
- Exhibits68: Chart on China - Year-over-year growth 2021-2026 (%)
- Exhibits69: Data Table on China - Year-over-year growth 2021-2026 (%)
- Exhibits70: Chart on Germany - Market size and forecast 2021-2026 ($ million)
- Exhibits71: Data Table on Germany - Market size and forecast 2021-2026 ($ million)
- Exhibits72: Chart on Germany - Year-over-year growth 2021-2026 (%)
- Exhibits73: Data Table on Germany - Year-over-year growth 2021-2026 (%)
- Exhibits74: Chart on Japan - Market size and forecast 2021-2026 ($ million)
- Exhibits75: Data Table on Japan - Market size and forecast 2021-2026 ($ million)
- Exhibits76: Chart on Japan - Year-over-year growth 2021-2026 (%)
- Exhibits77: Data Table on Japan - Year-over-year growth 2021-2026 (%)
- Exhibits78: Chart on UK - Market size and forecast 2021-2026 ($ million)
- Exhibits79: Data Table on UK - Market size and forecast 2021-2026 ($ million)
- Exhibits80: Chart on UK - Year-over-year growth 2021-2026 (%)
- Exhibits81: Data Table on UK - Year-over-year growth 2021-2026 (%)
- Exhibits82: Market opportunity By Geographical Landscape ($ million)
- Exhibits83: Impact of drivers and challenges in 2021 and 2026
- Exhibits84: Overview on Criticality of inputs and Factors of differentiation
- Exhibits85: Overview on factors of disruption
- Exhibits86: Impact of key risks on business
- Exhibits87: Vendors covered
- Exhibits88: Matrix on vendor position and classification
- Exhibits89: 3M Co. - Overview
- Exhibits90: 3M Co. - Business segments
- Exhibits91: 3M Co. - Key news
- Exhibits92: 3M Co. - Key offerings
- Exhibits93: 3M Co. - Segment focus
- Exhibits94: Aero Cosmetics Products LLC - Overview
- Exhibits95: Aero Cosmetics Products LLC - Product / Service
- Exhibits96: Aero Cosmetics Products LLC - Key offerings
- Exhibits97: Chemical Guys - Overview
- Exhibits98: Chemical Guys - Product / Service
- Exhibits99: Chemical Guys - Key offerings
- Exhibits100: Henkel AG and Co. KGaA - Overview
- Exhibits101: Henkel AG and Co. KGaA - Business segments
- Exhibits102: Henkel AG and Co. KGaA - Key news
- Exhibits103: Henkel AG and Co. KGaA - Key offerings
- Exhibits104: Henkel AG and Co. KGaA - Segment focus
- Exhibits105: Malco Products Inc. - Overview
- Exhibits106: Malco Products Inc. - Product / Service
- Exhibits107: Malco Products Inc. - Key offerings
- Exhibits108: Mitchell and King Car Wax and Detailing Products - Overview
- Exhibits109: Mitchell and King Car Wax and Detailing Products - Product / Service
- Exhibits110: Mitchell and King Car Wax and Detailing Products - Key offerings
- Exhibits111: Mothers Polishes Waxes Cleaners Inc. - Overview
- Exhibits112: Mothers Polishes Waxes Cleaners Inc. - Product / Service
- Exhibits113: Mothers Polishes Waxes Cleaners Inc. - Key offerings
- Exhibits114: SONAX GmbH - Overview
- Exhibits115: SONAX GmbH - Product / Service
- Exhibits116: SONAX GmbH - Key offerings
- Exhibits117: The Darent Wax Company Ltd. - Overview
- Exhibits118: The Darent Wax Company Ltd. - Product / Service
- Exhibits119: The Darent Wax Company Ltd. - Key offerings
- Exhibits120: Turtle Wax Inc. - Overview
- Exhibits121: Turtle Wax Inc. - Product / Service
- Exhibits122: Turtle Wax Inc. - Key offerings
- Exhibits123: Inclusions checklist
- Exhibits124: Exclusions checklist
- Exhibits125: Currency conversion rates for US$
- Exhibits126: Research methodology
- Exhibits127: Validation techniques employed for market sizing
- Exhibits128: Information sources
- Exhibits129: List of abbreviations
Technavio has been monitoring the car wax market and it is poised to grow by $ 505.6 mn during 2022-2026, accelerating at a CAGR of 5.94% during the forecast period. Our report on the car wax market provides a holistic analysis, market size and forecast, trends, growth drivers, and challenges, as well as vendor analysis covering around 25 vendors.
The report offers an up-to-date analysis of the current global market scenario, the latest trends and drivers, and the overall market environment. The market is driven by the proliferation of vehicles due to increases in their lifespan, growing disposable income in key economies, and car waxing enhancing car resale value.
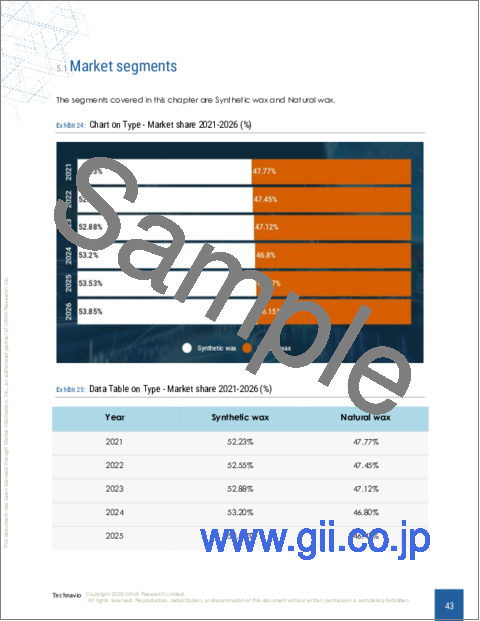
The car wax market analysis includes type segment and geographic landscape.
Technavio's car wax market is segmented as below:
By Type
- synthetic wax
- natural wax
By Geographical Landscape
- APAC
- North America
- Europe
- South America
- the Middle East and Africa
This study identifies the development of luxury-grade car wax as one of the prime reasons driving the car wax market growth during the next few years. Also, the growing popularity of mobile-based car detailing services and the convenience offered by the online availability of automotive products will lead to sizable demand in the market.
- Car wax market sizing
- Car wax market forecast
- Car wax market industry analysis
Technavio's robust vendor analysis is designed to help clients improve their market position, and in line with this, this report provides a detailed analysis of several leading car wax market vendors that include 3M Co., Aero Cosmetics Products LLC, Chemical Guys, Henkel AG, and Co. KGaA, Malco Products Inc., Mitchell, and King Car Wax and Detailing Products, Mothers Polishes Waxes Cleaners Inc., SONAX GmbH, The Darent Wax Company Ltd., Turtle Wax Inc., West Drive LLC, Zhongshan Tekoro Car Care Products Co. Ltd., and Sheeba India Pvt. Ltd. Also, the car wax market analysis report includes information on upcoming trends and challenges that will influence market growth. This is to help companies strategize and leverage all forthcoming growth opportunities.
The study was conducted using an objective combination of primary and secondary information including inputs from key participants in the industry. The report contains a comprehensive market and vendor landscape in addition to an analysis of the key vendors.
Table of Contents
1 Executive Summary
- 1.1 Market overview
- Exhibit 01: Executive Summary - Chart on Market Overview
- Exhibit 02: Executive Summary - Data Table on Market Overview
- Exhibit 03: Executive Summary - Chart on Global Market Characteristics
- Exhibit 04: Executive Summary - Chart on Market By Geographical Landscape
- Exhibit 05: Executive Summary - Chart on Market Segmentation by Type
- Exhibit 06: Executive Summary - Chart on Incremental Growth
- Exhibit 07: Executive Summary - Data Table on Incremental Growth
- Exhibit 08: Executive Summary - Chart on Vendor Market Positioning
2 Market Landscape
- 2.1 Market ecosystem
- Exhibit 09: Parent market
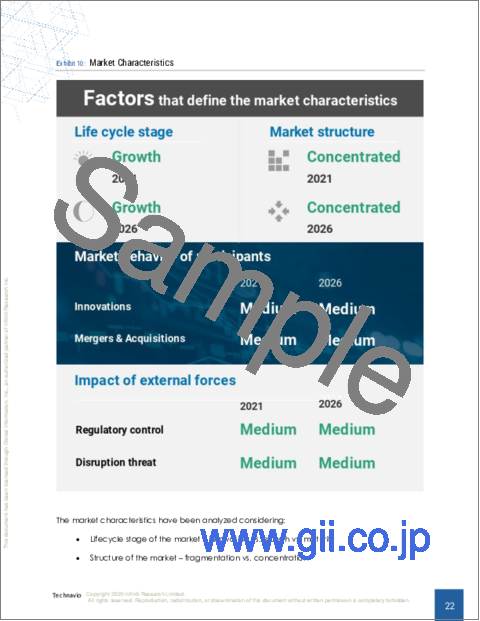
- Exhibit 10: Market Characteristics
3 Market Sizing
- 3.1 Market definition
- Exhibit 11: Offerings of vendors included in the market definition
- 3.2 Market segment analysis
- Exhibit 12: Market segments
- 3.3 Market size 2021
- 3.4 Market outlook: Forecast for 2021-2026
- Exhibit 13: Chart on Global - Market size and forecast 2021-2026 ($ million)
- Exhibit 14: Data Table on Global - Market size and forecast 2021-2026 ($ million)
- Exhibit 15: Chart on Global Market: Year-over-year growth 2021-2026 (%)
- Exhibit 16: Data Table on Global Market: Year-over-year growth 2021-2026 (%)
4 Five Forces Analysis
- 4.1 Five forces summary
- Exhibit 17: Five forces analysis - Comparison between 2021 and 2026
- 4.2 Bargaining power of buyers
- Exhibit 18: Chart on Bargaining power of buyers - Impact of key factors 2021 and 2026
- 4.3 Bargaining power of suppliers
- Exhibit 19: Bargaining power of suppliers - Impact of key factors in 2021 and 2026
- 4.4 Threat of new entrants
- Exhibit 20: Threat of new entrants - Impact of key factors in 2021 and 2026
- 4.5 Threat of substitutes
- Exhibit 21: Threat of substitutes - Impact of key factors in 2021 and 2026
- 4.6 Threat of rivalry
- Exhibit 22: Threat of rivalry - Impact of key factors in 2021 and 2026
- 4.7 Market condition
- Exhibit 23: Chart on Market condition - Five forces 2021 and 2026
5 Market Segmentation by Type
- 5.1 Market segments
- Exhibit 24: Chart on Type - Market share 2021-2026 (%)
- Exhibit 25: Data Table on Type - Market share 2021-2026 (%)
- 5.2 Comparison by Type
- Exhibit 26: Chart on Comparison by Type
- Exhibit 27: Data Table on Comparison by Type
- 5.3 Synthetic wax - Market size and forecast 2021-2026
- Exhibit 28: Chart on Synthetic wax - Market size and forecast 2021-2026 ($ million)
- Exhibit 29: Data Table on Synthetic wax - Market size and forecast 2021-2026 ($ million)
- Exhibit 30: Chart on Synthetic wax - Year-over-year growth 2021-2026 (%)
- Exhibit 31: Data Table on Synthetic wax - Year-over-year growth 2021-2026 (%)
- 5.4 Natural wax - Market size and forecast 2021-2026
- Exhibit 32: Chart on Natural wax - Market size and forecast 2021-2026 ($ million)
- Exhibit 33: Data Table on Natural wax - Market size and forecast 2021-2026 ($ million)
- Exhibit 34: Chart on Natural wax - Year-over-year growth 2021-2026 (%)
- Exhibit 35: Data Table on Natural wax - Year-over-year growth 2021-2026 (%)
- 5.5 Market opportunity by Type
- Exhibit 36: Market opportunity by Type ($ million)
6 Customer Landscape
- 6.1 Customer landscape overview
- Exhibit 37: Analysis of price sensitivity, lifecycle, customer purchase basket, adoption rates, and purchase criteria
7 Geographic Landscape
- 7.1 Geographic segmentation
- Exhibit 38: Chart on Market share By Geographical Landscape 2021-2026 (%)
- Exhibit 39: Data Table on Market share By Geographical Landscape 2021-2026 (%)
- 7.2 Geographic comparison
- Exhibit 40: Chart on Geographic comparison
- Exhibit 41: Data Table on Geographic comparison
- 7.3 APAC - Market size and forecast 2021-2026
- Exhibit 42: Chart on APAC - Market size and forecast 2021-2026 ($ million)
- Exhibit 43: Data Table on APAC - Market size and forecast 2021-2026 ($ million)
- Exhibit 44: Chart on APAC - Year-over-year growth 2021-2026 (%)
- Exhibit 45: Data Table on APAC - Year-over-year growth 2021-2026 (%)
- 7.4 North America - Market size and forecast 2021-2026
- Exhibit 46: Chart on North America - Market size and forecast 2021-2026 ($ million)
- Exhibit 47: Data Table on North America - Market size and forecast 2021-2026 ($ million)
- Exhibit 48: Chart on North America - Year-over-year growth 2021-2026 (%)
- Exhibit 49: Data Table on North America - Year-over-year growth 2021-2026 (%)
- 7.5 Europe - Market size and forecast 2021-2026
- Exhibit 50: Chart on Europe - Market size and forecast 2021-2026 ($ million)
- Exhibit 51: Data Table on Europe - Market size and forecast 2021-2026 ($ million)
- Exhibit 52: Chart on Europe - Year-over-year growth 2021-2026 (%)
- Exhibit 53: Data Table on Europe - Year-over-year growth 2021-2026 (%)
- 7.6 South America - Market size and forecast 2021-2026
- Exhibit 54: Chart on South America - Market size and forecast 2021-2026 ($ million)
- Exhibit 55: Data Table on South America - Market size and forecast 2021-2026 ($ million)
- Exhibit 56: Chart on South America - Year-over-year growth 2021-2026 (%)
- Exhibit 57: Data Table on South America - Year-over-year growth 2021-2026 (%)
- 7.7 Middle East and Africa - Market size and forecast 2021-2026
- Exhibit 58: Chart on Middle East and Africa - Market size and forecast 2021-2026 ($ million)
- Exhibit 59: Data Table on Middle East and Africa - Market size and forecast 2021-2026 ($ million)
- Exhibit 60: Chart on Middle East and Africa - Year-over-year growth 2021-2026 (%)
- Exhibit 61: Data Table on Middle East and Africa - Year-over-year growth 2021-2026 (%)
- 7.8 US - Market size and forecast 2021-2026
- Exhibit 62: Chart on US - Market size and forecast 2021-2026 ($ million)
- Exhibit 63: Data Table on US - Market size and forecast 2021-2026 ($ million)
- Exhibit 64: Chart on US - Year-over-year growth 2021-2026 (%)
- Exhibit 65: Data Table on US - Year-over-year growth 2021-2026 (%)
- 7.9 China - Market size and forecast 2021-2026
- Exhibit 66: Chart on China - Market size and forecast 2021-2026 ($ million)
- Exhibit 67: Data Table on China - Market size and forecast 2021-2026 ($ million)
- Exhibit 68: Chart on China - Year-over-year growth 2021-2026 (%)
- Exhibit 69: Data Table on China - Year-over-year growth 2021-2026 (%)
- 7.10 Germany - Market size and forecast 2021-2026
- Exhibit 70: Chart on Germany - Market size and forecast 2021-2026 ($ million)
- Exhibit 71: Data Table on Germany - Market size and forecast 2021-2026 ($ million)
- Exhibit 72: Chart on Germany - Year-over-year growth 2021-2026 (%)
- Exhibit 73: Data Table on Germany - Year-over-year growth 2021-2026 (%)
- 7.11 Japan - Market size and forecast 2021-2026
- Exhibit 74: Chart on Japan - Market size and forecast 2021-2026 ($ million)
- Exhibit 75: Data Table on Japan - Market size and forecast 2021-2026 ($ million)
- Exhibit 76: Chart on Japan - Year-over-year growth 2021-2026 (%)
- Exhibit 77: Data Table on Japan - Year-over-year growth 2021-2026 (%)
- 7.12 UK - Market size and forecast 2021-2026
- Exhibit 78: Chart on UK - Market size and forecast 2021-2026 ($ million)
- Exhibit 79: Data Table on UK - Market size and forecast 2021-2026 ($ million)
- Exhibit 80: Chart on UK - Year-over-year growth 2021-2026 (%)
- Exhibit 81: Data Table on UK - Year-over-year growth 2021-2026 (%)
- 7.13 Market opportunity By Geographical Landscape
- Exhibit 82: Market opportunity By Geographical Landscape ($ million)
8 Drivers, Challenges, and Trends
- 8.1 Market drivers
- 8.2 Market challenges
- 8.3 Impact of drivers and challenges
- Exhibit 83: Impact of drivers and challenges in 2021 and 2026
- 8.4 Market trends
9 Vendor Landscape
- 9.1 Overview
- 9.2 Vendor landscape
- Exhibit 84: Overview on Criticality of inputs and Factors of differentiation
- 9.3 Landscape disruption
- Exhibit 85: Overview on factors of disruption
- 9.4 Industry risks
- Exhibit 86: Impact of key risks on business
10 Vendor Analysis
- 10.1 Vendors covered
- Exhibit 87: Vendors covered
- 10.2 Market positioning of vendors
- Exhibit 88: Matrix on vendor position and classification
- 10.3 3M Co.
- Exhibit 89: 3M Co. - Overview
- Exhibit 90: 3M Co. - Business segments
- Exhibit 91: 3M Co. - Key news
- Exhibit 92: 3M Co. - Key offerings
- Exhibit 93: 3M Co. - Segment focus
- 10.4 Aero Cosmetics Products LLC
- Exhibit 94: Aero Cosmetics Products LLC - Overview
- Exhibit 95: Aero Cosmetics Products LLC - Product / Service
- Exhibit 96: Aero Cosmetics Products LLC - Key offerings
- 10.5 Chemical Guys
- Exhibit 97: Chemical Guys - Overview
- Exhibit 98: Chemical Guys - Product / Service
- Exhibit 99: Chemical Guys - Key offerings
- 10.6 Henkel AG and Co. KGaA
- Exhibit 100: Henkel AG and Co. KGaA - Overview
- Exhibit 101: Henkel AG and Co. KGaA - Business segments
- Exhibit 102: Henkel AG and Co. KGaA - Key news
- Exhibit 103: Henkel AG and Co. KGaA - Key offerings
- Exhibit 104: Henkel AG and Co. KGaA - Segment focus
- 10.7 Malco Products Inc.
- Exhibit 105: Malco Products Inc. - Overview
- Exhibit 106: Malco Products Inc. - Product / Service
- Exhibit 107: Malco Products Inc. - Key offerings
- 10.8 Mitchell and King Car Wax and Detailing Products
- Exhibit 108: Mitchell and King Car Wax and Detailing Products - Overview
- Exhibit 109: Mitchell and King Car Wax and Detailing Products - Product / Service
- Exhibit 110: Mitchell and King Car Wax and Detailing Products - Key offerings
- 10.9 Mothers Polishes Waxes Cleaners Inc.
- Exhibit 111: Mothers Polishes Waxes Cleaners Inc. - Overview
- Exhibit 112: Mothers Polishes Waxes Cleaners Inc. - Product / Service
- Exhibit 113: Mothers Polishes Waxes Cleaners Inc. - Key offerings
- 10.10 SONAX GmbH
- Exhibit 114: SONAX GmbH - Overview
- Exhibit 115: SONAX GmbH - Product / Service
- Exhibit 116: SONAX GmbH - Key offerings
- 10.11 The Darent Wax Company Ltd.
- Exhibit 117: The Darent Wax Company Ltd. - Overview
- Exhibit 118: The Darent Wax Company Ltd. - Product / Service
- Exhibit 119: The Darent Wax Company Ltd. - Key offerings
- 10.12 Turtle Wax Inc.
- Exhibit 120: Turtle Wax Inc. - Overview
- Exhibit 121: Turtle Wax Inc. - Product / Service
- Exhibit 122: Turtle Wax Inc. - Key offerings
11 Appendix
- 11.1 Scope of the report
- 11.2 Inclusions and exclusions checklist
- Exhibit 123: Inclusions checklist
- Exhibit 124: Exclusions checklist
- 11.3 Currency conversion rates for US$
- Exhibit 125: Currency conversion rates for US$
- 11.4 Research methodology
- Exhibit 126: Research methodology
- Exhibit 127: Validation techniques employed for market sizing
- Exhibit 128: Information sources
- 11.5 List of abbreviations
- Exhibit 129: List of abbreviations