|
|
市場調査レポート
商品コード
1105047
ビオラの世界市場:2022年~2026年Global Viola Market 2022-2026 |
||||||
|
|
|||||||
|
● お客様のご希望に応じて、既存データの加工や未掲載情報(例:国別セグメント)の追加などの対応が可能です。 詳細はお問い合わせください。 |
|||||||


| ビオラの世界市場:2022年~2026年 |
|
出版日: 2022年07月12日
発行: TechNavio
ページ情報: 英文 120 Pages
納期: 即納可能
|
- 全表示
- 概要
- 図表
- 目次
世界のビオラの市場規模は、2022年から2026年の間に577万米ドル成長し、予測期間中は2.13%のCAGRで成長する見込みです。
同市場は、Webベースの学習教材の入手可能性、教育の進歩、音楽関連のレジャー活動への関心の高まりなどに牽引されています。
当レポートでは、ビオラの世界市場の全体的な分析、市場規模と予測、動向、成長促進要因、課題、および約25のベンダーをカバーする分析を提供しています。
目次
第1章 エグゼクティブサマリー
- 市場概要
第2章 市場情勢
- 市場のエコシステム
第3章 市場規模
- 市場の定義
- 市場セグメント分析
- 2021年の市場規模
- 市場の見通し:2021年から2026年の予測
第4章 ファイブフォース分析
- ファイブフォースまとめ
- 買い手の交渉力
- 供給企業の交渉力
- 新規参入業者の脅威
- 代替品の脅威
- 競争の脅威
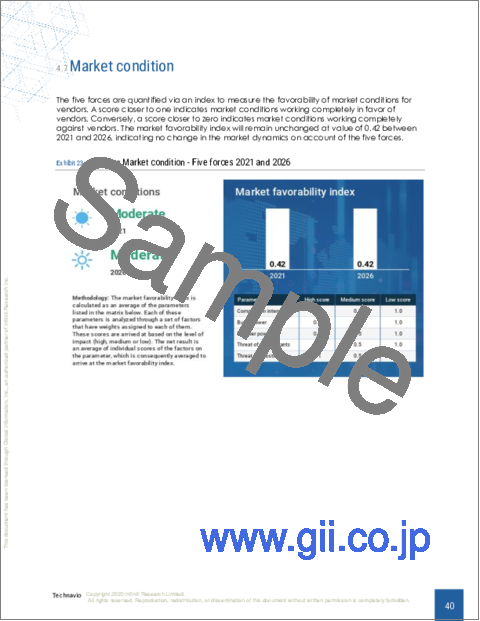
- 市況
第5章 市場セグメンテーション:エンドユーザー別
- 市場セグメント
- エンドユーザー別の比較
- プロ:市場規模と予測(2021年~2026年)
- アマチュア:市場規模と予測(2021年~2026年)
- エンドユーザー別の市場機会
第6章 顧客情勢
- 顧客情勢の概要
第7章 地域別情勢
- 地域別セグメンテーション
- 地域別の比較
- 北米:市場規模と予測(2021年~2026年)
- APAC:市場規模と予測(2021年~2026年)
- 欧州:市場規模と予測(2021年~2026年)
- 南米:市場規模と予測(2021年~2026年)
- 中東およびアフリカ:市場規模と予測(2021年~2026年)
- 米国:市場規模と予測(2021年~2026年)
- 日本:市場規模と予測(2021年~2026年)
- 中国:市場規模と予測(2021年~2026年)
- ドイツ:市場規模と予測(2021年~2026年)
- フランス:市場規模と予測(2021年~2026年)
- 地域情勢別の市場機会
第8章 推進要因、課題、および動向
- 市場推進要因
- 市場の課題
- 推進要因と課題の影響
- 市場動向
第9章 ベンダー情勢
- 概要
- ベンダー情勢
- 混乱の状況
- 業界のリスク
第10章 ベンダー分析
- 対象ベンダー
- ベンダーの市場ポジショニング
- BELLAFINA
- Christina Violin
- Crystalcello Musical Instruments
- D Z Strad
- Eastman Music Co.
- Jay Haide
- Karl Hofner GmbH and Co. KG
- NS Design
- Thrasio LLC
- Yamaha Corp.
第11章 付録
Exhibits:
- Exhibits1: Executive Summary - Chart on Market Overview
- Exhibits2: Executive Summary - Data Table on Market Overview
- Exhibits3: Executive Summary - Chart on Global Market Characteristics
- Exhibits4: Executive Summary - Chart on Market By Geographical Landscape
- Exhibits5: Executive Summary - Chart on Market Segmentation by End-user
- Exhibits6: Executive Summary - Chart on Incremental Growth
- Exhibits7: Executive Summary - Data Table on Incremental Growth
- Exhibits8: Executive Summary - Chart on Vendor Market Positioning
- Exhibits9: Parent market
- Exhibits10: Market Characteristics
- Exhibits11: Offerings of vendors included in the market definition
- Exhibits12: Market segments
- Exhibits13: Chart on Global - Market size and forecast 2021-2026 ($ million)
- Exhibits14: Data Table on Global - Market size and forecast 2021-2026 ($ million)
- Exhibits15: Chart on Global Market: Year-over-year growth 2021-2026 (%)
- Exhibits16: Data Table on Global Market: Year-over-year growth 2021-2026 (%)
- Exhibits17: Five forces analysis - Comparison between 2021 and 2026
- Exhibits18: Chart on Bargaining power of buyers - Impact of key factors 2021 and 2026
- Exhibits19: Bargaining power of suppliers - Impact of key factors in 2021 and 2026
- Exhibits20: Threat of new entrants - Impact of key factors in 2021 and 2026
- Exhibits21: Threat of substitutes - Impact of key factors in 2021 and 2026
- Exhibits22: Threat of rivalry - Impact of key factors in 2021 and 2026
- Exhibits23: Chart on Market condition - Five forces 2021 and 2026
- Exhibits24: Chart on End-user - Market share 2021-2026 (%)
- Exhibits25: Data Table on End-user - Market share 2021-2026 (%)
- Exhibits26: Chart on Comparison by End-user
- Exhibits27: Data Table on Comparison by End-user
- Exhibits28: Chart on Professional - Market size and forecast 2021-2026 ($ million)
- Exhibits29: Data Table on Professional - Market size and forecast 2021-2026 ($ million)
- Exhibits30: Chart on Professional - Year-over-year growth 2021-2026 (%)
- Exhibits31: Data Table on Professional - Year-over-year growth 2021-2026 (%)
- Exhibits32: Chart on Amateur - Market size and forecast 2021-2026 ($ million)
- Exhibits33: Data Table on Amateur - Market size and forecast 2021-2026 ($ million)
- Exhibits34: Chart on Amateur - Year-over-year growth 2021-2026 (%)
- Exhibits35: Data Table on Amateur - Year-over-year growth 2021-2026 (%)
- Exhibits36: Market opportunity by End-user ($ million)
- Exhibits37: Analysis of price sensitivity, lifecycle, customer purchase basket, adoption rates, and purchase criteria
- Exhibits38: Chart on Market share By Geographical Landscape 2021-2026 (%)
- Exhibits39: Data Table on Market share By Geographical Landscape 2021-2026 (%)
- Exhibits40: Chart on Geographic comparison
- Exhibits41: Data Table on Geographic comparison
- Exhibits42: Chart on North America - Market size and forecast 2021-2026 ($ million)
- Exhibits43: Data Table on North America - Market size and forecast 2021-2026 ($ million)
- Exhibits44: Chart on North America - Year-over-year growth 2021-2026 (%)
- Exhibits45: Data Table on North America - Year-over-year growth 2021-2026 (%)
- Exhibits46: Chart on APAC - Market size and forecast 2021-2026 ($ million)
- Exhibits47: Data Table on APAC - Market size and forecast 2021-2026 ($ million)
- Exhibits48: Chart on APAC - Year-over-year growth 2021-2026 (%)
- Exhibits49: Data Table on APAC - Year-over-year growth 2021-2026 (%)
- Exhibits50: Chart on Europe - Market size and forecast 2021-2026 ($ million)
- Exhibits51: Data Table on Europe - Market size and forecast 2021-2026 ($ million)
- Exhibits52: Chart on Europe - Year-over-year growth 2021-2026 (%)
- Exhibits53: Data Table on Europe - Year-over-year growth 2021-2026 (%)
- Exhibits54: Chart on South America - Market size and forecast 2021-2026 ($ million)
- Exhibits55: Data Table on South America - Market size and forecast 2021-2026 ($ million)
- Exhibits56: Chart on South America - Year-over-year growth 2021-2026 (%)
- Exhibits57: Data Table on South America - Year-over-year growth 2021-2026 (%)
- Exhibits58: Chart on Middle East and Africa - Market size and forecast 2021-2026 ($ million)
- Exhibits59: Data Table on Middle East and Africa - Market size and forecast 2021-2026 ($ million)
- Exhibits60: Chart on Middle East and Africa - Year-over-year growth 2021-2026 (%)
- Exhibits61: Data Table on Middle East and Africa - Year-over-year growth 2021-2026 (%)
- Exhibits62: Chart on US - Market size and forecast 2021-2026 ($ million)
- Exhibits63: Data Table on US - Market size and forecast 2021-2026 ($ million)
- Exhibits64: Chart on US - Year-over-year growth 2021-2026 (%)
- Exhibits65: Data Table on US - Year-over-year growth 2021-2026 (%)
- Exhibits66: Chart on Japan - Market size and forecast 2021-2026 ($ million)
- Exhibits67: Data Table on Japan - Market size and forecast 2021-2026 ($ million)
- Exhibits68: Chart on Japan - Year-over-year growth 2021-2026 (%)
- Exhibits69: Data Table on Japan - Year-over-year growth 2021-2026 (%)
- Exhibits70: Chart on China - Market size and forecast 2021-2026 ($ million)
- Exhibits71: Data Table on China - Market size and forecast 2021-2026 ($ million)
- Exhibits72: Chart on China - Year-over-year growth 2021-2026 (%)
- Exhibits73: Data Table on China - Year-over-year growth 2021-2026 (%)
- Exhibits74: Chart on Germany - Market size and forecast 2021-2026 ($ million)
- Exhibits75: Data Table on Germany - Market size and forecast 2021-2026 ($ million)
- Exhibits76: Chart on Germany - Year-over-year growth 2021-2026 (%)
- Exhibits77: Data Table on Germany - Year-over-year growth 2021-2026 (%)
- Exhibits78: Chart on France - Market size and forecast 2021-2026 ($ million)
- Exhibits79: Data Table on France - Market size and forecast 2021-2026 ($ million)
- Exhibits80: Chart on France - Year-over-year growth 2021-2026 (%)
- Exhibits81: Data Table on France - Year-over-year growth 2021-2026 (%)
- Exhibits82: Market opportunity By Geographical Landscape ($ million)
- Exhibits83: Impact of drivers and challenges in 2021 and 2026
- Exhibits84: Overview on Criticality of inputs and Factors of differentiation
- Exhibits85: Overview on factors of disruption
- Exhibits86: Impact of key risks on business
- Exhibits87: Vendors covered
- Exhibits88: Matrix on vendor position and classification
- Exhibits89: BELLAFINA - Overview
- Exhibits90: BELLAFINA - Product / Service
- Exhibits91: BELLAFINA - Key offerings
- Exhibits92: Christina Violin - Overview
- Exhibits93: Christina Violin - Product / Service
- Exhibits94: Christina Violin - Key offerings
- Exhibits95: Crystalcello Musical Instruments - Overview
- Exhibits96: Crystalcello Musical Instruments - Product / Service
- Exhibits97: Crystalcello Musical Instruments - Key offerings
- Exhibits98: D Z Strad - Overview
- Exhibits99: D Z Strad - Product / Service
- Exhibits100: D Z Strad - Key offerings
- Exhibits101: Eastman Music Co. - Overview
- Exhibits102: Eastman Music Co. - Product / Service
- Exhibits103: Eastman Music Co. - Key offerings
- Exhibits104: Jay Haide - Overview
- Exhibits105: Jay Haide - Product / Service
- Exhibits106: Jay Haide - Key offerings
- Exhibits107: Karl Hofner GmbH and Co. KG - Overview
- Exhibits108: Karl Hofner GmbH and Co. KG - Product / Service
- Exhibits109: Karl Hofner GmbH and Co. KG - Key offerings
- Exhibits110: NS Design - Overview
- Exhibits111: NS Design - Product / Service
- Exhibits112: NS Design - Key offerings
- Exhibits113: Thrasio LLC - Overview
- Exhibits114: Thrasio LLC - Key offerings
- Exhibits115: Yamaha Corp. - Overview
- Exhibits116: Yamaha Corp. - Business segments
- Exhibits117: Yamaha Corp. - Key news
- Exhibits118: Yamaha Corp. - Key offerings
- Exhibits119: Yamaha Corp. - Segment focus
- Exhibits120: Inclusions checklist
- Exhibits121: Exclusions checklist
- Exhibits122: Currency conversion rates for US$
- Exhibits123: Research methodology
- Exhibits124: Validation techniques employed for market sizing
- Exhibits125: Information sources
- Exhibits126: List of abbreviations
Technavio has been monitoring the viola market and is poised to grow by $ 5.77 mn during 2022-2026, accelerating at a CAGR of 2.13% during the forecast period. Our report on the viola market provides a holistic analysis, market size and forecast, trends, growth drivers, and challenges, as well as vendor analysis covering around 25 vendors.
The report offers an up-to-date analysis of the current global market scenario, the latest trends and drivers, and the overall market environment. The market is driven by the availability of web-based learning material, educational advancements, and rising interest in music-related leisure activities.
The viola market analysis includes the end-user segment and geographic landscape.
Technavio's viola market is segmented as below:
By End-user
- Professional
- Amateur
By Geographical Landscape
- North America
- APAC
- Europe
- South America
- Middle East and Africa
This study identifies the rising preference for pre-owned violas among musicians as one of the prime reasons driving the viola market growth during the next few years. Also, the growing popularity of online retail and increased popularity of live events will lead to sizable demand in the market.
- Viola market sizing
- Viola market forecast
- Viola market industry analysis
Technavio's robust vendor analysis is designed to help clients improve their market position, and in line with this, this report provides a detailed analysis of several leading viola market vendors that include BELLAFINA, Christina Violin, Crystalcello Musical Instruments, D Z Strad, David Milward Violas, Eastman Music Co., EMD Music, GLIGA Violins USA Inc., Jay Haide, Karl Hofner GmbH and Co. KG, Knilling Violins, Maple Leaf Strings, NS Design, Palatino USA, Stentor Music Co. Ltd., Stringworks Inc., Thrasio LLC, and Yamaha Corp. Also, the viola market analysis report includes information on upcoming trends and challenges that will influence market growth. This is to help companies strategize and leverage all future growth opportunities.
The study was conducted using an objective combination of primary and secondary information including inputs from key participants in the industry. The report contains a comprehensive market and vendor landscape in addition to an analysis of the key vendors.
Table of Contents
1 Executive Summary
- 1.1 Market overview
- Exhibit 01: Executive Summary - Chart on Market Overview
- Exhibit 02: Executive Summary - Data Table on Market Overview
- Exhibit 03: Executive Summary - Chart on Global Market Characteristics
- Exhibit 04: Executive Summary - Chart on Market By Geographical Landscape
- Exhibit 05: Executive Summary - Chart on Market Segmentation by End-user
- Exhibit 06: Executive Summary - Chart on Incremental Growth
- Exhibit 07: Executive Summary - Data Table on Incremental Growth
- Exhibit 08: Executive Summary - Chart on Vendor Market Positioning
2 Market Landscape
- 2.1 Market ecosystem
- Exhibit 09: Parent market
- Exhibit 10: Market Characteristics
3 Market Sizing
- 3.1 Market definition
- Exhibit 11: Offerings of vendors included in the market definition
- 3.2 Market segment analysis
- Exhibit 12: Market segments
- 3.3 Market size 2021
- 3.4 Market outlook: Forecast for 2021-2026
- Exhibit 13: Chart on Global - Market size and forecast 2021-2026 ($ million)
- Exhibit 14: Data Table on Global - Market size and forecast 2021-2026 ($ million)
- Exhibit 15: Chart on Global Market: Year-over-year growth 2021-2026 (%)
- Exhibit 16: Data Table on Global Market: Year-over-year growth 2021-2026 (%)
4 Five Forces Analysis
- 4.1 Five forces summary
- Exhibit 17: Five forces analysis - Comparison between 2021 and 2026
- 4.2 Bargaining power of buyers
- Exhibit 18: Chart on Bargaining power of buyers - Impact of key factors 2021 and 2026
- 4.3 Bargaining power of suppliers
- Exhibit 19: Bargaining power of suppliers - Impact of key factors in 2021 and 2026
- 4.4 Threat of new entrants
- Exhibit 20: Threat of new entrants - Impact of key factors in 2021 and 2026
- 4.5 Threat of substitutes
- Exhibit 21: Threat of substitutes - Impact of key factors in 2021 and 2026
- 4.6 Threat of rivalry
- Exhibit 22: Threat of rivalry - Impact of key factors in 2021 and 2026
- 4.7 Market condition
- Exhibit 23: Chart on Market condition - Five forces 2021 and 2026
5 Market Segmentation by End-user
- 5.1 Market segments
- Exhibit 24: Chart on End-user - Market share 2021-2026 (%)
- Exhibit 25: Data Table on End-user - Market share 2021-2026 (%)
- 5.2 Comparison by End-user
- Exhibit 26: Chart on Comparison by End-user
- Exhibit 27: Data Table on Comparison by End-user
- 5.3 Professional - Market size and forecast 2021-2026
- Exhibit 28: Chart on Professional - Market size and forecast 2021-2026 ($ million)
- Exhibit 29: Data Table on Professional - Market size and forecast 2021-2026 ($ million)
- Exhibit 30: Chart on Professional - Year-over-year growth 2021-2026 (%)
- Exhibit 31: Data Table on Professional - Year-over-year growth 2021-2026 (%)
- 5.4 Amateur - Market size and forecast 2021-2026
- Exhibit 32: Chart on Amateur - Market size and forecast 2021-2026 ($ million)
- Exhibit 33: Data Table on Amateur - Market size and forecast 2021-2026 ($ million)
- Exhibit 34: Chart on Amateur - Year-over-year growth 2021-2026 (%)
- Exhibit 35: Data Table on Amateur - Year-over-year growth 2021-2026 (%)
- 5.5 Market opportunity by End-user
- Exhibit 36: Market opportunity by End-user ($ million)
6 Customer Landscape
- 6.1 Customer landscape overview
- Exhibit 37: Analysis of price sensitivity, lifecycle, customer purchase basket, adoption rates, and purchase criteria
7 Geographic Landscape
- 7.1 Geographic segmentation
- Exhibit 38: Chart on Market share By Geographical Landscape 2021-2026 (%)
- Exhibit 39: Data Table on Market share By Geographical Landscape 2021-2026 (%)
- 7.2 Geographic comparison
- Exhibit 40: Chart on Geographic comparison
- Exhibit 41: Data Table on Geographic comparison
- 7.3 North America - Market size and forecast 2021-2026
- Exhibit 42: Chart on North America - Market size and forecast 2021-2026 ($ million)
- Exhibit 43: Data Table on North America - Market size and forecast 2021-2026 ($ million)
- Exhibit 44: Chart on North America - Year-over-year growth 2021-2026 (%)
- Exhibit 45: Data Table on North America - Year-over-year growth 2021-2026 (%)
- 7.4 APAC - Market size and forecast 2021-2026
- Exhibit 46: Chart on APAC - Market size and forecast 2021-2026 ($ million)
- Exhibit 47: Data Table on APAC - Market size and forecast 2021-2026 ($ million)
- Exhibit 48: Chart on APAC - Year-over-year growth 2021-2026 (%)
- Exhibit 49: Data Table on APAC - Year-over-year growth 2021-2026 (%)
- 7.5 Europe - Market size and forecast 2021-2026
- Exhibit 50: Chart on Europe - Market size and forecast 2021-2026 ($ million)
- Exhibit 51: Data Table on Europe - Market size and forecast 2021-2026 ($ million)
- Exhibit 52: Chart on Europe - Year-over-year growth 2021-2026 (%)
- Exhibit 53: Data Table on Europe - Year-over-year growth 2021-2026 (%)
- 7.6 South America - Market size and forecast 2021-2026
- Exhibit 54: Chart on South America - Market size and forecast 2021-2026 ($ million)
- Exhibit 55: Data Table on South America - Market size and forecast 2021-2026 ($ million)
- Exhibit 56: Chart on South America - Year-over-year growth 2021-2026 (%)
- Exhibit 57: Data Table on South America - Year-over-year growth 2021-2026 (%)
- 7.7 Middle East and Africa - Market size and forecast 2021-2026
- Exhibit 58: Chart on Middle East and Africa - Market size and forecast 2021-2026 ($ million)
- Exhibit 59: Data Table on Middle East and Africa - Market size and forecast 2021-2026 ($ million)
- Exhibit 60: Chart on Middle East and Africa - Year-over-year growth 2021-2026 (%)
- Exhibit 61: Data Table on Middle East and Africa - Year-over-year growth 2021-2026 (%)
- 7.8 US - Market size and forecast 2021-2026
- Exhibit 62: Chart on US - Market size and forecast 2021-2026 ($ million)
- Exhibit 63: Data Table on US - Market size and forecast 2021-2026 ($ million)
- Exhibit 64: Chart on US - Year-over-year growth 2021-2026 (%)
- Exhibit 65: Data Table on US - Year-over-year growth 2021-2026 (%)
- 7.9 Japan - Market size and forecast 2021-2026
- Exhibit 66: Chart on Japan - Market size and forecast 2021-2026 ($ million)
- Exhibit 67: Data Table on Japan - Market size and forecast 2021-2026 ($ million)
- Exhibit 68: Chart on Japan - Year-over-year growth 2021-2026 (%)
- Exhibit 69: Data Table on Japan - Year-over-year growth 2021-2026 (%)
- 7.10 China - Market size and forecast 2021-2026
- Exhibit 70: Chart on China - Market size and forecast 2021-2026 ($ million)
- Exhibit 71: Data Table on China - Market size and forecast 2021-2026 ($ million)
- Exhibit 72: Chart on China - Year-over-year growth 2021-2026 (%)
- Exhibit 73: Data Table on China - Year-over-year growth 2021-2026 (%)
- 7.11 Germany - Market size and forecast 2021-2026
- Exhibit 74: Chart on Germany - Market size and forecast 2021-2026 ($ million)
- Exhibit 75: Data Table on Germany - Market size and forecast 2021-2026 ($ million)
- Exhibit 76: Chart on Germany - Year-over-year growth 2021-2026 (%)
- Exhibit 77: Data Table on Germany - Year-over-year growth 2021-2026 (%)
- 7.12 France - Market size and forecast 2021-2026
- Exhibit 78: Chart on France - Market size and forecast 2021-2026 ($ million)
- Exhibit 79: Data Table on France - Market size and forecast 2021-2026 ($ million)
- Exhibit 80: Chart on France - Year-over-year growth 2021-2026 (%)
- Exhibit 81: Data Table on France - Year-over-year growth 2021-2026 (%)
- 7.13 Market opportunity By Geographical Landscape
- Exhibit 82: Market opportunity By Geographical Landscape ($ million)
8 Drivers, Challenges, and Trends
- 8.1 Market drivers
- 8.2 Market challenges
- 8.3 Impact of drivers and challenges
- Exhibit 83: Impact of drivers and challenges in 2021 and 2026
- 8.4 Market trends
9 Vendor Landscape
- 9.1 Overview
- 9.2 Vendor landscape
- Exhibit 84: Overview on Criticality of inputs and Factors of differentiation
- 9.3 Landscape disruption
- Exhibit 85: Overview on factors of disruption
- 9.4 Industry risks
- Exhibit 86: Impact of key risks on business
10 Vendor Analysis
- 10.1 Vendors covered
- Exhibit 87: Vendors covered
- 10.2 Market positioning of vendors
- Exhibit 88: Matrix on vendor position and classification
- 10.3 BELLAFINA
- Exhibit 89: BELLAFINA - Overview
- Exhibit 90: BELLAFINA - Product / Service
- Exhibit 91: BELLAFINA - Key offerings
- 10.4 Christina Violin
- Exhibit 92: Christina Violin - Overview
- Exhibit 93: Christina Violin - Product / Service
- Exhibit 94: Christina Violin - Key offerings
- 10.5 Crystalcello Musical Instruments
- Exhibit 95: Crystalcello Musical Instruments - Overview
- Exhibit 96: Crystalcello Musical Instruments - Product / Service
- Exhibit 97: Crystalcello Musical Instruments - Key offerings
- 10.6 D Z Strad
- Exhibit 98: D Z Strad - Overview
- Exhibit 99: D Z Strad - Product / Service
- Exhibit 100: D Z Strad - Key offerings
- 10.7 Eastman Music Co.
- Exhibit 101: Eastman Music Co. - Overview
- Exhibit 102: Eastman Music Co. - Product / Service
- Exhibit 103: Eastman Music Co. - Key offerings
- 10.8 Jay Haide
- Exhibit 104: Jay Haide - Overview
- Exhibit 105: Jay Haide - Product / Service
- Exhibit 106: Jay Haide - Key offerings
- 10.9 Karl Hofner GmbH and Co. KG
- Exhibit 107: Karl Hofner GmbH and Co. KG - Overview
- Exhibit 108: Karl Hofner GmbH and Co. KG - Product / Service
- Exhibit 109: Karl Hofner GmbH and Co. KG - Key offerings
- 10.10 NS Design
- Exhibit 110: NS Design - Overview
- Exhibit 111: NS Design - Product / Service
- Exhibit 112: NS Design - Key offerings
- 10.11 Thrasio LLC
- Exhibit 113: Thrasio LLC - Overview
- Exhibit 114: Thrasio LLC - Key offerings
- 10.12 Yamaha Corp.
- Exhibit 115: Yamaha Corp. - Overview
- Exhibit 116: Yamaha Corp. - Business segments
- Exhibit 117: Yamaha Corp. - Key news
- Exhibit 118: Yamaha Corp. - Key offerings
- Exhibit 119: Yamaha Corp. - Segment focus
11 Appendix
- 11.1 Scope of the report
- 11.2 Inclusions and exclusions checklist
- Exhibit 120: Inclusions checklist
- Exhibit 121: Exclusions checklist
- 11.3 Currency conversion rates for US$
- Exhibit 122: Currency conversion rates for US$
- 11.4 Research methodology
- Exhibit 123: Research methodology
- Exhibit 124: Validation techniques employed for market sizing
- Exhibit 125: Information sources
- 11.5 List of abbreviations
- Exhibit 126: List of abbreviations