|
|
市場調査レポート
商品コード
1072781
ライナーハンガーシステムの世界市場(2022年~2026年)Global Liner Hanger Systems Market 2022-2026 |
||||||
|
|
|||||||
|
● お客様のご希望に応じて、既存データの加工や未掲載情報(例:国別セグメント)の追加などの対応が可能です。 詳細はお問い合わせください。 |
|||||||


| ライナーハンガーシステムの世界市場(2022年~2026年) |
|
出版日: 2022年04月28日
発行: TechNavio
ページ情報: 英文 120 Pages
納期: 即納可能
|
- 全表示
- 概要
- 図表
- 目次
世界のライナーハンガーシステムの市場規模は、2022年~2026年の間に6億4,335万米ドルの増加が見込まれ、予測期間中に3.72%のCAGRで成長すると予測されています。
市場を牽引しているのは、液体燃料消費の世界的な増加、石油・ガスのE&P活動の増加、上流投資の増加です。
当レポートでは、世界のライナーハンガーシステム市場について調査分析し、全体的な分析、市場規模と予測、動向、成長促進要因、課題のほか、約25社のベンダーを対象としたベンダー分析を提供しています。
目次
第1章 エグゼクティブサマリー
- 市場概要
第2章 市場情勢
- 市場のエコシステム
第3章 市場規模
- 市場の定義
- 市場セグメント分析
- 市場規模(2021年)
- 市場の見通し:2021年~2026年の予測
第4章 ファイブフォース分析
- ファイブフォースの概要
- 買い手の交渉力
- 供給企業の交渉力
- 新規参入業者の脅威
- 代替品の脅威
- ライバル関係の脅威
- 市況
第5章 市場セグメンテーション:用途別
- 市場セグメント
- 用途別の比較
- オンショア:市場規模と予測(2021年~2026年)
- オフショア:市場規模と予測(2021年~2026年)
- 用途別の市場機会
第6章 顧客情勢
- 顧客情勢の概要
第7章 市場セグメンテーション:地域情勢別
- 地域別の比較
- 北米:市場規模と予測(2021年~2026年)
- アジア太平洋:市場規模と予測(2021年~2026年)
- 中東・アフリカ:市場規模と予測(2021年~2026年)
- 欧州:市場規模と予測(2021年~2026年)
- 南米:市場規模と予測(2021年~2026年)
- 米国:市場規模と予測(2021年~2026年)
- 中国:市場規模と予測(2021年~2026年)
- カナダ:市場規模と予測(2021年~2026年)
- サウジアラビア:市場規模と予測(2021年~2026年)
- 地域情勢別の市場機会
第8章 促進要因・課題・動向
- 市場促進要因
- 市場の課題
- 促進要因と課題の影響
- 市場動向
第9章 ベンダー情勢
- 概要
- ベンダー情勢
- 混乱情勢
- 業界のリスク
第10章 ベンダー分析
- 対象ベンダー
- ベンダーの市場ポジショニング
- Allamon Tool Co Inc.
- Baker Hughes Co.
- DEW Wartungs und Reparatur GmbH
- Dril Quip Inc.
- Halliburton Co.
- Innovex
- NOV Inc.
- Packers Plus Energy Services Inc.
- Schlumberger Ltd.
Exhibits:
- Exhibits1: Executive Summary - Chart on Market Overview
- Exhibits2: Executive Summary - Data Table on Market Overview
- Exhibits3: Executive Summary - Chart on Global Market Characteristics
- Exhibits4: Executive Summary - Chart on Market By Geographical Landscape
- Exhibits5: Executive Summary - Chart on Market Segmentation by Application
- Exhibits6: Executive Summary - Chart on Incremental Growth
- Exhibits7: Executive Summary - Data Table on Incremental Growth
- Exhibits8: Executive Summary - Chart on Vendor Market Positioning
- Exhibits9: Parent market
- Exhibits10: Market Characteristics
- Exhibits11: Offerings of vendors included in the market definition
- Exhibits12: Market segments
- Exhibits13: Chart on Global - Market size and forecast 2021-2026 ($ million)
- Exhibits14: Data Table on Global - Market size and forecast 2021-2026 ($ million)
- Exhibits15: Chart on Global Market: Year-over-year growth 2021-2026 (%)
- Exhibits16: Data Table on Global Market: Year-over-year growth 2021-2026 (%)
- Exhibits17: Five forces analysis - Comparison between2021 and 2026
- Exhibits18: Chart on Bargaining power of buyers - Impact of key factors 2021 and 2026
- Exhibits19: Bargaining power of suppliers - Impact of key factors in 2021 and 2026
- Exhibits20: Threat of new entrants - Impact of key factors in 2021 and 2026
- Exhibits21: Threat of substitutes - Impact of key factors in 2021 and 2026
- Exhibits22: Threat of rivalry - Impact of key factors in 2021 and 2026
- Exhibits23: Chart on Market condition - Five forces 2021 and 2026
- Exhibits24: Chart on Application - Market share 2021-2026 (%)
- Exhibits25: Data Table on Application - Market share 2021-2026 (%)
- Exhibits26: Chart on Comparison by Application
- Exhibits27: Data Table on Comparison by Application
- Exhibits28: Chart on Onshore - Market size and forecast 2021-2026 ($ million)
- Exhibits29: Data Table on Onshore - Market size and forecast 2021-2026 ($ million)
- Exhibits30: Chart on Onshore - Year-over-year growth 2021-2026 (%)
- Exhibits31: Data Table on Onshore - Year-over-year growth 2021-2026 (%)
- Exhibits32: Chart on Offshore - Market size and forecast 2021-2026 ($ million)
- Exhibits33: Data Table on Offshore - Market size and forecast 2021-2026 ($ million)
- Exhibits34: Chart on Offshore - Year-over-year growth 2021-2026 (%)
- Exhibits35: Data Table on Offshore - Year-over-year growth 2021-2026 (%)
- Exhibits36: Market opportunity by Application ($ million)
- Exhibits37: Analysis of price sensitivity, lifecycle, customer purchase basket, adoption rates, and purchase criteria
- Exhibits38: Chart on Market share By Geographical Landscape 2021-2026 (%)
- Exhibits39: Data Table on Market share By Geographical Landscape 2021-2026 (%)
- Exhibits40: Chart on Geographic comparison
- Exhibits41: Data Table on Geographic comparison
- Exhibits42: Chart on North America - Market size and forecast 2021-2026 ($ million)
- Exhibits43: Data Table on North America - Market size and forecast 2021-2026 ($ million)
- Exhibits44: Chart on North America - Year-over-year growth 2021-2026 (%)
- Exhibits45: Data Table on North America - Year-over-year growth 2021-2026 (%)
- Exhibits46: Chart on APAC - Market size and forecast 2021-2026 ($ million)
- Exhibits47: Data Table on APAC - Market size and forecast 2021-2026 ($ million)
- Exhibits48: Chart on APAC - Year-over-year growth 2021-2026 (%)
- Exhibits49: Data Table on APAC - Year-over-year growth 2021-2026 (%)
- Exhibits50: Chart on Middle East and Africa - Market size and forecast 2021-2026 ($ million)
- Exhibits51: Data Table on Middle East and Africa - Market size and forecast 2021-2026 ($ million)
- Exhibits52: Chart on Middle East and Africa - Year-over-year growth 2021-2026 (%)
- Exhibits53: Data Table on Middle East and Africa - Year-over-year growth 2021-2026 (%)
- Exhibits54: Chart on Europe - Market size and forecast 2021-2026 ($ million)
- Exhibits55: Data Table on Europe - Market size and forecast 2021-2026 ($ million)
- Exhibits56: Chart on Europe - Year-over-year growth 2021-2026 (%)
- Exhibits57: Data Table on Europe - Year-over-year growth 2021-2026 (%)
- Exhibits58: Chart on South America - Market size and forecast 2021-2026 ($ million)
- Exhibits59: Data Table on South America - Market size and forecast 2021-2026 ($ million)
- Exhibits60: Chart on South America - Year-over-year growth 2021-2026 (%)
- Exhibits61: Data Table on South America - Year-over-year growth 2021-2026 (%)
- Exhibits62: Chart on US - Market size and forecast 2021-2026 ($ million)
- Exhibits63: Data Table on US - Market size and forecast 2021-2026 ($ million)
- Exhibits64: Chart on US - Year-over-year growth 2021-2026 (%)
- Exhibits65: Data Table on US - Year-over-year growth 2021-2026 (%)
- Exhibits66: Chart on China - Market size and forecast 2021-2026 ($ million)
- Exhibits67: Data Table on China - Market size and forecast 2021-2026 ($ million)
- Exhibits68: Chart on China - Year-over-year growth 2021-2026 (%)
- Exhibits69: Data Table on China - Year-over-year growth 2021-2026 (%)
- Exhibits70: Chart on Canada - Market size and forecast 2021-2026 ($ million)
- Exhibits71: Data Table on Canada - Market size and forecast 2021-2026 ($ million)
- Exhibits72: Chart on Canada - Year-over-year growth 2021-2026 (%)
- Exhibits73: Data Table on Canada - Year-over-year growth 2021-2026 (%)
- Exhibits74: Chart on Saudi Arabia - Market size and forecast 2021-2026 ($ million)
- Exhibits75: Data Table on Saudi Arabia - Market size and forecast 2021-2026 ($ million)
- Exhibits76: Chart on Saudi Arabia - Year-over-year growth 2021-2026 (%)
- Exhibits77: Data Table on Saudi Arabia - Year-over-year growth 2021-2026 (%)
- Exhibits78: Market opportunity By Geographical Landscape ($ million)
- Exhibits79: Impact of drivers and challenges in 2021 and 2026
- Exhibits80: Overview on Criticality of inputs and Factors of differentiation
- Exhibits81: Overview on factors of disruption
- Exhibits82: Impact of key risks on business
- Exhibits83: Vendors covered
- Exhibits84: Matrix on vendor position and classification
- Exhibits85: Allamon Tool Co Inc. - Overview
- Exhibits86: Allamon Tool Co Inc. - Product / Service
- Exhibits87: Allamon Tool Co Inc. - Key offerings
- Exhibits88: Baker Hughes Co. - Overview
- Exhibits89: Baker Hughes Co. - Business segments
- Exhibits90: Baker Hughes Co. - Key news
- Exhibits91: Baker Hughes Co. - Key offerings
- Exhibits92: Baker Hughes Co. - Segment focus
- Exhibits93: DEW Wartungs und Reparatur GmbH - Overview
- Exhibits94: DEW Wartungs und Reparatur GmbH - Product / Service
- Exhibits95: DEW Wartungs und Reparatur GmbH - Key offerings
- Exhibits96: Dril Quip Inc. - Overview
- Exhibits97: Dril Quip Inc. - Business segments
- Exhibits98: Dril Quip Inc. - Key offerings
- Exhibits99: Dril Quip Inc. - Segment focus
- Exhibits100: Halliburton Co. - Overview
- Exhibits101: Halliburton Co. - Product / Service
- Exhibits102: Halliburton Co. - Key news
- Exhibits103: Halliburton Co. - Key offerings
- Exhibits104: Innovex - Overview
- Exhibits105: Innovex - Product / Service
- Exhibits106: Innovex - Key offerings
- Exhibits107: NOV Inc. - Overview
- Exhibits108: NOV Inc. - Business segments
- Exhibits109: NOV Inc. - Key news
- Exhibits110: NOV Inc. - Key offerings
- Exhibits111: NOV Inc. - Segment focus
- Exhibits112: Packers Plus Energy Services Inc. - Overview
- Exhibits113: Packers Plus Energy Services Inc. - Product / Service
- Exhibits114: Packers Plus Energy Services Inc. - Key offerings
- Exhibits115: Schlumberger Ltd. - Overview
- Exhibits116: Schlumberger Ltd. - Business segments
- Exhibits117: Schlumberger Ltd. - Key offerings
- Exhibits118: Schlumberger Ltd. - Segment focus
- Exhibits119: Weatherford International Plc - Overview
- Exhibits120: Weatherford International Plc - Business segments
- Exhibits121: Weatherford International Plc - Key offerings
- Exhibits122: Weatherford International Plc - Segment focus
- Exhibits123: Inclusions checklist
- Exhibits124: Exclusions checklist
- Exhibits125: Currency conversion rates for US$
- Exhibits126: Research methodology
- Exhibits127: Validation techniques employed for market sizing
- Exhibits128: Information sources
- Exhibits129: List of abbreviations
Technavio has been monitoring the liner hanger systems market and it is poised to grow by $ 643.35 mn during 2022-2026, accelerating at a CAGR of 3.72% during the forecast period. Our report on the liner hanger systems market provides a holistic analysis, market size and forecast, trends, growth drivers, and challenges, as well as vendor analysis covering around 25 vendors.
The report offers an up-to-date analysis of the current global market scenario, the latest trends and drivers, and the overall market environment. The market is driven by global growth in liquid fuel consumption, an increase in oil and gas E and P activities, and increasing upstream investment.
The liner hanger systems market analysis includes application segment and geographic landscape.
Technavio's liner hanger systems market is segmented as below:
By Application
- Onshore
- Offshore
By Geographical Landscape
- North America
- APAC
- The Middle East and Africa
- Europe
- South America
This study identifies the increase in deepwater and ultra-deepwater exploration as one of the prime reasons driving the liner hanger systems market growth during the next few years. Also, innovations in liner hanger technology and a rise in world refining capacity will lead to sizable demand in the market.
Technavio presents a detailed picture of the market by the way of study, synthesis, and summation of data from multiple sources by an analysis of key parameters. Our report on the liner hanger systems market covers the following areas:
- Liner hanger systems market sizing
- Liner hanger systems market forecast
- Liner hanger systems market industry analysis
Technavio's robust vendor analysis is designed to help clients improve their market position, and in line with this, this report provides a detailed analysis of several leading liner hanger systems market vendors that include Allamon Tool Co Inc., Baker Hughes Co., BOTIL Oil Tools India Pvt. Ltd., DEW Wartungs und Reparatur GmbH, Dril Quip Inc., Halliburton Co., Innovex, Maximus Completion Systems, NCS Multistage Holdings Inc., NOV Inc., Packers Plus Energy Services Inc., Peak Completion Technologies Inc., Saga-PCE Pte. Ltd., SAZ Oilfield Services Pte. Ltd., Schlumberger Ltd., TANGENTOG EQUIPMENT AND SUPPLY PVT. Ltd., Tianjin Elegant Technology Co. Ltd., Weatherford International Plc, Well Innovation AS, and Wellcare Oil Tools Pvt. Ltd. Also, the liner hanger systems market analysis report includes information on upcoming trends and challenges that will influence market growth. This is to help companies strategize and leverage all forthcoming growth opportunities.
The study was conducted using an objective combination of primary and secondary information including inputs from key participants in the industry. The report contains a comprehensive market and vendor landscape in addition to an analysis of the key vendors.
Technavio presents a detailed picture of the market by the way of study, synthesis, and summation of data from multiple sources by an analysis of key parameters such as profit, pricing, competition, and promotions. It presents various market facets by identifying the key industry influencers. The data presented is comprehensive, reliable, and a result of extensive research - both primary and secondary. Technavio's market research reports provide a complete competitive landscape and an in-depth vendor selection methodology and analysis using qualitative and quantitative research to forecast accurate market growth.
Table of Contents
1. Executive Summary
- 1.1 Market overview
- Exhibit 01: Executive Summary - Chart on Market Overview
- Exhibit 02: Executive Summary - Data Table on Market Overview
- Exhibit 03: Executive Summary - Chart on Global Market Characteristics
- Exhibit 04: Executive Summary - Chart on Market By Geographical Landscape
- Exhibit 05: Executive Summary - Chart on Market Segmentation by End-user
- Exhibit 06: Executive Summary - Chart on Incremental Growth
- Exhibit 07: Executive Summary - Data Table on Incremental Growth
- Exhibit 08: Executive Summary - Chart on Vendor Market Positioning
2. Market Landscape
- 2.1 Market ecosystem
- Exhibit 09: Parent market
- Exhibit 10: Market Characteristics
3. Market Sizing
- 3.1 Market definition
- Exhibit 11: Offerings of vendors included in the market definition
- 3.2 Market segment analysis
- Exhibit 12: Market segments
- 3.3 Market size 2021
- 3.4 Market outlook: Forecast for 2021-2026
- Exhibit 13: Chart on Global - Market size and forecast 2021-2026 ($ million)
- Exhibit 14: Data Table on Global - Market size and forecast 2021-2026 ($ million)
- Exhibit 15: Chart on Global Market: Year-over-year growth 2021-2026 (%)
- Exhibit 16: Data Table on Global Market: Year-over-year growth 2021-2026 (%)
4. Five Forces Analysis
- 4.1 Five Forces Summary
- Exhibit 17: Five forces analysis - Comparison between2021 and 2026
- 4.2 Bargaining power of buyers
- Exhibit 18: Chart on Bargaining power of buyers - Impact of key factors 2021 and 2026
- 4.3 Bargaining power of suppliers
- Exhibit 19: Bargaining power of suppliers - Impact of key factors in 2021 and 2026
- 4.4 Threat of new entrants
- Exhibit 20: Threat of new entrants - Impact of key factors in 2021 and 2026
- 4.5 Threat of substitutes
- Exhibit 21: Threat of substitutes - Impact of key factors in 2021 and 2026
- 4.6 Threat of rivalry
- Exhibit 22: Threat of rivalry - Impact of key factors in 2021 and 2026
- 4.7 Market condition
- Exhibit 23: Chart on Market condition - Five forces 2021 and 2026
5 Market Segmentation by Application
- 5.1 Market segments
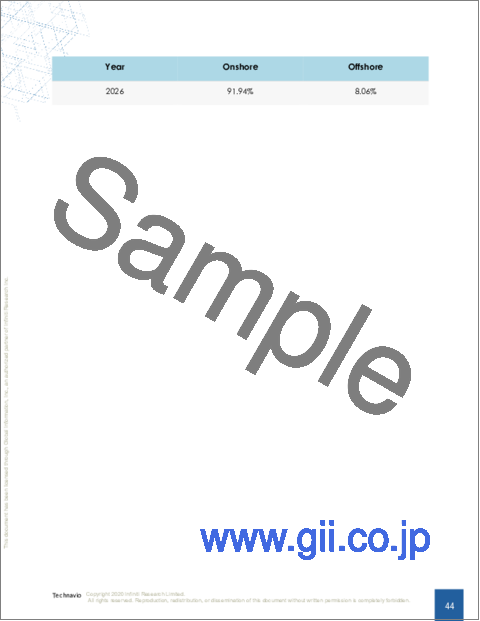
- Exhibit 24: Chart on Application - Market share 2021-2026 (%)
- Exhibit 25: Data Table on Application - Market share 2021-2026 (%)
- 5.2 Comparison by Application
- Exhibit 26: Chart on Comparison by Application
- Exhibit 27: Data Table on Comparison by Application
- 5.3 Onshore - Market size and forecast 2021-2026
- Exhibit 28: Chart on Onshore - Market size and forecast 2021-2026 ($ million)
- Exhibit 29: Data Table on Onshore - Market size and forecast 2021-2026 ($ million)
- Exhibit 30: Chart on Onshore - Year-over-year growth 2021-2026 (%)
- Exhibit 31: Data Table on Onshore - Year-over-year growth 2021-2026 (%)
- 5.4 Offshore - Market size and forecast 2021-2026
- Exhibit 32: Chart on Offshore - Market size and forecast 2021-2026 ($ million)
- Exhibit 33: Data Table on Offshore - Market size and forecast 2021-2026 ($ million)
- Exhibit 34: Chart on Offshore - Year-over-year growth 2021-2026 (%)
- Exhibit 35: Data Table on Offshore - Year-over-year growth 2021-2026 (%)
- 5.5 Market opportunity by Application
- Exhibit 36: Market opportunity by Application ($ million)
6. Customer landscape
- Technavio's customer landscape matrix comparing Drivers or price sensitivity, Adoption lifecycle, importance in customer price basket, Adoption rate and Key purchase criteria
- 6.1 Customer landscape overview
- Exhibit 37: Analysis of price sensitivity, lifecycle, customer purchase basket, adoption rates, and purchase criteria
5 Market Segmentation By Geographical Landscape
- Exhibit 38: Chart on Market share By Geographical Landscape 2021-2026 (%)
- Exhibit 39: Data Table on Market share By Geographical Landscape 2021-2026 (%)
- 7.2 Geographic comparison
- Exhibit 40: Chart on Geographic comparison
- Exhibit 41: Data Table on Geographic comparison
- 7.3 North America - Market size and forecast 2021-2026
- Exhibit 42: Chart on North America - Market size and forecast 2021-2026 ($ million)
- Exhibit 43: Data Table on North America - Market size and forecast 2021-2026 ($ million)
- Exhibit 44: Chart on North America - Year-over-year growth 2021-2026 (%)
- Exhibit 45: Data Table on North America - Year-over-year growth 2021-2026 (%)
- 7.4 APAC - Market size and forecast 2021-2026
- Exhibit 46: Chart on APAC - Market size and forecast 2021-2026 ($ million)
- Exhibit 47: Data Table on APAC - Market size and forecast 2021-2026 ($ million)
- Exhibit 48: Chart on APAC - Year-over-year growth 2021-2026 (%)
- Exhibit 49: Data Table on APAC - Year-over-year growth 2021-2026 (%)
- 7.5 Middle East and Africa - Market size and forecast 2021-2026
- Exhibit 50: Chart on Middle East and Africa - Market size and forecast 2021-2026 ($ million)
- Exhibit 51: Data Table on Middle East and Africa - Market size and forecast 2021-2026 ($ million)
- Exhibit 52: Chart on Middle East and Africa - Year-over-year growth 2021-2026 (%)
- Exhibit 53: Data Table on Middle East and Africa - Year-over-year growth 2021-2026 (%)
- 7.6 Europe - Market size and forecast 2021-2026
- Exhibit 54: Chart on Europe - Market size and forecast 2021-2026 ($ million)
- Exhibit 55: Data Table on Europe - Market size and forecast 2021-2026 ($ million)
- Exhibit 56: Chart on Europe - Year-over-year growth 2021-2026 (%)
- Exhibit 57: Data Table on Europe - Year-over-year growth 2021-2026 (%)
- 7.7 South America - Market size and forecast 2021-2026
- Exhibit 58: Chart on South America - Market size and forecast 2021-2026 ($ million)
- Exhibit 59: Data Table on South America - Market size and forecast 2021-2026 ($ million)
- Exhibit 60: Chart on South America - Year-over-year growth 2021-2026 (%)
- Exhibit 61: Data Table on South America - Year-over-year growth 2021-2026 (%)
- 7.8 US - Market size and forecast 2021-2026
- Exhibit 62: Chart on US - Market size and forecast 2021-2026 ($ million)
- Exhibit 63: Data Table on US - Market size and forecast 2021-2026 ($ million)
- Exhibit 64: Chart on US - Year-over-year growth 2021-2026 (%)
- Exhibit 65: Data Table on US - Year-over-year growth 2021-2026 (%)
- 7.9 China - Market size and forecast 2021-2026
- Exhibit 66: Chart on China - Market size and forecast 2021-2026 ($ million)
- Exhibit 67: Data Table on China - Market size and forecast 2021-2026 ($ million)
- Exhibit 68: Chart on China - Year-over-year growth 2021-2026 (%)
- Exhibit 69: Data Table on China - Year-over-year growth 2021-2026 (%)
- 7.10 Canada - Market size and forecast 2021-2026
- Exhibit 70: Chart on Canada - Market size and forecast 2021-2026 ($ million)
- Exhibit 71: Data Table on Canada - Market size and forecast 2021-2026 ($ million)
- Exhibit 72: Chart on Canada - Year-over-year growth 2021-2026 (%)
- Exhibit 73: Data Table on Canada - Year-over-year growth 2021-2026 (%)
- 7.11 Saudi Arabia - Market size and forecast 2021-2026
- Exhibit 74: Chart on Saudi Arabia - Market size and forecast 2021-2026 ($ million)
- Exhibit 75: Data Table on Saudi Arabia - Market size and forecast 2021-2026 ($ million)
- Exhibit 76: Chart on Saudi Arabia - Year-over-year growth 2021-2026 (%)
- Exhibit 77: Data Table on Saudi Arabia - Year-over-year growth 2021-2026 (%)
- 7.12 Market opportunity By Geographical Landscape
- Exhibit 78: Market opportunity By Geographical Landscape ($ million)
8. Drivers, Challenges, and Trends
- 8.1 Market drivers
- 8.1.1 Global growth in liquid fuel consumption
- 8.1.2 Increase in oil and gas E and P activities
- 8.1.3 Increasing upstream investment
- 8.2 Market challenges
- 8.2.1 Cessation of World Bank funding for E and P activities
- 8.2.2 Volatility in oil and gas prices
- 8.2.3 Increasing investments in renewable energy
- 8.3 Impact of drivers and challenges
- Exhibit 79: Impact of drivers and challenges in 2021 and 2026
- 8.4 Market trends
- 8.4.1 Increase in deepwater and ultra-deepwater exploration
- 8.4.2 Innovations in liner hanger technology
- 8.4.3 Rise in world refining capacity
9. Vendor Landscape
- 9.1 Overview
- 9.2 Vendor landscape
- Exhibit 80: Overview on Criticality of inputs and Factors of differentiation
- 9.3 Landscape disruption
- Exhibit 81: Overview on factors of disruption
- 9.4 Industry risks
- Exhibit 82: Impact of key risks on business
10. Vendor Analysis
- 10.1 Vendors covered
- Exhibit 83: Vendors covered
- 10.2 Market positioning of vendors
- Exhibit 84: Matrix on vendor position and classification
- 10.3 Allamon Tool Co Inc.
- Exhibit 85: Allamon Tool Co Inc. - Overview
- Exhibit 86: Allamon Tool Co Inc. - Product / Service
- Exhibit 87: Allamon Tool Co Inc. - Key offerings
- 10.4 Baker Hughes Co.
- Exhibit 88: Baker Hughes Co. - Overview
- Exhibit 89: Baker Hughes Co. - Business segments
- Exhibit 90: Baker Hughes Co. - Key news
- Exhibit 91: Baker Hughes Co. - Key offerings
- Exhibit 92: Baker Hughes Co. - Segment focus
- 10.5 DEW Wartungs und Reparatur GmbH
- Exhibit 93: DEW Wartungs und Reparatur GmbH - Overview
- Exhibit 94: DEW Wartungs und Reparatur GmbH - Product / Service
- Exhibit 95: DEW Wartungs und Reparatur GmbH - Key offerings
- 10.6 Dril Quip Inc.
- Exhibit 96: Dril Quip Inc. - Overview
- Exhibit 97: Dril Quip Inc. - Business segments
- Exhibit 98: Dril Quip Inc. - Key offerings
- Exhibit 99: Dril Quip Inc. - Segment focus
- 10.7 Halliburton Co.
- Exhibit 100: Halliburton Co. - Overview
- Exhibit 101: Halliburton Co. - Product / Service
- Exhibit 102: Halliburton Co. - Key news
- Exhibit 103: Halliburton Co. - Key offerings
- 10.8 Innovex
- Exhibit 104: Innovex - Overview
- Exhibit 105: Innovex - Product / Service
- Exhibit 106: Innovex - Key offerings
- 10.9 NOV Inc.
- Exhibit 107: NOV Inc. - Overview
- Exhibit 108: NOV Inc. - Business segments
- Exhibit 109: NOV Inc. - Key news
- Exhibit 110: NOV Inc. - Key offerings
- Exhibit 111: NOV Inc. - Segment focus
- 10.10 Packers Plus Energy Services Inc.
- Exhibit 112: Packers Plus Energy Services Inc. - Overview
- Exhibit 113: Packers Plus Energy Services Inc. - Product / Service
- Exhibit 114: Packers Plus Energy Services Inc. - Key offerings
- 10.11 Schlumberger Ltd.
- Exhibit 115: Schlumberger Ltd. - Overview
- Exhibit 116: Schlumberger Ltd. - Business segments
- Exhibit 117: Schlumberger Ltd. - Key offerings
&a