|
|
市場調査レポート
商品コード
1135704
浮体式発電所の世界市場 2022-2026Global Floating Power Plant Market 2022-2026 |
||||||
|
|
|||||||
|
● お客様のご希望に応じて、既存データの加工や未掲載情報(例:国別セグメント)の追加などの対応が可能です。 詳細はお問い合わせください。 |
|||||||


| 浮体式発電所の世界市場 2022-2026 |
|
出版日: 2022年09月15日
発行: TechNavio
ページ情報: 英文 120 Pages
納期: 即納可能
|
- 全表示
- 概要
- 図表
- 目次
当レポートでは浮体式発電所の市場規模は、2022年から2026年の間に10009.26MW、予測期間中に12.57%のCAGRで成長すると予測しています。当レポートでは、浮体式発電所市場の全体分析、市場規模と予測、動向、成長促進要因・課題、約25のベンダーを網羅したベンダー分析などを提供しています。
現在の世界の市場動向と促進要因、市場全体の環境に関する最新の分析を提供しています。
市場は、代替電源ソリューションの必要性、浮体式ソーラーパネルの利点、再生可能電力における市場活動の継続的な成長によって推進されています。
本調査では、ハイブリッド浮体式太陽光発電所が、今後数年間の浮体式発電所市場の成長を促進する主要な理由の1つであることを明らかにしています。また、浮体式洋上風力発電の開拓と技術の進歩は、市場の大きな需要につながるでしょう。
目次
第1章 エグゼクティブサマリー
- 市場概要
第2章 市場情勢
- 市場エコシステム
第3章 市場規模
- 市場の定義
- 市場セグメント分析
- 市場規模 2021
- 市場の見通し:2021-2026年の予測
第4章 ファイブフォース分析
- ファイブフォースの要約
- 買い手の交渉力
- 供給企業の交渉力
- 新規参入業者の脅威
- 代替品の脅威
- 競争の脅威
- 市況
第5章 テクノロジー別市場セグメンテーション
- 市場内訳
- 技術別比較
- 非再生可能 - 市場規模と予測 2021-2026
- 再生可能エネルギー - 市場規模と予測 2021-2026
- テクノロジー別の市場機会
第6章 顧客情勢
- 顧客情勢の概要
第7章 地域別情勢
- 地域別セグメンテーション
- 地域別比較
- APAC - 市場規模と予測 2021-2026
- 中東およびアフリカ - 市場規模と予測 2021-2026
- 欧州 - 市場規模と予測 2021-2026
- 北米 - 市場規模と予測 2021-2026
- 南米 - 市場規模と予測 2021-2026
- 中国 - 市場規模と予測 2021-2026
- 日本 - 市場規模と予測 2021-2026
- アラブ首長国連邦 - 市場規模と予測 2021-2026
- サウジアラビア - 市場規模と予測 2021-2026
- 米国 - 市場規模と予測 2021-2026
- インド - 市場規模と予測 2021-2026
- 地域情勢別の市場機会
第8章 促進要因、課題、および動向
- 市場促進要因
- 市場の課題
- 促進要因と課題の影響
- 市場動向
第9章 ベンダー情勢
- 概要
- ベンダー情勢
- 混乱の状況
- 業界のリスク
第10章 ベンダー分析
- 対象ベンダー
- ベンダーの市場ポジショニング
- Burmeister and Wain Scandinavian Contractor AS
- BW Offshore Ltd
- Caterpillar Inc.
- Ciel and Terre International
- Floating Power Plant AS
- General Electric Co
- Karadeniz Holding
- Kawasaki Heavy Industries Ltd.
- Kyocera Corp.
- Principle Power Inc.
第11章 付録
Exhibits:
- Exhibits1: Executive Summary - Chart on Market Overview
- Exhibits2: Executive Summary - Data Table on Market Overview
- Exhibits3: Executive Summary - Chart on Global Market Characteristics
- Exhibits4: Executive Summary - Chart on Market By Geographical Landscape
- Exhibits5: Executive Summary - Chart on Market Segmentation by Technology
- Exhibits6: Executive Summary - Chart on Incremental Growth
- Exhibits7: Executive Summary - Data Table on Incremental Growth
- Exhibits8: Executive Summary - Chart on Vendor Market Positioning
- Exhibits9: Parent market
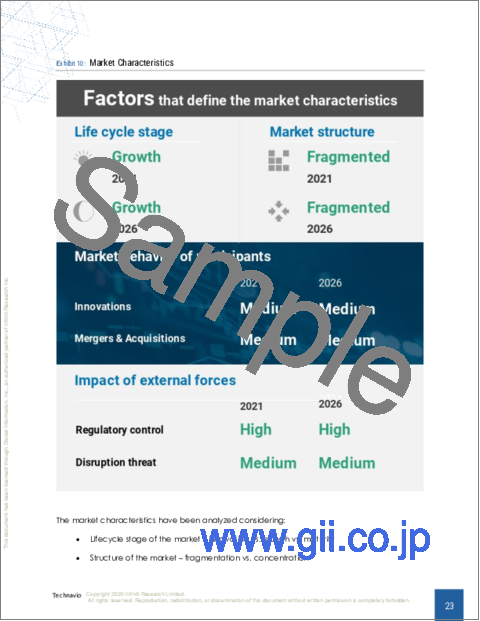
- Exhibits10: Market Characteristics
- Exhibits11: Offerings of vendors included in the market definition
- Exhibits12: Market segments
- Exhibits13: Chart on Global - Market size and forecast 2021-2026 (MW)
- Exhibits14: Data Table on Global - Market size and forecast 2021-2026 (MW)
- Exhibits15: Chart on Global Market- Year-over-year growth 2021-2026 (%)
- Exhibits16: Data Table on Global Market- Year-over-year growth 2021-2026 (%)
- Exhibits17: Five forces analysis - Comparison between 2021 and 2026
- Exhibits18: Chart on Bargaining power of buyers - Impact of key factors 2021 and 2026
- Exhibits19: Bargaining power of suppliers - Impact of key factors in 2021 and 2026
- Exhibits20: Threat of new entrants - Impact of key factors in 2021 and 2026
- Exhibits21: Threat of substitutes - Impact of key factors in 2021 and 2026
- Exhibits22: Threat of rivalry - Impact of key factors in 2021 and 2026
- Exhibits23: Chart on Market condition - Five forces 2021 and 2026
- Exhibits24: Chart on Technology - Market share 2021-2026 (%)
- Exhibits25: Data Table on Technology - Market share 2021-2026 (%)
- Exhibits26: Chart on Comparison by Technology
- Exhibits27: Data Table on Comparison by Technology
- Exhibits28: Chart on Non-renewable - Market size and forecast 2021-2026 (MW)
- Exhibits29: Data Table on Non-renewable - Market size and forecast 2021-2026 (MW)
- Exhibits30: Chart on Non-renewable - Year-over-year growth 2021-2026 (%)
- Exhibits31: Data Table on Non-renewable - Year-over-year growth 2021-2026 (%)
- Exhibits32: Chart on Renewable - Market size and forecast 2021-2026 (MW)
- Exhibits33: Data Table on Renewable - Market size and forecast 2021-2026 (MW)
- Exhibits34: Chart on Renewable - Year-over-year growth 2021-2026 (%)
- Exhibits35: Data Table on Renewable - Year-over-year growth 2021-2026 (%)
- Exhibits36: Market opportunity by Technology (MW)
- Exhibits37: Analysis of price sensitivity, lifecycle, customer purchase basket, adoption rates, and purchase criteria
- Exhibits38: Chart on Market share By Geographical Landscape 2021-2026 (%)
- Exhibits39: Data Table on Market share By Geographical Landscape 2021-2026 (%)
- Exhibits40: Chart on Geographic comparison
- Exhibits41: Data Table on Geographic comparison
- Exhibits42: Chart on APAC - Market size and forecast 2021-2026 (MW)
- Exhibits43: Data Table on APAC - Market size and forecast 2021-2026 (MW)
- Exhibits44: Chart on APAC - Year-over-year growth 2021-2026 (%)
- Exhibits45: Data Table on APAC - Year-over-year growth 2021-2026 (%)
- Exhibits46: Chart on Middle East and Africa - Market size and forecast 2021-2026 (MW)
- Exhibits47: Data Table on Middle East and Africa - Market size and forecast 2021-2026 (MW)
- Exhibits48: Chart on Middle East and Africa - Year-over-year growth 2021-2026 (%)
- Exhibits49: Data Table on Middle East and Africa - Year-over-year growth 2021-2026 (%)
- Exhibits50: Chart on Europe - Market size and forecast 2021-2026 (MW)
- Exhibits51: Data Table on Europe - Market size and forecast 2021-2026 (MW)
- Exhibits52: Chart on Europe - Year-over-year growth 2021-2026 (%)
- Exhibits53: Data Table on Europe - Year-over-year growth 2021-2026 (%)
- Exhibits54: Chart on North America - Market size and forecast 2021-2026 (MW)
- Exhibits55: Data Table on North America - Market size and forecast 2021-2026 (MW)
- Exhibits56: Chart on North America - Year-over-year growth 2021-2026 (%)
- Exhibits57: Data Table on North America - Year-over-year growth 2021-2026 (%)
- Exhibits58: Chart on South America - Market size and forecast 2021-2026 (MW)
- Exhibits59: Data Table on South America - Market size and forecast 2021-2026 (MW)
- Exhibits60: Chart on South America - Year-over-year growth 2021-2026 (%)
- Exhibits61: Data Table on South America - Year-over-year growth 2021-2026 (%)
- Exhibits62: Chart on China - Market size and forecast 2021-2026 (MW)
- Exhibits63: Data Table on China - Market size and forecast 2021-2026 (MW)
- Exhibits64: Chart on China - Year-over-year growth 2021-2026 (%)
- Exhibits65: Data Table on China - Year-over-year growth 2021-2026 (%)
- Exhibits66: Chart on Japan - Market size and forecast 2021-2026 (MW)
- Exhibits67: Data Table on Japan - Market size and forecast 2021-2026 (MW)
- Exhibits68: Chart on Japan - Year-over-year growth 2021-2026 (%)
- Exhibits69: Data Table on Japan - Year-over-year growth 2021-2026 (%)
- Exhibits70: Chart on United Arab Emirates - Market size and forecast 2021-2026 (MW)
- Exhibits71: Data Table on United Arab Emirates - Market size and forecast 2021-2026 (MW)
- Exhibits72: Chart on United Arab Emirates - Year-over-year growth 2021-2026 (%)
- Exhibits73: Data Table on United Arab Emirates - Year-over-year growth 2021-2026 (%)
- Exhibits74: Chart on Saudi Arabia - Market size and forecast 2021-2026 (MW)
- Exhibits75: Data Table on Saudi Arabia - Market size and forecast 2021-2026 (MW)
- Exhibits76: Chart on Saudi Arabia - Year-over-year growth 2021-2026 (%)
- Exhibits77: Data Table on Saudi Arabia - Year-over-year growth 2021-2026 (%)
- Exhibits78: Chart on US - Market size and forecast 2021-2026 (MW)
- Exhibits79: Data Table on US - Market size and forecast 2021-2026 (MW)
- Exhibits80: Chart on US - Year-over-year growth 2021-2026 (%)
- Exhibits81: Data Table on US - Year-over-year growth 2021-2026 (%)
- Exhibits82: Chart on India - Market size and forecast 2021-2026 (MW)
- Exhibits83: Data Table on India - Market size and forecast 2021-2026 (MW)
- Exhibits84: Chart on India - Year-over-year growth 2021-2026 (%)
- Exhibits85: Data Table on India - Year-over-year growth 2021-2026 (%)
- Exhibits86: Market opportunity By Geographical Landscape (MW)
- Exhibits87: Impact of drivers and challenges in 2021 and 2026
- Exhibits88: Overview on Criticality of inputs and Factors of differentiation
- Exhibits89: Overview on factors of disruption
- Exhibits90: Impact of key risks on business
- Exhibits91: Vendors covered
- Exhibits92: Matrix on vendor position and classification
- Exhibits93: Burmeister and Wain Scandinavian Contractor AS - Overview
- Exhibits94: Burmeister and Wain Scandinavian Contractor AS - Business segments
- Exhibits95: Burmeister and Wain Scandinavian Contractor AS - Key offerings
- Exhibits96: Burmeister and Wain Scandinavian Contractor AS - Segment focus
- Exhibits97: BW Offshore Ltd - Overview
- Exhibits98: BW Offshore Ltd - Product / Service
- Exhibits99: BW Offshore Ltd - Key offerings
- Exhibits100: Caterpillar Inc. - Overview
- Exhibits101: Caterpillar Inc. - Business segments
- Exhibits102: Caterpillar Inc. - Key offerings
- Exhibits103: Caterpillar Inc. - Segment focus
- Exhibits104: Ciel and Terre International - Overview
- Exhibits105: Ciel and Terre International - Product / Service
- Exhibits106: Ciel and Terre International - Key offerings
- Exhibits107: Floating Power Plant AS - Overview
- Exhibits108: Floating Power Plant AS - Product / Service
- Exhibits109: Floating Power Plant AS - Key offerings
- Exhibits110: General Electric Co - Overview
- Exhibits111: General Electric Co - Business segments
- Exhibits112: General Electric Co - Key news
- Exhibits113: General Electric Co - Key offerings
- Exhibits114: General Electric Co - Segment focus
- Exhibits115: Karadeniz Holding - Overview
- Exhibits116: Karadeniz Holding - Product / Service
- Exhibits117: Karadeniz Holding - Key offerings
- Exhibits118: Kawasaki Heavy Industries Ltd. - Overview
- Exhibits119: Kawasaki Heavy Industries Ltd. - Business segments
- Exhibits120: Kawasaki Heavy Industries Ltd. - Key news
- Exhibits121: Kawasaki Heavy Industries Ltd. - Key offerings
- Exhibits122: Kawasaki Heavy Industries Ltd. - Segment focus
- Exhibits123: Kyocera Corp. - Overview
- Exhibits124: Kyocera Corp. - Business segments
- Exhibits125: Kyocera Corp. - Key offerings
- Exhibits126: Kyocera Corp. - Segment focus
- Exhibits127: Principle Power Inc. - Overview
- Exhibits128: Principle Power Inc. - Product / Service
- Exhibits129: Principle Power Inc. - Key offerings
- Exhibits130: Inclusions checklist
- Exhibits131: Exclusions checklist
- Exhibits132: Currency conversion rates for US$
- Exhibits133: Research methodology
- Exhibits134: Validation techniques employed for market sizing
- Exhibits135: Information sources
- Exhibits136: List of abbreviations
Technavio has been monitoring the floating power plant market and it is poised to grow by 10009.26 MW during 2022-2026, accelerating at a CAGR of 12.57% during the forecast period. Our report on the floating power plant market provides a holistic analysis, market size and forecast, trends, growth drivers, and challenges, as well as vendor analysis covering around 25 vendors.
The report offers an up-to-date analysis regarding the current global market scenario, the latest trends and drivers, and the overall market environment. The market is driven by the need for alternate power solutions, the benefits of floating solar panels, and the continued growth of market activities in renewable power.
The floating power plant market analysis includes the technology segment and geographic landscape.
Technavio's floating power plant market is segmented as below:
By Technology
- Non-renewable
- Renewable
By Geographical Landscape
- APAC
- Middle East and Africa
- Europe
- North America
- South America
This study identifies the hybrid floating solar power plants as one of the prime reasons driving the floating power plant market growth during the next few years. Also, the development of floating offshore wind and advances in technology will lead to sizable demand in the market.
Technavio presents a detailed picture of the market by the way of study, synthesis, and summation of data from multiple sources by an analysis of key parameters. Our report on the floating power plant market covers the following areas:
- Floating power plant market sizing
- Floating power plant market forecast
- Floating power plant market industry analysis
Technavio's robust vendor analysis is designed to help clients improve their market position, and in line with this, this report provides a detailed analysis of several leading floating power plant market vendors that include Burmeister and Wain Scandinavian Contractor AS, BW Offshore Ltd, Caterpillar Inc., Ciel and Terre International, Equinor ASA, Floating Power Plant AS, Hydrosun Pty Ltd., Karadeniz Holding, Kawasaki Heavy Industries Ltd., Kyocera Corp., Mitsubishi Heavy Industries Ltd., Principle Power Inc., SeaTwirl AB, Siemens Energy AG, Sinovoltaics Group Ltd., General Electric Co, Trina Solar Co. Ltd., Vikram Solar Ltd., Volkswagen AG, and Wartsila Corp. Also, the floating power plant market analysis report includes information on upcoming trends and challenges that will influence market growth. This is to help companies strategize and leverage all forthcoming growth opportunities.
The study was conducted using an objective combination of primary and secondary information including inputs from key participants in the industry. The report contains a comprehensive market and vendor landscape in addition to an analysis of the key vendors.
Technavio presents a detailed picture of the market by the way of study, synthesis, and summation of data from multiple sources by an analysis of key parameters such as profit, pricing, competition, and promotions. It presents various market facets by identifying the key industry influencers. The data presented is comprehensive, reliable, and a result of extensive research - both primary and secondary. Technavio's market research reports provide a complete competitive landscape and an in-depth vendor selection methodology and analysis using qualitative and quantitative research to forecast accurate market growth.
Table of Contents
1 Executive Summary
- 1.1 Market overview
- Exhibit 01: Executive Summary - Chart on Market Overview
- Exhibit 02: Executive Summary - Data Table on Market Overview
- Exhibit 03: Executive Summary - Chart on Global Market Characteristics
- Exhibit 04: Executive Summary - Chart on Market By Geographical Landscape
- Exhibit 05: Executive Summary - Chart on Market Segmentation by Technology
- Exhibit 06: Executive Summary - Chart on Incremental Growth
- Exhibit 07: Executive Summary - Data Table on Incremental Growth
- Exhibit 08: Executive Summary - Chart on Vendor Market Positioning
2 Market Landscape
- 2.1 Market ecosystem
- Exhibit 09: Parent market
- Exhibit 10: Market Characteristics
3 Market Sizing
- 3.1 Market definition
- Exhibit 11: Offerings of vendors included in the market definition
- 3.2 Market segment analysis
- Exhibit 12: Market segments
- 3.3 Market size 2021
- 3.4 Market outlook: Forecast for 2021-2026
- Exhibit 13: Chart on Global - Market size and forecast 2021-2026 (MW)
- Exhibit 14: Data Table on Global - Market size and forecast 2021-2026 (MW)
- Exhibit 15: Chart on Global Market- Year-over-year growth 2021-2026 (%)
- Exhibit 16: Data Table on Global Market- Year-over-year growth 2021-2026 (%)
4 Five Forces Analysis
- 4.1 Five forces summary
- Exhibit 17: Five forces analysis - Comparison between 2021 and 2026
- 4.2 Bargaining power of buyers
- Exhibit 18: Chart on Bargaining power of buyers - Impact of key factors 2021 and 2026
- 4.3 Bargaining power of suppliers
- Exhibit 19: Bargaining power of suppliers - Impact of key factors in 2021 and 2026
- 4.4 Threat of new entrants
- Exhibit 20: Threat of new entrants - Impact of key factors in 2021 and 2026
- 4.5 Threat of substitutes
- Exhibit 21: Threat of substitutes - Impact of key factors in 2021 and 2026
- 4.6 Threat of rivalry
- Exhibit 22: Threat of rivalry - Impact of key factors in 2021 and 2026
- 4.7 Market condition
- Exhibit 23: Chart on Market condition - Five forces 2021 and 2026
5 Market Segmentation by Technology
- 5.1 Market segments
- Exhibit 24: Chart on Technology - Market share 2021-2026 (%)
- Exhibit 25: Data Table on Technology - Market share 2021-2026 (%)
- 5.2 Comparison by Technology
- Exhibit 26: Chart on Comparison by Technology
- Exhibit 27: Data Table on Comparison by Technology
- 5.3 Non-renewable - Market size and forecast 2021-2026
- Exhibit 28: Chart on Non-renewable - Market size and forecast 2021-2026 (MW)
- Exhibit 29: Data Table on Non-renewable - Market size and forecast 2021-2026 (MW)
- Exhibit 30: Chart on Non-renewable - Year-over-year growth 2021-2026 (%)
- Exhibit 31: Data Table on Non-renewable - Year-over-year growth 2021-2026 (%)
- 5.4 Renewable - Market size and forecast 2021-2026
- Exhibit 32: Chart on Renewable - Market size and forecast 2021-2026 (MW)
- Exhibit 33: Data Table on Renewable - Market size and forecast 2021-2026 (MW)
- Exhibit 34: Chart on Renewable - Year-over-year growth 2021-2026 (%)
- Exhibit 35: Data Table on Renewable - Year-over-year growth 2021-2026 (%)
- 5.5 Market opportunity by Technology
- Exhibit 36: Market opportunity by Technology (MW)
6 Customer Landscape
- 6.1 Customer landscape overview
- Exhibit 37: Analysis of price sensitivity, lifecycle, customer purchase basket, adoption rates, and purchase criteria
7 Geographic Landscape
- 7.1 Geographic segmentation
- Exhibit 38: Chart on Market share By Geographical Landscape 2021-2026 (%)
- Exhibit 39: Data Table on Market share By Geographical Landscape 2021-2026 (%)
- 7.2 Geographic comparison
- Exhibit 40: Chart on Geographic comparison
- Exhibit 41: Data Table on Geographic comparison
- 7.3 APAC - Market size and forecast 2021-2026
- Exhibit 42: Chart on APAC - Market size and forecast 2021-2026 (MW)
- Exhibit 43: Data Table on APAC - Market size and forecast 2021-2026 (MW)
- Exhibit 44: Chart on APAC - Year-over-year growth 2021-2026 (%)
- Exhibit 45: Data Table on APAC - Year-over-year growth 2021-2026 (%)
- 7.4 Middle East and Africa - Market size and forecast 2021-2026
- Exhibit 46: Chart on Middle East and Africa - Market size and forecast 2021-2026 (MW)
- Exhibit 47: Data Table on Middle East and Africa - Market size and forecast 2021-2026 (MW)
- Exhibit 48: Chart on Middle East and Africa - Year-over-year growth 2021-2026 (%)
- Exhibit 49: Data Table on Middle East and Africa - Year-over-year growth 2021-2026 (%)
- 7.5 Europe - Market size and forecast 2021-2026
- Exhibit 50: Chart on Europe - Market size and forecast 2021-2026 (MW)
- Exhibit 51: Data Table on Europe - Market size and forecast 2021-2026 (MW)
- Exhibit 52: Chart on Europe - Year-over-year growth 2021-2026 (%)
- Exhibit 53: Data Table on Europe - Year-over-year growth 2021-2026 (%)
- 7.6 North America - Market size and forecast 2021-2026
- Exhibit 54: Chart on North America - Market size and forecast 2021-2026 (MW)
- Exhibit 55: Data Table on North America - Market size and forecast 2021-2026 (MW)
- Exhibit 56: Chart on North America - Year-over-year growth 2021-2026 (%)
- Exhibit 57: Data Table on North America - Year-over-year growth 2021-2026 (%)
- 7.7 South America - Market size and forecast 2021-2026
- Exhibit 58: Chart on South America - Market size and forecast 2021-2026 (MW)
- Exhibit 59: Data Table on South America - Market size and forecast 2021-2026 (MW)
- Exhibit 60: Chart on South America - Year-over-year growth 2021-2026 (%)
- Exhibit 61: Data Table on South America - Year-over-year growth 2021-2026 (%)
- 7.8 China - Market size and forecast 2021-2026
- Exhibit 62: Chart on China - Market size and forecast 2021-2026 (MW)
- Exhibit 63: Data Table on China - Market size and forecast 2021-2026 (MW)
- Exhibit 64: Chart on China - Year-over-year growth 2021-2026 (%)
- Exhibit 65: Data Table on China - Year-over-year growth 2021-2026 (%)
- 7.9 Japan - Market size and forecast 2021-2026
- Exhibit 66: Chart on Japan - Market size and forecast 2021-2026 (MW)
- Exhibit 67: Data Table on Japan - Market size and forecast 2021-2026 (MW)
- Exhibit 68: Chart on Japan - Year-over-year growth 2021-2026 (%)
- Exhibit 69: Data Table on Japan - Year-over-year growth 2021-2026 (%)
- 7.10 United Arab Emirates - Market size and forecast 2021-2026
- Exhibit 70: Chart on United Arab Emirates - Market size and forecast 2021-2026 (MW)
- Exhibit 71: Data Table on United Arab Emirates - Market size and forecast 2021-2026 (MW)
- Exhibit 72: Chart on United Arab Emirates - Year-over-year growth 2021-2026 (%)
- Exhibit 73: Data Table on United Arab Emirates - Year-over-year growth 2021-2026 (%)
- 7.11 Saudi Arabia - Market size and forecast 2021-2026
- Exhibit 74: Chart on Saudi Arabia - Market size and forecast 2021-2026 (MW)
- Exhibit 75: Data Table on Saudi Arabia - Market size and forecast 2021-2026 (MW)
- Exhibit 76: Chart on Saudi Arabia - Year-over-year growth 2021-2026 (%)
- Exhibit 77: Data Table on Saudi Arabia - Year-over-year growth 2021-2026 (%)
- 7.12 US - Market size and forecast 2021-2026
- Exhibit 78: Chart on US - Market size and forecast 2021-2026 (MW)
- Exhibit 79: Data Table on US - Market size and forecast 2021-2026 (MW)
- Exhibit 80: Chart on US - Year-over-year growth 2021-2026 (%)
- Exhibit 81: Data Table on US - Year-over-year growth 2021-2026 (%)
- 7.13 India - Market size and forecast 2021-2026
- Exhibit 82: Chart on India - Market size and forecast 2021-2026 (MW)
- Exhibit 83: Data Table on India - Market size and forecast 2021-2026 (MW)
- Exhibit 84: Chart on India - Year-over-year growth 2021-2026 (%)
- Exhibit 85: Data Table on India - Year-over-year growth 2021-2026 (%)
- 7.14 Market opportunity By Geographical Landscape
- Exhibit 86: Market opportunity By Geographical Landscape (MW)
8 Drivers, Challenges, and Trends
- 8.1 Market drivers
- 8.2 Market challenges
- 8.3 Impact of drivers and challenges
- Exhibit 87: Impact of drivers and challenges in 2021 and 2026
- 8.4 Market trends
9 Vendor Landscape
- 9.1 Overview
- 9.2 Vendor landscape
- Exhibit 88: Overview on Criticality of inputs and Factors of differentiation
- 9.3 Landscape disruption
- Exhibit 89: Overview on factors of disruption
- 9.4 Industry risks
- Exhibit 90: Impact of key risks on business
10 Vendor Analysis
- 10.1 Vendors covered
- Exhibit 91: Vendors covered
- 10.2 Market positioning of vendors
- Exhibit 92: Matrix on vendor position and classification
- 10.3 Burmeister and Wain Scandinavian Contractor AS
- Exhibit 93: Burmeister and Wain Scandinavian Contractor AS - Overview
- Exhibit 94: Burmeister and Wain Scandinavian Contractor AS - Business segments
- Exhibit 95: Burmeister and Wain Scandinavian Contractor AS - Key offerings
- Exhibit 96: Burmeister and Wain Scandinavian Contractor AS - Segment focus
- 10.4 BW Offshore Ltd
- Exhibit 97: BW Offshore Ltd - Overview
- Exhibit 98: BW Offshore Ltd - Product / Service
- Exhibit 99: BW Offshore Ltd - Key offerings
- 10.5 Caterpillar Inc.
- Exhibit 100: Caterpillar Inc. - Overview
- Exhibit 101: Caterpillar Inc. - Business segments
- Exhibit 102: Caterpillar Inc. - Key offerings
- Exhibit 103: Caterpillar Inc. - Segment focus
- 10.6 Ciel and Terre International
- Exhibit 104: Ciel and Terre International - Overview
- Exhibit 105: Ciel and Terre International - Product / Service
- Exhibit 106: Ciel and Terre International - Key offerings
- 10.7 Floating Power Plant AS
- Exhibit 107: Floating Power Plant AS - Overview
- Exhibit 108: Floating Power Plant AS - Product / Service
- Exhibit 109: Floating Power Plant AS - Key offerings
- 10.8 General Electric Co
- Exhibit 110: General Electric Co - Overview
- Exhibit 111: General Electric Co - Business segments
- Exhibit 112: General Electric Co - Key news
- Exhibit 113: General Electric Co - Key offerings
- Exhibit 114: General Electric Co - Segment focus
- 10.9 Karadeniz Holding
- Exhibit 115: Karadeniz Holding - Overview
- Exhibit 116: Karadeniz Holding - Product / Service
- Exhibit 117: Karadeniz Holding - Key offerings
- 10.10 Kawasaki Heavy Industries Ltd.
- Exhibit 118: Kawasaki Heavy Industries Ltd. - Overview
- Exhibit 119: Kawasaki Heavy Industries Ltd. - Business segments
- Exhibit 120: Kawasaki Heavy Industries Ltd. - Key news
- Exhibit 121: Kawasaki Heavy Industries Ltd. - Key offerings
- Exhibit 122: Kawasaki Heavy Industries Ltd. - Segment focus
- 10.11 Kyocera Corp.
- Exhibit 123: Kyocera Corp. - Overview
- Exhibit 124: Kyocera Corp. - Business segments
- Exhibit 125: Kyocera Corp. - Key offerings
- Exhibit 126: Kyocera Corp. - Segment focus
- 10.12 Principle Power Inc.
- Exhibit 127: Principle Power Inc. - Overview
- Exhibit 128: Principle Power Inc. - Product / Service
- Exhibit 129: Principle Power Inc. - Key offerings
11 Appendix
- 11.1 Scope of the report
- 11.2 Inclusions and exclusions checklist
- Exhibit 130: Inclusions checklist
- Exhibit 131: Exclusions checklist
- 11.3 Currency conversion rates for US$
- Exhibit 132: Currency conversion rates for US$
- 11.4 Research methodology
- Exhibit 133: Research methodology
- Exhibit 134: Validation techniques employed for market sizing
- Exhibit 135: Information sources
- 11.5 List of abbreviations
- Exhibit 136: List of abbreviations