|
|
市場調査レポート
商品コード
1069833
人工喉頭装置の世界市場:2022年~2026年Global Voice Prosthesis Devices Market 2022-2026 |
||||||
|
|
|||||||
|
● お客様のご希望に応じて、既存データの加工や未掲載情報(例:国別セグメント)の追加などの対応が可能です。 詳細はお問い合わせください。 |
|||||||


| 人工喉頭装置の世界市場:2022年~2026年 |
|
出版日: 2022年04月12日
発行: TechNavio
ページ情報: 英文 120 Pages
納期: 即納可能
|
- 全表示
- 概要
- 目次
世界の人工喉頭装置の市場規模は、2022年~2026年の間に10億8,000万米ドルの増加が見込まれ、予測期間中に5.44%のCAGRで成長すると予測されています。
市場を牽引しているのは、喉頭癌の発生率の増加、低侵襲な耳鼻咽喉科(ENT)手術の需要の拡大、製品発売数の増加です。
当レポートでは、世界の人工喉頭装置市場について調査分析し、全体的な分析、市場規模と予測、動向、成長促進要因、課題、および約25社のベンダーをカバーするベンダー分析を提供しています。
目次
第1章 エグゼクティブサマリー
- 市場概要
第2章 市場情勢
- 市場のエコシステム
第3章 市場規模
- 市場の定義
- 市場セグメント分析
- 市場規模(2021年)
- 市場の見通し:2021年~2026年の予測
第4章 ファイブフォース分析
- ファイブフォースの要約
- 買い手の交渉力
- 供給企業の交渉力
- 新規参入業者の脅威
- 代替品の脅威
- ライバルの脅威
- 市況
第5章 製品別の市場セグメンテーション
- 市場セグメント
- 製品別の比較
- 留置型人工喉頭装置:市場規模と予測(2021年~2026年)
- 非留置型人工喉頭装置:市場規模と予測(2021年~2026年)
- 製品別の市場機会
第6章 顧客情勢
- 顧客情勢の概要
第7章 地域別の情勢
- 地域別のセグメンテーション
- 地域別の比較
- 北米:市場規模と予測(2021年~2026年)
- 欧州:市場規模と予測(2021年~2026年)
- アジア:市場規模と予測(2021年~2026年)
- その他の地域(ROW):市場規模と予測(2021年~2026年)
- 米国:市場規模と予測(2021年~2026年)
- フランス:市場規模と予測(2021年~2026年)
- 中国:市場規模と予測(2021年~2026年)
- カナダ:市場規模と予測(2021年~2026年)
- インド:市場規模と予測(2021年~2026年)
- 地域情勢別の市場機会
第8章 促進要因・課題・動向
- 市場促進要因
- 市場の課題
- 促進要因と課題の影響
- 市場動向
第9章 ベンダー情勢
- 概要
- ベンダー情勢
- 混乱情勢
- 業界のリスク
第10章 ベンダー分析
- 対象ベンダー
- ベンダーの市場ポジショニング
- Andreas Fahl Medizintechnik Vertrieb GmbH
- Atos Medical AB
- ICU Medical Inc.
- Johnson and Johnson
- KARL STORZ SE and Co. KG
- NOK Corp.
- Servona GmbH
第11章 付録
Technavio has been monitoring the voice prosthesis devices market and it is poised to grow by $ 1.08 bn during 2022-2026 progressing at a CAGR of 5.44% during the forecast period. Our report on the voice prosthesis devices market provides a holistic analysis, market size and forecast, trends, growth drivers, and challenges, as well as vendor analysis covering around 25 vendors.
The report offers an up-to-date analysis regarding the current global market scenario, latest trends and drivers, and the overall market environment. The market is driven by the growing incidences of laryngeal cancer, increasing demand for minimally invasive ENT surgeries, and increasing number of product launches.
The voice prosthesis devices market analysis includes the product segment and geographic landscape.
Technavio's voice prosthesis devices market is segmented as below:
By Product
- Indwelling voice prosthesis devices
- Non-indwelling voice prosthesis devices
By Geographical Landscape
- North America
- Europe
- Asia
- Rest of World (ROW)
This study identifies the product bundling as one of the prime reasons driving the voice prosthesis devices market growth during the next few years. Also, the growing adoption of indwelling voice prosthesis devices and online marketing of voice prosthesis devices will lead to sizable demand in the market.
Technavio presents a detailed picture of the market by the way of study, synthesis, and summation of data from multiple sources by an analysis of key parameters. Our report on voice prosthesis devices market covers the following areas:
- Voice prosthesis devices market sizing
- Voice prosthesis devices market forecast
- Voice prosthesis devices market industry analysis
Technavio's robust vendor analysis is designed to help clients improve their market position, and in line with this, this report provides a detailed analysis of several leading voice prosthesis devices market vendors that include Andreas Fahl Medizintechnik Vertrieb GmbH, Atos Medical AB, ICU Medical Inc., Johnson and Johnson, KARL STORZ SE and Co. KG, NOK Corp., and Servona GmbH. Also, the voice prosthesis devices market analysis report includes information on upcoming trends and challenges that will influence market growth. This is to help companies strategize and leverage all forthcoming growth opportunities.
The study was conducted using an objective combination of primary and secondary information including inputs from key participants in the industry. The report contains a comprehensive market and vendor landscape in addition to an analysis of the key vendors.
Technavio presents a detailed picture of the market by the way of study, synthesis, and summation of data from multiple sources by an analysis of key parameters such as profit, pricing, competition, and promotions. It presents various market facets by identifying the key industry influencers. The data presented is comprehensive, reliable, and a result of extensive research - both primary and secondary. Technavio's market research reports provide a complete competitive landscape and an in-depth vendor selection methodology and analysis using qualitative and quantitative research to forecast the accurate market growth.
Table of Contents
1 Executive Summary
- 1.1 Market overview
- Exhibit 01: Executive Summary - Chart on Market Overview
- Exhibit 02: Executive Summary - Data Table on Market Overview
- Exhibit 03: Executive Summary - Chart on Global Market Characteristics
- Exhibit 04: Executive Summary - Chart on Market By Geographical Landscape
- Exhibit 05: Executive Summary - Chart on Market Segmentation by Product
- Exhibit 06: Executive Summary - Chart on Incremental Growth
- Exhibit 07: Executive Summary - Data Table on Incremental Growth
- Exhibit 08: Executive Summary - Chart on Vendor Market Positioning
2 Market Landscape
- 2.1 Market ecosystem
- Exhibit 09: Parent market
- Exhibit 10: Market Characteristics
3 Market Sizing
- 3.1 Market definition
- Exhibit 11: Offerings of vendors included in the market definition
- 3.2 Market segment analysis
- Exhibit 12: Market segments
- 3.3 Market size 2021
- 3.4 Market outlook: Forecast for 2021-2026
- Exhibit 13: Chart on Global - Market size and forecast 2021-2026 ($ million)
- Exhibit 14: Data Table on Global - Market size and forecast 2021-2026 ($ million)
- Exhibit 15: Chart on Global Market: Year-over-year growth 2021-2026 (%)
- Exhibit 16: Data Table on Global Market: Year-over-year growth 2021-2026 (%)
4 Five Forces Analysis
- 4.1 Five forces summary
- Exhibit 17: Five forces analysis - Comparison between2021 and 2026
- 4.2 Bargaining power of buyers
- Exhibit 18: Chart on Bargaining power of buyers - Impact of key factors 2021 and 2026
- 4.3 Bargaining power of suppliers
- Exhibit 19: Bargaining power of suppliers - Impact of key factors in 2021 and 2026
- 4.4 Threat of new entrants
- Exhibit 20: Threat of new entrants - Impact of key factors in 2021 and 2026
- 4.5 Threat of substitutes
- Exhibit 21: Threat of substitutes - Impact of key factors in 2021 and 2026
- 4.6 Threat of rivalry
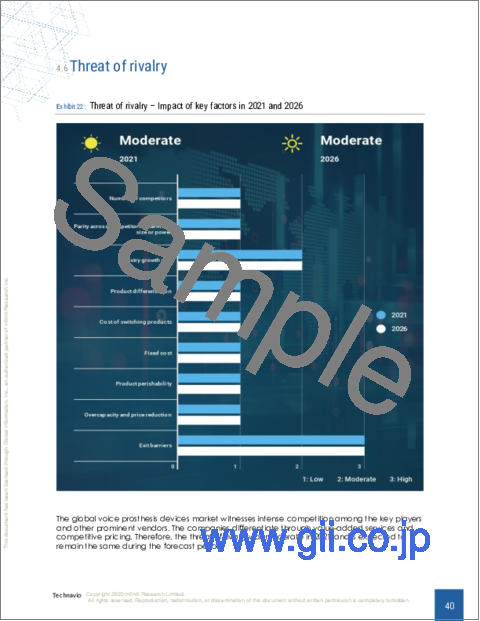
- Exhibit 22: Threat of rivalry - Impact of key factors in 2021 and 2026
- 4.7 Market condition
- Exhibit 23: Chart on Market condition - Five forces 2021 and 2026
5 Market Segmentation by Product
- 5.1 Market segments
- Exhibit 24: Chart on Product - Market share 2021-2026 (%)
- Exhibit 25: Data Table on Product - Market share 2021-2026 (%)
- 5.2 Comparison by Product
- Exhibit 26: Chart on Comparison by Product
- Exhibit 27: Data Table on Comparison by Product
- 5.3 Indwelling voice prosthesis devices - Market size and forecast 2021-2026
- Exhibit 28: Chart on Indwelling voice prosthesis devices - Market size and forecast 2021-2026 ($ million)
- Exhibit 29: Data Table on Indwelling voice prosthesis devices - Market size and forecast 2021-2026 ($ million)
- Exhibit 30: Chart on Indwelling voice prosthesis devices - Year-over-year growth 2021-2026 (%)
- Exhibit 31: Data Table on Indwelling voice prosthesis devices - Year-over-year growth 2021-2026 (%)
- 5.4 Non-indwelling voice prosthesis devices - Market size and forecast 2021-2026
- Exhibit 32: Chart on Non-indwelling voice prosthesis devices - Market size and forecast 2021-2026 ($ million)
- Exhibit 33: Data Table on Non-indwelling voice prosthesis devices - Market size and forecast 2021-2026 ($ million)
- Exhibit 34: Chart on Non-indwelling voice prosthesis devices - Year-over-year growth 2021-2026 (%)
- Exhibit 35: Data Table on Non-indwelling voice prosthesis devices - Year-over-year growth 2021-2026 (%)
- 5.5 Market opportunity by Product
- Exhibit 36: Market opportunity by Product ($ million)
6 Customer Landscape
- 6.1 Customer landscape overview
- Exhibit 37: Analysis of price sensitivity, lifecycle, customer purchase basket, adoption rates, and purchase criteria
7 Geographic Landscape
- 7.1 Geographic segmentation
- Exhibit 38: Chart on Market share By Geographical Landscape 2021-2026 (%)
- Exhibit 39: Data Table on Market share By Geographical Landscape 2021-2026 (%)
- 7.2 Geographic comparison
- Exhibit 40: Chart on Geographic comparison
- Exhibit 41: Data Table on Geographic comparison
- 7.3 North America - Market size and forecast 2021-2026
- Exhibit 42: Chart on North America - Market size and forecast 2021-2026 ($ million)
- Exhibit 43: Data Table on North America - Market size and forecast 2021-2026 ($ million)
- Exhibit 44: Chart on North America - Year-over-year growth 2021-2026 (%)
- Exhibit 45: Data Table on North America - Year-over-year growth 2021-2026 (%)
- 7.4 Europe - Market size and forecast 2021-2026
- Exhibit 46: Chart on Europe - Market size and forecast 2021-2026 ($ million)
- Exhibit 47: Data Table on Europe - Market size and forecast 2021-2026 ($ million)
- Exhibit 48: Chart on Europe - Year-over-year growth 2021-2026 (%)
- Exhibit 49: Data Table on Europe - Year-over-year growth 2021-2026 (%)
- 7.5 Asia - Market size and forecast 2021-2026
- Exhibit 50: Chart on Asia - Market size and forecast 2021-2026 ($ million)
- Exhibit 51: Data Table on Asia - Market size and forecast 2021-2026 ($ million)
- Exhibit 52: Chart on Asia - Year-over-year growth 2021-2026 (%)
- Exhibit 53: Data Table on Asia - Year-over-year growth 2021-2026 (%)
- 7.6 Rest of World (ROW) - Market size and forecast 2021-2026
- Exhibit 54: Chart on Rest of World (ROW) - Market size and forecast 2021-2026 ($ million)
- Exhibit 55: Data Table on Rest of World (ROW) - Market size and forecast 2021-2026 ($ million)
- Exhibit 56: Chart on Rest of World (ROW) - Year-over-year growth 2021-2026 (%)
- Exhibit 57: Data Table on Rest of World (ROW) - Year-over-year growth 2021-2026 (%)
- 7.7 US - Market size and forecast 2021-2026
- Exhibit 58: Chart on US - Market size and forecast 2021-2026 ($ million)
- Exhibit 59: Data Table on US - Market size and forecast 2021-2026 ($ million)
- Exhibit 60: Chart on US - Year-over-year growth 2021-2026 (%)
- Exhibit 61: Data Table on US - Year-over-year growth 2021-2026 (%)
- 7.8 France - Market size and forecast 2021-2026
- Exhibit 62: Chart on France - Market size and forecast 2021-2026 ($ million)
- Exhibit 63: Data Table on France - Market size and forecast 2021-2026 ($ million)
- Exhibit 64: Chart on France - Year-over-year growth 2021-2026 (%)
- Exhibit 65: Data Table on France - Year-over-year growth 2021-2026 (%)
- 7.9 China - Market size and forecast 2021-2026
- Exhibit 66: Chart on China - Market size and forecast 2021-2026 ($ million)
- Exhibit 67: Data Table on China - Market size and forecast 2021-2026 ($ million)
- Exhibit 68: Chart on China - Year-over-year growth 2021-2026 (%)
- Exhibit 69: Data Table on China - Year-over-year growth 2021-2026 (%)
- 7.10 Canada - Market size and forecast 2021-2026
- Exhibit 70: Chart on Canada - Market size and forecast 2021-2026 ($ million)
- Exhibit 71: Data Table on Canada - Market size and forecast 2021-2026 ($ million)
- Exhibit 72: Chart on Canada - Year-over-year growth 2021-2026 (%)
- Exhibit 73: Data Table on Canada - Year-over-year growth 2021-2026 (%)
- 7.11 India - Market size and forecast 2021-2026
- Exhibit 74: Chart on India - Market size and forecast 2021-2026 ($ million)
- Exhibit 75: Data Table on India - Market size and forecast 2021-2026 ($ million)
- Exhibit 76: Chart on India - Year-over-year growth 2021-2026 (%)
- Exhibit 77: Data Table on India - Year-over-year growth 2021-2026 (%)
- 7.12 Market opportunity By Geographical Landscape
- Exhibit 78: Market opportunity By Geographical Landscape ($ million)
8 Drivers, Challenges, and Trends
- 8.1 Market drivers
- 8.2 Market challenges
- 8.3 Impact of drivers and challenges
- Exhibit 79: Impact of drivers and challenges in 2021 and 2026
- 8.4 Market trends
9 Vendor Landscape
- 9.1 Overview
- 9.2 Vendor landscape
- Exhibit 80: Overview on Criticality of inputs and Factors of differentiation
- 9.3 Landscape disruption
- Exhibit 81: Overview on factors of disruption
- 9.4 Industry risks
- Exhibit 82: Impact of key risks on business
10 Vendor Analysis
- 10.1 Vendors covered
- Exhibit 83: Vendors covered
- 10.2 Market positioning of vendors
- Exhibit 84: Matrix on vendor position and classification
- 10.3 Andreas Fahl Medizintechnik Vertrieb GmbH
- Exhibit 85: Andreas Fahl Medizintechnik Vertrieb GmbH - Overview
- Exhibit 86: Andreas Fahl Medizintechnik Vertrieb GmbH - Product / Service
- Exhibit 87: Andreas Fahl Medizintechnik Vertrieb GmbH - Key offerings
- 10.4 Atos Medical AB
- Exhibit 88: Atos Medical AB - Overview
- Exhibit 89: Atos Medical AB - Business segments
- Exhibit 90: Atos Medical AB - Key offerings
- Exhibit 91: Atos Medical AB - Segment focus
- 10.5 ICU Medical Inc.
- Exhibit 92: ICU Medical Inc. - Overview
- Exhibit 93: ICU Medical Inc. - Product / Service
- Exhibit 94: ICU Medical Inc. - Key offerings
- 10.6 Johnson and Johnson
- Exhibit 95: Johnson and Johnson - Overview
- Exhibit 96: Johnson and Johnson - Business segments
- Exhibit 97: Johnson and Johnson - Key news
- Exhibit 98: Johnson and Johnson - Key offerings
- Exhibit 99: Johnson and Johnson - Segment focus
- 10.7 KARL STORZ SE and Co. KG
- Exhibit 100: KARL STORZ SE and Co. KG - Overview
- Exhibit 101: KARL STORZ SE and Co. KG - Product / Service
- Exhibit 102: KARL STORZ SE and Co. KG - Key news
- Exhibit 103: KARL STORZ SE and Co. KG - Key offerings
- 10.8 NOK Corp.
- Exhibit 104: NOK Corp. - Overview
- Exhibit 105: NOK Corp. - Business segments
- Exhibit 106: NOK Corp. - Key offerings
- Exhibit 107: NOK Corp. - Segment focus
- 10.9 Servona GmbH
- Exhibit 108: Servona GmbH - Overview
- Exhibit 109: Servona GmbH - Product / Service
- Exhibit 110: Servona GmbH - Key offerings
11 Appendix
- 11.1 Scope of the report
- 11.2 Inclusions and exclusions checklist
- Exhibit 111: Inclusions checklist
- Exhibit 112: Exclusions checklist
- 11.3 Currency conversion rates for US$
- Exhibit 113: Currency conversion rates for US$
- 11.4 Research methodology
- Exhibit 114: Research methodology
- Exhibit 115: Validation techniques employed for market sizing
- Exhibit 116: Information sources
- 11.5 List of abbreviations
- Exhibit 117: List of abbreviations
Exhibits
- Exhibits1: Executive Summary - Chart on Market Overview
- Exhibits2: Executive Summary - Data Table on Market Overview
- Exhibits3: Executive Summary - Chart on Global Market Characteristics
- Exhibits4: Executive Summary - Chart on Market By Geographical Landscape
- Exhibits5: Executive Summary - Chart on Market Segmentation by Product
- Exhibits6: Executive Summary - Chart on Incremental Growth
- Exhibits7: Executive Summary - Data Table on Incremental Growth
- Exhibits8: Executive Summary - Chart on Vendor Market Positioning
- Exhibits9: Parent market
- Exhibits10: Market Characteristics
- Exhibits11: Offerings of vendors included in the market definition
- Exhibits12: Market segments
- Exhibits13: Chart on Global - Market size and forecast 2021-2026 ($ million)
- Exhibits14: Data Table on Global - Market size and forecast 2021-2026 ($ million)
- Exhibits15: Chart on Global Market: Year-over-year growth 2021-2026 (%)
- Exhibits16: Data Table on Global Market: Year-over-year growth 2021-2026 (%)
- Exhibits17: Five forces analysis - Comparison between2021 and 2026
- Exhibits18: Chart on Bargaining power of buyers - Impact of key factors 2021 and 2026
- Exhibits19: Bargaining power of suppliers - Impact of key factors in 2021 and 2026
- Exhibits20: Threat of new entrants - Impact of key factors in 2021 and 2026
- Exhibits21: Threat of substitutes - Impact of key factors in 2021 and 2026
- Exhibits22: Threat of rivalry - Impact of key factors in 2021 and 2026
- Exhibits23: Chart on Market condition - Five forces 2021 and 2026
- Exhibits24: Chart on Product - Market share 2021-2026 (%)
- Exhibits25: Data Table on Product - Market share 2021-2026 (%)
- Exhibits26: Chart on Comparison by Product
- Exhibits27: Data Table on Comparison by Product
- Exhibits28: Chart on Indwelling voice prosthesis devices - Market size and forecast 2021-2026 ($ million)
- Exhibits29: Data Table on Indwelling voice prosthesis devices - Market size and forecast 2021-2026 ($ million)
- Exhibits30: Chart on Indwelling voice prosthesis devices - Year-over-year growth 2021-2026 (%)
- Exhibits31: Data Table on Indwelling voice prosthesis devices - Year-over-year growth 2021-2026 (%)
- Exhibits32: Chart on Non-indwelling voice prosthesis devices - Market size and forecast 2021-2026 ($ million)
- Exhibits33: Data Table on Non-indwelling voice prosthesis devices - Market size and forecast 2021-2026 ($ million)
- Exhibits34: Chart on Non-indwelling voice prosthesis devices - Year-over-year growth 2021-2026 (%)
- Exhibits35: Data Table on Non-indwelling voice prosthesis devices - Year-over-year growth 2021-2026 (%)
- Exhibits36: Market opportunity by Product ($ million)
- Exhibits37: Analysis of price sensitivity, lifecycle, customer purchase basket, adoption rates, and purchase criteria
- Exhibits38: Chart on Market share By Geographical Landscape 2021-2026 (%)
- Exhibits39: Data Table on Market share By Geographical Landscape 2021-2026 (%)
- Exhibits40: Chart on Geographic comparison
- Exhibits41: Data Table on Geographic comparison
- Exhibits42: Chart on North America - Market size and forecast 2021-2026 ($ million)
- Exhibits43: Data Table on North America - Market size and forecast 2021-2026 ($ million)
- Exhibits44: Chart on North America - Year-over-year growth 2021-2026 (%)
- Exhibits45: Data Table on North America - Year-over-year growth 2021-2026 (%)
- Exhibits46: Chart on Europe - Market size and forecast 2021-2026 ($ million)
- Exhibits47: Data Table on Europe - Market size and forecast 2021-2026 ($ million)
- Exhibits48: Chart on Europe - Year-over-year growth 2021-2026 (%)
- Exhibits49: Data Table on Europe - Year-over-year growth 2021-2026 (%)
- Exhibits50: Chart on Asia - Market size and forecast 2021-2026 ($ million)
- Exhibits51: Data Table on Asia - Market size and forecast 2021-2026 ($ million)
- Exhibits52: Chart on Asia - Year-over-year growth 2021-2026 (%)
- Exhibits53: Data Table on Asia - Year-over-year growth 2021-2026 (%)
- Exhibits54: Chart on Rest of World (ROW) - Market size and forecast 2021-2026 ($ million)
- Exhibits55: Data Table on Rest of World (ROW) - Market size and forecast 2021-2026 ($ million)
- Exhibits56: Chart on Rest of World (ROW) - Year-over-year growth 2021-2026 (%)
- Exhibits57: Data Table on Rest of World (ROW) - Year-over-year growth 2021-2026 (%)
- Exhibits58: Chart on US - Market size and forecast 2021-2026 ($ million)
- Exhibits59: Data Table on US - Market size and forecast 2021-2026 ($ million)
- Exhibits60: Chart on US - Year-over-year growth 2021-2026 (%)
- Exhibits61: Data Table on US - Year-over-year growth 2021-2026 (%)
- Exhibits62: Chart on France - Market size and forecast 2021-2026 ($ million)
- Exhibits63: Data Table on France - Market size and forecast 2021-2026 ($ million)
- Exhibits64: Chart on France - Year-over-year growth 2021-2026 (%)
- Exhibits65: Data Table on France - Year-over-year growth 2021-2026 (%)
- Exhibits66: Chart on China - Market size and forecast 2021-2026 ($ million)
- Exhibits67: Data Table on China - Market size and forecast 2021-2026 ($ million)
- Exhibits68: Chart on China - Year-over-year growth 2021-2026 (%)
- Exhibits69: Data Table on China - Year-over-year growth 2021-2026 (%)
- Exhibits70: Chart on Canada - Market size and forecast 2021-2026 ($ million)
- Exhibits71: Data Table on Canada - Market size and forecast 2021-2026 ($ million)
- Exhibits72: Chart on Canada - Year-over-year growth 2021-2026 (%)
- Exhibits73: Data Table on Canada - Year-over-year growth 2021-2026 (%)
- Exhibits74: Chart on India - Market size and forecast 2021-2026 ($ million)
- Exhibits75: Data Table on India - Market size and forecast 2021-2026 ($ million)
- Exhibits76: Chart on India - Year-over-year growth 2021-2026 (%)
- Exhibits77: Data Table on India - Year-over-year growth 2021-2026 (%)
- Exhibits78: Market opportunity By Geographical Landscape ($ million)
- Exhibits79: Impact of drivers and challenges in 2021 and 2026
- Exhibits80: Overview on Criticality of inputs and Factors of differentiation
- Exhibits81: Overview on factors of disruption
- Exhibits82: Impact of key risks on business
- Exhibits83: Vendors covered
- Exhibits84: Matrix on vendor position and classification
- Exhibits85: Andreas Fahl Medizintechnik Vertrieb GmbH - Overview
- Exhibits86: Andreas Fahl Medizintechnik Vertrieb GmbH - Product / Service
- Exhibits87: Andreas Fahl Medizintechnik Vertrieb GmbH - Key offerings
- Exhibits88: Atos Medical AB - Overview
- Exhibits89: Atos Medical AB - Business segments
- Exhibits90: Atos Medical AB - Key offerings
- Exhibits91: Atos Medical AB - Segment focus
- Exhibits92: ICU Medical Inc. - Overview
- Exhibits93: ICU Medical Inc. - Product / Service
- Exhibits94: ICU Medical Inc. - Key offerings
- Exhibits95: Johnson and Johnson - Overview
- Exhibits96: Johnson and Johnson - Business segments
- Exhibits97: Johnson and Johnson - Key news
- Exhibits98: Johnson and Johnson - Key offerings
- Exhibits99: Johnson and Johnson - Segment focus
- Exhibits100: KARL STORZ SE and Co. KG - Overview
- Exhibits101: KARL STORZ SE and Co. KG - Product / Service
- Exhibits102: KARL STORZ SE and Co. KG - Key news
- Exhibits103: KARL STORZ SE and Co. KG - Key offerings
- Exhibits104: NOK Corp. - Overview
- Exhibits105: NOK Corp. - Business segments
- Exhibits106: NOK Corp. - Key offerings
- Exhibits107: NOK Corp. - Segment focus
- Exhibits108: Servona GmbH - Overview
- Exhibits109: Servona GmbH - Product / Service
- Exhibits110: Servona GmbH - Key offerings
- Exhibits111: Inclusions checklist
- Exhibits112: Exclusions checklist
- Exhibits113: Currency conversion rates for US$
- Exhibits114: Research methodology
- Exhibits115: Validation techniques employed for market sizing
- Exhibits116: Information sources
- Exhibits117: List of abbreviations