|
|
市場調査レポート
商品コード
1161467
企業向けブレンデッドラーニングの世界市場 2023-2027Global Corporate Blended Learning Market 2023-2027 |
||||||
|
|
|||||||
|
● お客様のご希望に応じて、既存データの加工や未掲載情報(例:国別セグメント)の追加などの対応が可能です。 詳細はお問い合わせください。 |
|||||||


| 企業向けブレンデッドラーニングの世界市場 2023-2027 |
|
出版日: 2022年11月17日
発行: TechNavio
ページ情報: 英文 120 Pages
納期: 即納可能
|
- 全表示
- 概要
- 図表
- 目次
当レポートでは企業向けブレンデッドラーニングの市場規模は、2023年から2027年の間に362億8,486万米ドルの増加が見込まれ、予測期間中に12.68%のCAGRで成長すると予測しています。当レポートでは、企業向けブレンデッドラーニング市場の全体分析、市場規模・予測、動向、成長促進要因・課題、約25社のベンダーを網羅したベンダー分析などをお届けします。
また、現在の世界の市場動向と促進要因、市場全体の環境に関する最新の分析も提供しています。
この市場は、マイクロラーニングの導入の増加、企業教育領域での視覚技術の採用の増加、プロセスのデジタル化の増強によって牽引されています。
本調査では、企業研修におけるアイトラッキングの活用が、今後数年間の企業向けブレンデッドラーニング市場の成長を促進する主要な理由の1つであると位置付けています。また、ソーシャルラーニングの重視や企業研修でのAI活用の高まりは、同市場の大きな需要につながると考えられます。
目次
第1章 エグゼクティブサマリー
- 市場概要
第2章 市場情勢
- 市場エコシステム
第3章 市場規模
- 市場の定義
- 市場セグメント分析
- 市場規模 2022
- 市場の見通し:2022-2027年の予測
第4章 市場規模実績
- 世界の企業向けブレンデッドラーニング市場2017-2021
- タイプセグメント分析2017-2021
- 流通チャネルセグメント分析2017-2021
- 地域セグメント分析2017-2021
- 国セグメント分析2017-2021
第5章 ファイブフォース分析
- ファイブフォースの要約
- 買い手の交渉力
- 供給企業の交渉力
- 新規参入業者の脅威
- 代替品の脅威
- 競争の脅威
- 市況
第6章 タイプ別の市場セグメンテーション
- 市場内訳
- タイプ別比較
- システム - 市場規模と予測 2022-2027
- コンテンツ - 市場規模と予測 2022-2027
- コース - 市場規模と予測 2022-2027
- ソリューション - 市場規模と予測 2022-2027
- タイプ別の市場機会
第7章 エンドユーザー別市場セグメンテーション
- 市場内訳
- エンドユーザー別比較
- 自動車産業 - 市場規模と予測 2022-2027
- BFSIセクター - 市場規模と予測 2022-2027
- 消費財業界 - 市場規模と予測 2022-2027
- エネルギー産業 - 市場規模と予測 2022-2027
- その他 - 市場規模と予測 2022-2027
- エンドユーザー別の市場機会
第8章 顧客情勢
- 顧客情勢の概要
第9章 地域別情勢
- 地域別セグメンテーション
- 地域別比較
- 北米 - 市場規模と予測 2022-2027
- 欧州 - 市場規模と予測 2022-2027
- APAC - 市場規模と予測 2022-2027
- 南米 - 市場規模と予測 2022-2027
- 中東およびアフリカ - 市場規模と予測 2022-2027
- 米国 - 市場規模と予測 2022-2027
- ドイツ - 市場規模と予測 2022-2027
- 中国 - 市場規模と予測 2022-2027
- 英国 - 市場規模と予測 2022-2027
- 日本 - 市場規模と予測 2022-2027
- 地域情勢別の市場機会
第10章 促進要因、課題、および動向
- 市場促進要因
- 市場の課題
- 促進要因と課題の影響
- 市場動向
第11章 ベンダー情勢
- 概要
- ベンダー情勢
- 混乱の状況
- 業界のリスク
第12章 ベンダー分析
- 対象ベンダー
- ベンダーの市場ポジショニング
- Allen Communication Learning Services
- Blanchard Training and Development Inc.
- Cegos Group
- Computer Generated Solutions Inc.
- D2L Corp.
- Development Dimensions International Inc.
- Franklin Covey Co.
- GBS Corporate Training Ltd.
- Global Training Solutions Inc.
- GP Strategies Corp.
- Interaction Associates Inc.
- Korn Ferry
- Learning Technologies Group Plc
- Raytheon Technologies Corp.
- Wilson Learning Worldwide Inc.
第13章 付録
Exhibits:
- Exhibits1: Executive Summary - Chart on Market Overview
- Exhibits2: Executive Summary - Data Table on Market Overview
- Exhibits3: Executive Summary - Chart on Global Market Characteristics
- Exhibits4: Executive Summary - Chart on Market By Geographical Landscape
- Exhibits5: Executive Summary - Chart on Market Segmentation by Type
- Exhibits6: Executive Summary - Chart on Market Segmentation by End-user
- Exhibits7: Executive Summary - Chart on Incremental Growth
- Exhibits8: Executive Summary - Data Table on Incremental Growth
- Exhibits9: Executive Summary - Chart on Vendor Market Positioning
- Exhibits10: Parent market
- Exhibits11: Market Characteristics
- Exhibits12: Offerings of vendors included in the market definition
- Exhibits13: Market segments
- Exhibits14: Chart on Global - Market size and forecast 2022-2027 ($ million)
- Exhibits15: Data Table on Global - Market size and forecast 2022-2027 ($ million)
- Exhibits16: Chart on Global Market: Year-over-year growth 2022-2027 (%)
- Exhibits17: Data Table on Global Market: Year-over-year growth 2022-2027 (%)
- Exhibits18: Historic Market Size - Data Table on Global corporate blended learning market 2017 - 2021 ($ million)
- Exhibits19: Historic Market Size - Type Segment 2017 - 2021 ($ million)
- Exhibits20: Historic Market Size - Distribution channel Segment 2017 - 2021 ($ million)
- Exhibits21: Historic Market Size - Geography Segment 2017 - 2021 ($ million)
- Exhibits22: Historic Market Size - Country Segment 2017 - 2021 ($ million)
- Exhibits23: Five forces analysis - Comparison between 2022 and 2027
- Exhibits24: Chart on Bargaining power of buyers - Impact of key factors 2022 and 2027
- Exhibits25: Bargaining power of suppliers - Impact of key factors in 2022 and 2027
- Exhibits26: Threat of new entrants - Impact of key factors in 2022 and 2027
- Exhibits27: Threat of substitutes - Impact of key factors in 2022 and 2027
- Exhibits28: Threat of rivalry - Impact of key factors in 2022 and 2027
- Exhibits29: Chart on Market condition - Five forces 2022 and 2027
- Exhibits30: Chart on Type - Market share 2022-2027 (%)
- Exhibits31: Data Table on Type - Market share 2022-2027 (%)
- Exhibits32: Chart on Comparison by Type
- Exhibits33: Data Table on Comparison by Type
- Exhibits34: Chart on Systems - Market size and forecast 2022-2027 ($ million)
- Exhibits35: Data Table on Systems - Market size and forecast 2022-2027 ($ million)
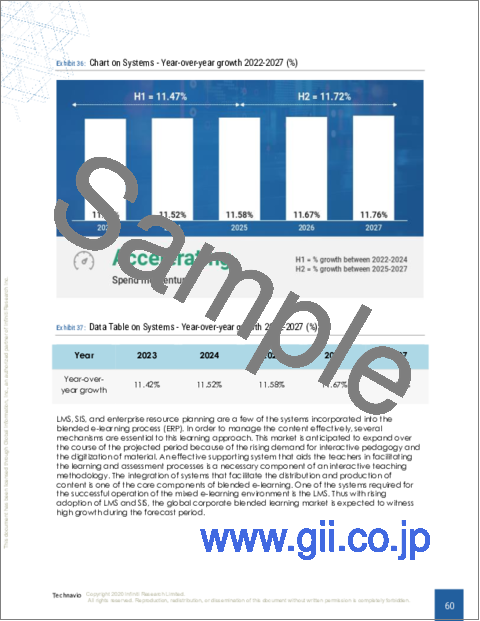
- Exhibits36: Chart on Systems - Year-over-year growth 2022-2027 (%)
- Exhibits37: Data Table on Systems - Year-over-year growth 2022-2027 (%)
- Exhibits38: Chart on Content - Market size and forecast 2022-2027 ($ million)
- Exhibits39: Data Table on Content - Market size and forecast 2022-2027 ($ million)
- Exhibits40: Chart on Content - Year-over-year growth 2022-2027 (%)
- Exhibits41: Data Table on Content - Year-over-year growth 2022-2027 (%)
- Exhibits42: Chart on Courses - Market size and forecast 2022-2027 ($ million)
- Exhibits43: Data Table on Courses - Market size and forecast 2022-2027 ($ million)
- Exhibits44: Chart on Courses - Year-over-year growth 2022-2027 (%)
- Exhibits45: Data Table on Courses - Year-over-year growth 2022-2027 (%)
- Exhibits46: Chart on Solutions - Market size and forecast 2022-2027 ($ million)
- Exhibits47: Data Table on Solutions - Market size and forecast 2022-2027 ($ million)
- Exhibits48: Chart on Solutions - Year-over-year growth 2022-2027 (%)
- Exhibits49: Data Table on Solutions - Year-over-year growth 2022-2027 (%)
- Exhibits50: Market opportunity by Type ($ million)
- Exhibits51: Chart on End-user - Market share 2022-2027 (%)
- Exhibits52: Data Table on End-user - Market share 2022-2027 (%)
- Exhibits53: Chart on Comparison by End-user
- Exhibits54: Data Table on Comparison by End-user
- Exhibits55: Chart on Automotive industry - Market size and forecast 2022-2027 ($ million)
- Exhibits56: Data Table on Automotive industry - Market size and forecast 2022-2027 ($ million)
- Exhibits57: Chart on Automotive industry - Year-over-year growth 2022-2027 (%)
- Exhibits58: Data Table on Automotive industry - Year-over-year growth 2022-2027 (%)
- Exhibits59: Chart on BFSI sector - Market size and forecast 2022-2027 ($ million)
- Exhibits60: Data Table on BFSI sector - Market size and forecast 2022-2027 ($ million)
- Exhibits61: Chart on BFSI sector - Year-over-year growth 2022-2027 (%)
- Exhibits62: Data Table on BFSI sector - Year-over-year growth 2022-2027 (%)
- Exhibits63: Chart on Consumer goods industry - Market size and forecast 2022-2027 ($ million)
- Exhibits64: Data Table on Consumer goods industry - Market size and forecast 2022-2027 ($ million)
- Exhibits65: Chart on Consumer goods industry - Year-over-year growth 2022-2027 (%)
- Exhibits66: Data Table on Consumer goods industry - Year-over-year growth 2022-2027 (%)
- Exhibits67: Chart on Energy industry - Market size and forecast 2022-2027 ($ million)
- Exhibits68: Data Table on Energy industry - Market size and forecast 2022-2027 ($ million)
- Exhibits69: Chart on Energy industry - Year-over-year growth 2022-2027 (%)
- Exhibits70: Data Table on Energy industry - Year-over-year growth 2022-2027 (%)
- Exhibits71: Chart on Others - Market size and forecast 2022-2027 ($ million)
- Exhibits72: Data Table on Others - Market size and forecast 2022-2027 ($ million)
- Exhibits73: Chart on Others - Year-over-year growth 2022-2027 (%)
- Exhibits74: Data Table on Others - Year-over-year growth 2022-2027 (%)
- Exhibits75: Market opportunity by End-user ($ million)
- Exhibits76: Analysis of price sensitivity, lifecycle, customer purchase basket, adoption rates, and purchase criteria
- Exhibits77: Chart on Market share By Geographical Landscape 2022-2027 (%)
- Exhibits78: Data Table on Market share By Geographical Landscape 2022-2027 (%)
- Exhibits79: Chart on Geographic comparison
- Exhibits80: Data Table on Geographic comparison
- Exhibits81: Chart on North America - Market size and forecast 2022-2027 ($ million)
- Exhibits82: Data Table on North America - Market size and forecast 2022-2027 ($ million)
- Exhibits83: Chart on North America - Year-over-year growth 2022-2027 (%)
- Exhibits84: Data Table on North America - Year-over-year growth 2022-2027 (%)
- Exhibits85: Chart on Europe - Market size and forecast 2022-2027 ($ million)
- Exhibits86: Data Table on Europe - Market size and forecast 2022-2027 ($ million)
- Exhibits87: Chart on Europe - Year-over-year growth 2022-2027 (%)
- Exhibits88: Data Table on Europe - Year-over-year growth 2022-2027 (%)
- Exhibits89: Chart on APAC - Market size and forecast 2022-2027 ($ million)
- Exhibits90: Data Table on APAC - Market size and forecast 2022-2027 ($ million)
- Exhibits91: Chart on APAC - Year-over-year growth 2022-2027 (%)
- Exhibits92: Data Table on APAC - Year-over-year growth 2022-2027 (%)
- Exhibits93: Chart on South America - Market size and forecast 2022-2027 ($ million)
- Exhibits94: Data Table on South America - Market size and forecast 2022-2027 ($ million)
- Exhibits95: Chart on South America - Year-over-year growth 2022-2027 (%)
- Exhibits96: Data Table on South America - Year-over-year growth 2022-2027 (%)
- Exhibits97: Chart on Middle East and Africa - Market size and forecast 2022-2027 ($ million)
- Exhibits98: Data Table on Middle East and Africa - Market size and forecast 2022-2027 ($ million)
- Exhibits99: Chart on Middle East and Africa - Year-over-year growth 2022-2027 (%)
- Exhibits100: Data Table on Middle East and Africa - Year-over-year growth 2022-2027 (%)
- Exhibits101: Chart on US - Market size and forecast 2022-2027 ($ million)
- Exhibits102: Data Table on US - Market size and forecast 2022-2027 ($ million)
- Exhibits103: Chart on US - Year-over-year growth 2022-2027 (%)
- Exhibits104: Data Table on US - Year-over-year growth 2022-2027 (%)
- Exhibits105: Chart on Germany - Market size and forecast 2022-2027 ($ million)
- Exhibits106: Data Table on Germany - Market size and forecast 2022-2027 ($ million)
- Exhibits107: Chart on Germany - Year-over-year growth 2022-2027 (%)
- Exhibits108: Data Table on Germany - Year-over-year growth 2022-2027 (%)
- Exhibits109: Chart on China - Market size and forecast 2022-2027 ($ million)
- Exhibits110: Data Table on China - Market size and forecast 2022-2027 ($ million)
- Exhibits111: Chart on China - Year-over-year growth 2022-2027 (%)
- Exhibits112: Data Table on China - Year-over-year growth 2022-2027 (%)
- Exhibits113: Chart on UK - Market size and forecast 2022-2027 ($ million)
- Exhibits114: Data Table on UK - Market size and forecast 2022-2027 ($ million)
- Exhibits115: Chart on UK - Year-over-year growth 2022-2027 (%)
- Exhibits116: Data Table on UK - Year-over-year growth 2022-2027 (%)
- Exhibits117: Chart on Japan - Market size and forecast 2022-2027 ($ million)
- Exhibits118: Data Table on Japan - Market size and forecast 2022-2027 ($ million)
- Exhibits119: Chart on Japan - Year-over-year growth 2022-2027 (%)
- Exhibits120: Data Table on Japan - Year-over-year growth 2022-2027 (%)
- Exhibits121: Market opportunity By Geographical Landscape ($ million)
- Exhibits122: Impact of drivers and challenges in 2022 and 2027
- Exhibits123: Overview on Criticality of inputs and Factors of differentiation
- Exhibits124: Overview on factors of disruption
- Exhibits125: Impact of key risks on business
- Exhibits126: Vendors covered
- Exhibits127: Matrix on vendor position and classification
- Exhibits128: Allen Communication Learning Services - Overview
- Exhibits129: Allen Communication Learning Services - Product / Service
- Exhibits130: Allen Communication Learning Services - Key offerings
- Exhibits131: Blanchard Training and Development Inc. - Overview
- Exhibits132: Blanchard Training and Development Inc. - Product / Service
- Exhibits133: Blanchard Training and Development Inc. - Key offerings
- Exhibits134: Cegos Group - Overview
- Exhibits135: Cegos Group - Product / Service
- Exhibits136: Cegos Group - Key offerings
- Exhibits137: Computer Generated Solutions Inc. - Overview
- Exhibits138: Computer Generated Solutions Inc. - Product / Service
- Exhibits139: Computer Generated Solutions Inc. - Key offerings
- Exhibits140: D2L Corp. - Overview
- Exhibits141: D2L Corp. - Product / Service
- Exhibits142: D2L Corp. - Key news
- Exhibits143: D2L Corp. - Key offerings
- Exhibits144: Development Dimensions International Inc. - Overview
- Exhibits145: Development Dimensions International Inc. - Product / Service
- Exhibits146: Development Dimensions International Inc. - Key offerings
- Exhibits147: Franklin Covey Co. - Overview
- Exhibits148: Franklin Covey Co. - Business segments
- Exhibits149: Franklin Covey Co. - Key offerings
- Exhibits150: Franklin Covey Co. - Segment focus
- Exhibits151: GBS Corporate Training Ltd. - Overview
- Exhibits152: GBS Corporate Training Ltd. - Product / Service
- Exhibits153: GBS Corporate Training Ltd. - Key offerings
- Exhibits154: Global Training Solutions Inc. - Overview
- Exhibits155: Global Training Solutions Inc. - Product / Service
- Exhibits156: Global Training Solutions Inc. - Key offerings
- Exhibits157: GP Strategies Corp. - Overview
- Exhibits158: GP Strategies Corp. - Business segments
- Exhibits159: GP Strategies Corp. - Key news
- Exhibits160: GP Strategies Corp. - Key offerings
- Exhibits161: GP Strategies Corp. - Segment focus
- Exhibits162: Interaction Associates Inc. - Overview
- Exhibits163: Interaction Associates Inc. - Product / Service
- Exhibits164: Interaction Associates Inc. - Key offerings
- Exhibits165: Korn Ferry - Overview
- Exhibits166: Korn Ferry - Business segments
- Exhibits167: Korn Ferry - Key offerings
- Exhibits168: Korn Ferry - Segment focus
- Exhibits169: Learning Technologies Group Plc - Overview
- Exhibits170: Learning Technologies Group Plc - Business segments
- Exhibits171: Learning Technologies Group Plc - Key news
- Exhibits172: Learning Technologies Group Plc - Key offerings
- Exhibits173: Learning Technologies Group Plc - Segment focus
- Exhibits174: Raytheon Technologies Corp. - Overview
- Exhibits175: Raytheon Technologies Corp. - Business segments
- Exhibits176: Raytheon Technologies Corp. - Key offerings
- Exhibits177: Raytheon Technologies Corp. - Segment focus
- Exhibits178: Wilson Learning Worldwide Inc. - Overview
- Exhibits179: Wilson Learning Worldwide Inc. - Business segments
- Exhibits180: Wilson Learning Worldwide Inc. - Key offerings
- Exhibits181: Wilson Learning Worldwide Inc. - Segment focus
- Exhibits182: Inclusions checklist
- Exhibits183: Exclusions checklist
- Exhibits184: Currency conversion rates for US$
- Exhibits185: Research methodology
- Exhibits186: Validation techniques employed for market sizing
- Exhibits187: Information sources
- Exhibits188: List of abbreviations
Technavio has been monitoring the corporate blended learning market and it is poised to grow by $36284.86 mn during 2023-2027, accelerating at a CAGR of 12.68% during the forecast period. Our report on the corporate blended learning market provides a holistic analysis, market size and forecast, trends, growth drivers, and challenges, as well as vendor analysis covering around 25 vendors.
The report offers an up-to-date analysis regarding the current global market scenario, the latest trends and drivers, and the overall market environment. The market is driven by the rising incorporation of microlearning, increased adoption of visual technologies for corporate education domain, and augmented digitization of processes.
Technavio's corporate blended learning market is segmented as below:
By Type
- Systems
- Content
- Courses
- Solutions
By End-user
- Automotive industry
- BFSI sector
- Consumer goods industry
- Energy industry
- Others
By Geographical Landscape
- North America
- Europe
- APAC
- South America
- Middle East and Africa
This study identifies the application of eye-tracking in corporate training as one of the prime reasons driving the corporate blended learning market growth during the next few years. Also, increasing emphasis on social learning and the rising use of AI in corporate training will lead to sizable demand in the market.
- Corporate blended learning market sizing
- Corporate blended learning market forecast
- Corporate blended learning market industry analysis
Technavio's robust vendor analysis is designed to help clients improve their market position, and in line with this, this report provides a detailed analysis of several leading corporate blended learning market vendors that include Allen Communication Learning Services, Blanchard Training and Development Inc., BTS Group AB, Cegos Group, City and Guilds Group, Computer Generated Solutions Inc., D2L Corp., Development Dimensions International Inc., Franklin Covey Co., GBS Corporate Training Ltd., Global Training Solutions Inc., GP Strategies Corp., Interaction Associates Inc., Korn Ferry, Learning Technologies Group Plc, Mind Gym Plc, Paylocity Holding Corp., QA group of companies, Raytheon Technologies Corp., and Wilson Learning Worldwide Inc. Also, the corporate blended learning market analysis report includes information on upcoming trends and challenges that will influence market growth. This is to help companies strategize and leverage all forthcoming growth opportunities.
The study was conducted using an objective combination of primary and secondary information including inputs from key participants in the industry. The report contains a comprehensive market and vendor landscape in addition to an analysis of the key vendors.
Table of Contents
1 Executive Summary
- 1.1 Market overview
- Exhibit 01: Executive Summary - Chart on Market Overview
- Exhibit 02: Executive Summary - Data Table on Market Overview
- Exhibit 03: Executive Summary - Chart on Global Market Characteristics
- Exhibit 04: Executive Summary - Chart on Market By Geographical Landscape
- Exhibit 05: Executive Summary - Chart on Market Segmentation by Type
- Exhibit 06: Executive Summary - Chart on Market Segmentation by End-user
- Exhibit 07: Executive Summary - Chart on Incremental Growth
- Exhibit 08: Executive Summary - Data Table on Incremental Growth
- Exhibit 09: Executive Summary - Chart on Vendor Market Positioning
2 Market Landscape
- 2.1 Market ecosystem
- Exhibit 10: Parent market
- Exhibit 11: Market Characteristics
3 Market Sizing
- 3.1 Market definition
- Exhibit 12: Offerings of vendors included in the market definition
- 3.2 Market segment analysis
- Exhibit 13: Market segments
- 3.3 Market size 2022
- 3.4 Market outlook: Forecast for 2022-2027
- Exhibit 14: Chart on Global - Market size and forecast 2022-2027 ($ million)
- Exhibit 15: Data Table on Global - Market size and forecast 2022-2027 ($ million)
- Exhibit 16: Chart on Global Market: Year-over-year growth 2022-2027 (%)
- Exhibit 17: Data Table on Global Market: Year-over-year growth 2022-2027 (%)
4 Historic Market Size
- 4.1 Global corporate blended learning market 2017 - 2021
- Exhibit 18: Historic Market Size - Data Table on Global corporate blended learning market 2017 - 2021 ($ million)
- 4.2 Type Segment Analysis 2017 - 2021
- Exhibit 19: Historic Market Size - Type Segment 2017 - 2021 ($ million)
- 4.3 Distribution channel Segment Analysis 2017 - 2021
- Exhibit 20: Historic Market Size - Distribution channel Segment 2017 - 2021 ($ million)
- 4.4 Geography Segment Analysis 2017 - 2021
- Exhibit 21: Historic Market Size - Geography Segment 2017 - 2021 ($ million)
- 4.5 Country Segment Analysis 2017 - 2021
- Exhibit 22: Historic Market Size - Country Segment 2017 - 2021 ($ million)
5 Five Forces Analysis
- 5.1 Five forces summary
- Exhibit 23: Five forces analysis - Comparison between 2022 and 2027
- 5.2 Bargaining power of buyers
- Exhibit 24: Chart on Bargaining power of buyers - Impact of key factors 2022 and 2027
- 5.3 Bargaining power of suppliers
- Exhibit 25: Bargaining power of suppliers - Impact of key factors in 2022 and 2027
- 5.4 Threat of new entrants
- Exhibit 26: Threat of new entrants - Impact of key factors in 2022 and 2027
- 5.5 Threat of substitutes
- Exhibit 27: Threat of substitutes - Impact of key factors in 2022 and 2027
- 5.6 Threat of rivalry
- Exhibit 28: Threat of rivalry - Impact of key factors in 2022 and 2027
- 5.7 Market condition
- Exhibit 29: Chart on Market condition - Five forces 2022 and 2027
6 Market Segmentation by Type
- 6.1 Market segments
- Exhibit 30: Chart on Type - Market share 2022-2027 (%)
- Exhibit 31: Data Table on Type - Market share 2022-2027 (%)
- 6.2 Comparison by Type
- Exhibit 32: Chart on Comparison by Type
- Exhibit 33: Data Table on Comparison by Type
- 6.3 Systems - Market size and forecast 2022-2027
- Exhibit 34: Chart on Systems - Market size and forecast 2022-2027 ($ million)
- Exhibit 35: Data Table on Systems - Market size and forecast 2022-2027 ($ million)
- Exhibit 36: Chart on Systems - Year-over-year growth 2022-2027 (%)
- Exhibit 37: Data Table on Systems - Year-over-year growth 2022-2027 (%)
- 6.4 Content - Market size and forecast 2022-2027
- Exhibit 38: Chart on Content - Market size and forecast 2022-2027 ($ million)
- Exhibit 39: Data Table on Content - Market size and forecast 2022-2027 ($ million)
- Exhibit 40: Chart on Content - Year-over-year growth 2022-2027 (%)
- Exhibit 41: Data Table on Content - Year-over-year growth 2022-2027 (%)
- 6.5 Courses - Market size and forecast 2022-2027
- Exhibit 42: Chart on Courses - Market size and forecast 2022-2027 ($ million)
- Exhibit 43: Data Table on Courses - Market size and forecast 2022-2027 ($ million)
- Exhibit 44: Chart on Courses - Year-over-year growth 2022-2027 (%)
- Exhibit 45: Data Table on Courses - Year-over-year growth 2022-2027 (%)
- 6.6 Solutions - Market size and forecast 2022-2027
- Exhibit 46: Chart on Solutions - Market size and forecast 2022-2027 ($ million)
- Exhibit 47: Data Table on Solutions - Market size and forecast 2022-2027 ($ million)
- Exhibit 48: Chart on Solutions - Year-over-year growth 2022-2027 (%)
- Exhibit 49: Data Table on Solutions - Year-over-year growth 2022-2027 (%)
- 6.7 Market opportunity by Type
- Exhibit 50: Market opportunity by Type ($ million)
7 Market Segmentation by End-user
- 7.1 Market segments
- Exhibit 51: Chart on End-user - Market share 2022-2027 (%)
- Exhibit 52: Data Table on End-user - Market share 2022-2027 (%)
- 7.2 Comparison by End-user
- Exhibit 53: Chart on Comparison by End-user
- Exhibit 54: Data Table on Comparison by End-user
- 7.3 Automotive industry - Market size and forecast 2022-2027
- Exhibit 55: Chart on Automotive industry - Market size and forecast 2022-2027 ($ million)
- Exhibit 56: Data Table on Automotive industry - Market size and forecast 2022-2027 ($ million)
- Exhibit 57: Chart on Automotive industry - Year-over-year growth 2022-2027 (%)
- Exhibit 58: Data Table on Automotive industry - Year-over-year growth 2022-2027 (%)
- 7.4 BFSI sector - Market size and forecast 2022-2027
- Exhibit 59: Chart on BFSI sector - Market size and forecast 2022-2027 ($ million)
- Exhibit 60: Data Table on BFSI sector - Market size and forecast 2022-2027 ($ million)
- Exhibit 61: Chart on BFSI sector - Year-over-year growth 2022-2027 (%)
- Exhibit 62: Data Table on BFSI sector - Year-over-year growth 2022-2027 (%)
- 7.5 Consumer goods industry - Market size and forecast 2022-2027
- Exhibit 63: Chart on Consumer goods industry - Market size and forecast 2022-2027 ($ million)
- Exhibit 64: Data Table on Consumer goods industry - Market size and forecast 2022-2027 ($ million)
- Exhibit 65: Chart on Consumer goods industry - Year-over-year growth 2022-2027 (%)
- Exhibit 66: Data Table on Consumer goods industry - Year-over-year growth 2022-2027 (%)
- 7.6 Energy industry - Market size and forecast 2022-2027
- Exhibit 67: Chart on Energy industry - Market size and forecast 2022-2027 ($ million)
- Exhibit 68: Data Table on Energy industry - Market size and forecast 2022-2027 ($ million)
- Exhibit 69: Chart on Energy industry - Year-over-year growth 2022-2027 (%)
- Exhibit 70: Data Table on Energy industry - Year-over-year growth 2022-2027 (%)
- 7.7 Others - Market size and forecast 2022-2027
- Exhibit 71: Chart on Others - Market size and forecast 2022-2027 ($ million)
- Exhibit 72: Data Table on Others - Market size and forecast 2022-2027 ($ million)
- Exhibit 73: Chart on Others - Year-over-year growth 2022-2027 (%)
- Exhibit 74: Data Table on Others - Year-over-year growth 2022-2027 (%)
- 7.8 Market opportunity by End-user
- Exhibit 75: Market opportunity by End-user ($ million)
8 Customer Landscape
- 8.1 Customer landscape overview
- Exhibit 76: Analysis of price sensitivity, lifecycle, customer purchase basket, adoption rates, and purchase criteria
9 Geographic Landscape
- 9.1 Geographic segmentation
- Exhibit 77: Chart on Market share By Geographical Landscape 2022-2027 (%)
- Exhibit 78: Data Table on Market share By Geographical Landscape 2022-2027 (%)
- 9.2 Geographic comparison
- Exhibit 79: Chart on Geographic comparison
- Exhibit 80: Data Table on Geographic comparison
- 9.3 North America - Market size and forecast 2022-2027
- Exhibit 81: Chart on North America - Market size and forecast 2022-2027 ($ million)
- Exhibit 82: Data Table on North America - Market size and forecast 2022-2027 ($ million)
- Exhibit 83: Chart on North America - Year-over-year growth 2022-2027 (%)
- Exhibit 84: Data Table on North America - Year-over-year growth 2022-2027 (%)
- 9.4 Europe - Market size and forecast 2022-2027
- Exhibit 85: Chart on Europe - Market size and forecast 2022-2027 ($ million)
- Exhibit 86: Data Table on Europe - Market size and forecast 2022-2027 ($ million)
- Exhibit 87: Chart on Europe - Year-over-year growth 2022-2027 (%)
- Exhibit 88: Data Table on Europe - Year-over-year growth 2022-2027 (%)
- 9.5 APAC - Market size and forecast 2022-2027
- Exhibit 89: Chart on APAC - Market size and forecast 2022-2027 ($ million)
- Exhibit 90: Data Table on APAC - Market size and forecast 2022-2027 ($ million)
- Exhibit 91: Chart on APAC - Year-over-year growth 2022-2027 (%)
- Exhibit 92: Data Table on APAC - Year-over-year growth 2022-2027 (%)
- 9.6 South America - Market size and forecast 2022-2027
- Exhibit 93: Chart on South America - Market size and forecast 2022-2027 ($ million)
- Exhibit 94: Data Table on South America - Market size and forecast 2022-2027 ($ million)
- Exhibit 95: Chart on South America - Year-over-year growth 2022-2027 (%)
- Exhibit 96: Data Table on South America - Year-over-year growth 2022-2027 (%)
- 9.7 Middle East and Africa - Market size and forecast 2022-2027
- Exhibit 97: Chart on Middle East and Africa - Market size and forecast 2022-2027 ($ million)
- Exhibit 98: Data Table on Middle East and Africa - Market size and forecast 2022-2027 ($ million)
- Exhibit 99: Chart on Middle East and Africa - Year-over-year growth 2022-2027 (%)
- Exhibit 100: Data Table on Middle East and Africa - Year-over-year growth 2022-2027 (%)
- 9.8 US - Market size and forecast 2022-2027
- Exhibit 101: Chart on US - Market size and forecast 2022-2027 ($ million)
- Exhibit 102: Data Table on US - Market size and forecast 2022-2027 ($ million)
- Exhibit 103: Chart on US - Year-over-year growth 2022-2027 (%)
- Exhibit 104: Data Table on US - Year-over-year growth 2022-2027 (%)
- 9.9 Germany - Market size and forecast 2022-2027
- Exhibit 105: Chart on Germany - Market size and forecast 2022-2027 ($ million)
- Exhibit 106: Data Table on Germany - Market size and forecast 2022-2027 ($ million)
- Exhibit 107: Chart on Germany - Year-over-year growth 2022-2027 (%)
- Exhibit 108: Data Table on Germany - Year-over-year growth 2022-2027 (%)
- 9.10 China - Market size and forecast 2022-2027
- Exhibit 109: Chart on China - Market size and forecast 2022-2027 ($ million)
- Exhibit 110: Data Table on China - Market size and forecast 2022-2027 ($ million)
- Exhibit 111: Chart on China - Year-over-year growth 2022-2027 (%)
- Exhibit 112: Data Table on China - Year-over-year growth 2022-2027 (%)
- 9.11 UK - Market size and forecast 2022-2027
- Exhibit 113: Chart on UK - Market size and forecast 2022-2027 ($ million)
- Exhibit 114: Data Table on UK - Market size and forecast 2022-2027 ($ million)
- Exhibit 115: Chart on UK - Year-over-year growth 2022-2027 (%)
- Exhibit 116: Data Table on UK - Year-over-year growth 2022-2027 (%)
- 9.12 Japan - Market size and forecast 2022-2027
- Exhibit 117: Chart on Japan - Market size and forecast 2022-2027 ($ million)
- Exhibit 118: Data Table on Japan - Market size and forecast 2022-2027 ($ million)
- Exhibit 119: Chart on Japan - Year-over-year growth 2022-2027 (%)
- Exhibit 120: Data Table on Japan - Year-over-year growth 2022-2027 (%)
- 9.13 Market opportunity By Geographical Landscape
- Exhibit 121: Market opportunity By Geographical Landscape ($ million)
10 Drivers, Challenges, and Trends
- 10.1 Market drivers
- 10.2 Market challenges
- 10.3 Impact of drivers and challenges
- Exhibit 122: Impact of drivers and challenges in 2022 and 2027
- 10.4 Market trends
11 Vendor Landscape
- 11.1 Overview
- 11.2 Vendor landscape
- Exhibit 123: Overview on Criticality of inputs and Factors of differentiation
- 11.3 Landscape disruption
- Exhibit 124: Overview on factors of disruption
- 11.4 Industry risks
- Exhibit 125: Impact of key risks on business
12 Vendor Analysis
- 12.1 Vendors covered
- Exhibit 126: Vendors covered
- 12.2 Market positioning of vendors
- Exhibit 127: Matrix on vendor position and classification
- 12.3 Allen Communication Learning Services
- Exhibit 128: Allen Communication Learning Services - Overview
- Exhibit 129: Allen Communication Learning Services - Product / Service
- Exhibit 130: Allen Communication Learning Services - Key offerings
- 12.4 Blanchard Training and Development Inc.
- Exhibit 131: Blanchard Training and Development Inc. - Overview
- Exhibit 132: Blanchard Training and Development Inc. - Product / Service
- Exhibit 133: Blanchard Training and Development Inc. - Key offerings
- 12.5 Cegos Group
- Exhibit 134: Cegos Group - Overview
- Exhibit 135: Cegos Group - Product / Service
- Exhibit 136: Cegos Group - Key offerings
- 12.6 Computer Generated Solutions Inc.
- Exhibit 137: Computer Generated Solutions Inc. - Overview
- Exhibit 138: Computer Generated Solutions Inc. - Product / Service
- Exhibit 139: Computer Generated Solutions Inc. - Key offerings
- 12.7 D2L Corp.
- Exhibit 140: D2L Corp. - Overview
- Exhibit 141: D2L Corp. - Product / Service
- Exhibit 142: D2L Corp. - Key news
- Exhibit 143: D2L Corp. - Key offerings
- 12.8 Development Dimensions International Inc.
- Exhibit 144: Development Dimensions International Inc. - Overview
- Exhibit 145: Development Dimensions International Inc. - Product / Service
- Exhibit 146: Development Dimensions International Inc. - Key offerings
- 12.9 Franklin Covey Co.
- Exhibit 147: Franklin Covey Co. - Overview
- Exhibit 148: Franklin Covey Co. - Business segments
- Exhibit 149: Franklin Covey Co. - Key offerings
- Exhibit 150: Franklin Covey Co. - Segment focus
- 12.10 GBS Corporate Training Ltd.
- Exhibit 151: GBS Corporate Training Ltd. - Overview
- Exhibit 152: GBS Corporate Training Ltd. - Product / Service
- Exhibit 153: GBS Corporate Training Ltd. - Key offerings
- 12.11 Global Training Solutions Inc.
- Exhibit 154: Global Training Solutions Inc. - Overview
- Exhibit 155: Global Training Solutions Inc. - Product / Service
- Exhibit 156: Global Training Solutions Inc. - Key offerings
- 12.12 GP Strategies Corp.
- Exhibit 157: GP Strategies Corp. - Overview
- Exhibit 158: GP Strategies Corp. - Business segments
- Exhibit 159: GP Strategies Corp. - Key news
- Exhibit 160: GP Strategies Corp. - Key offerings
- Exhibit 161: GP Strategies Corp. - Segment focus
- 12.13 Interaction Associates Inc.
- Exhibit 162: Interaction Associates Inc. - Overview
- Exhibit 163: Interaction Associates Inc. - Product / Service
- Exhibit 164: Interaction Associates Inc. - Key offerings
- 12.14 Korn Ferry
- Exhibit 165: Korn Ferry - Overview
- Exhibit 166: Korn Ferry - Business segments
- Exhibit 167: Korn Ferry - Key offerings
- Exhibit 168: Korn Ferry - Segment focus
- 12.15 Learning Technologies Group Plc
- Exhibit 169: Learning Technologies Group Plc - Overview
- Exhibit 170: Learning Technologies Group Plc - Business segments
- Exhibit 171: Learning Technologies Group Plc - Key news
- Exhibit 172: Learning Technologies Group Plc - Key offerings
- Exhibit 173: Learning Technologies Group Plc - Segment focus
- 12.16 Raytheon Technologies Corp.
- Exhibit 174: Raytheon Technologies Corp. - Overview
- Exhibit 175: Raytheon Technologies Corp. - Business segments
- Exhibit 176: Raytheon Technologies Corp. - Key offerings
- Exhibit 177: Raytheon Technologies Corp. - Segment focus
- 12.17 Wilson Learning Worldwide Inc.
- Exhibit 178: Wilson Learning Worldwide Inc. - Overview
- Exhibit 179: Wilson Learning Worldwide Inc. - Business segments
- Exhibit 180: Wilson Learning Worldwide Inc. - Key offerings
- Exhibit 181: Wilson Learning Worldwide Inc. - Segment focus
13 Appendix
- 13.1 Scope of the report
- 13.2 Inclusions and exclusions checklist
- Exhibit 182: Inclusions checklist
- Exhibit 183: Exclusions checklist
- 13.3 Currency conversion rates for US$
- Exhibit 184: Currency conversion rates for US$
- 13.4 Research methodology
- Exhibit 185: Research methodology
- Exhibit 186: Validation techniques employed for market sizing
- Exhibit 187: Information sources
- 13.5 List of abbreviations
- Exhibit 188: List of abbreviations
- The global education services market is at a crossroads with the positive impact of technological advances such as online education, the implementation of AR and VR in teaching methods, and the use of interactive whiteboards. On the other hand, data and security issues and low digital literacy rates are having a negative impact on the growth of the market. The combined impact of these factors will lead to high growth in the global education services market.
- education: Includes technical education, language learning, test preparation services, tutoring services, makerspaces, vocational training, and distance learning courses and certifications
- emphasis on mobile learning: The increasing use of smartphones is encouraging education service providers to introduce mobile learning modules. Mobile learning has several advantages, such as flexibility and convenience. Therefore, users can schedule and complete the course/training according to their convenience. Mobile learning is also an experience of personalized learning as users can take training as per their requirements.
- digital literacy rates: Educational hardware and software have not been realized in tandem with the availability of trained staff in educational institutions. Institutions find it difficult to integrate technology into business processes. This is because of the inability of the faculty and administrators to understand applications and optimal use. The deployment of these applications alone by colleges and universities is not enough.