|
|
市場調査レポート
商品コード
1076887
手指衛生の世界市場:2022年~2026年Global Hand Hygiene Market 2022-2026 |
||||||
|
|
|||||||
|
● お客様のご希望に応じて、既存データの加工や未掲載情報(例:国別セグメント)の追加などの対応が可能です。 詳細はお問い合わせください。 |
|||||||


| 手指衛生の世界市場:2022年~2026年 |
|
出版日: 2022年05月11日
発行: TechNavio
ページ情報: 英文 120 Pages
納期: 即納可能
|
- 全表示
- 概要
- 図表
- 目次
世界の手指衛生の市場規模は、2022年~2026年の間に30億5,000万米ドルの増加が見込まれ、予測期間中にCAGRで7.73%の成長が予測されています。
市場は、皮膚に安全な製品の使用向上、パンデミック疾患の症例数拡大、衛生関連のキャンペーン数の増加によって牽引されています。
当レポートでは、世界の手指衛生市場について調査分析し、市場規模と予測、動向、成長促進要因、課題、さらに約25社のベンダーを網羅したベンダー分析などを提供しています。
目次
第1章 エグゼクティブサマリー
- 市場概要
第2章 市場情勢
- 市場のエコシステム
第3章 市場規模
- 市場の定義
- 市場セグメント分析
- 市場規模:2021年
- 市場の見通し:2021年~2026年の予測
第4章 ファイブフォース分析
- ファイブフォースの要約
- 買い手の交渉力
- サプライヤーの交渉力
- 新興企業の脅威
- 代替品の脅威
- 競合企業の脅威
- 市況
第5章 市場セグメンテーション:エンドユーザー別
- 市場セグメント
- 比較:エンドユーザー別
- 商業 - 市場規模と予測:2021年~2026年
- 産業 - 市場規模と予測:2021年~2026年
- 住宅 - 市場規模と予測:2021年~2026年
- 市場機会:エンドユーザー別
第6章 顧客情勢
- 顧客情勢の概要
第7章 地域別情勢
- 地域別セグメンテーション
- 地域別比較
- アジア太平洋 - 市場規模と予測:2021年~2026年
- 北米 - 市場規模と予測:2021年~2026年
- 欧州 - 市場規模と予測:2021年~2026年
- 南米 - 市場規模と予測:2021年~2026年
- 中東とアフリカ - 市場規模と予測:2021年~2026年
- 中国 - 市場規模と予測:2021年~2026年
- 米国 - 市場規模と予測:2021年~2026年
- インド - 市場規模と予測:2021年~2026年
- ドイツ - 市場規模と予測:2021年~2026年
- カナダ - 市場規模と予測:2021年~2026年
- 市場機会:地域情勢別
第8章 促進要因、課題、および動向
- 市場促進要因
- 市場の課題
- 促進要因と課題の影響
- 市場動向
第9章 ベンダー情勢
- 概要
- ベンダー情勢
- 混乱の状況
- 業界のリスク
第10章 ベンダー分析
- 対象ベンダー
- ベンダーの市場ポジショニング
- 3M Co.
- Colgate Palmolive Co.
- EcoHydra Technologies Ltd.
- Godrej and Boyce Manufacturing Co. Ltd.
- GOJO Industries Inc.
- Kimberly Clark Corp.
- S.C. Johnson and Son Inc.
- The Clorox Co.
- The Procter and Gamble Co.
- Unilever PLC
第11章 付録
Exhibits:
- Exhibits1: Executive Summary - Chart on Market Overview
- Exhibits2: Executive Summary - Data Table on Market Overview
- Exhibits3: Executive Summary - Chart on Global Market Characteristics
- Exhibits4: Executive Summary - Chart on Market By Geographical Landscape
- Exhibits5: Executive Summary - Chart on Market Segmentation by End-user
- Exhibits6: Executive Summary - Chart on Incremental Growth
- Exhibits7: Executive Summary - Data Table on Incremental Growth
- Exhibits8: Executive Summary - Chart on Vendor Market Positioning
- Exhibits9: Parent market
- Exhibits10: Market Characteristics
- Exhibits11: Offerings of vendors included in the market definition
- Exhibits12: Market segments
- Exhibits13: Chart on Global - Market size and forecast 2021-2026 ($ million)
- Exhibits14: Data Table on Global - Market size and forecast 2021-2026 ($ million)
- Exhibits15: Chart on Global Market: Year-over-year growth 2021-2026 (%)
- Exhibits16: Data Table on Global Market: Year-over-year growth 2021-2026 (%)
- Exhibits17: Five forces analysis - Comparison between 2021 and 2026
- Exhibits18: Chart on Bargaining power of buyers - Impact of key factors 2021 and 2026
- Exhibits19: Bargaining power of suppliers - Impact of key factors in 2021 and 2026
- Exhibits20: Threat of new entrants - Impact of key factors in 2021 and 2026
- Exhibits21: Threat of substitutes - Impact of key factors in 2021 and 2026
- Exhibits22: Threat of rivalry - Impact of key factors in 2021 and 2026
- Exhibits23: Chart on Market condition - Five forces 2021 and 2026
- Exhibits24: Chart on End-user - Market share 2021-2026 (%)
- Exhibits25: Data Table on End-user - Market share 2021-2026 (%)
- Exhibits26: Chart on Comparison by End-user
- Exhibits27: Data Table on Comparison by End-user
- Exhibits28: Chart on Commercial - Market size and forecast 2021-2026 ($ million)
- Exhibits29: Data Table on Commercial - Market size and forecast 2021-2026 ($ million)
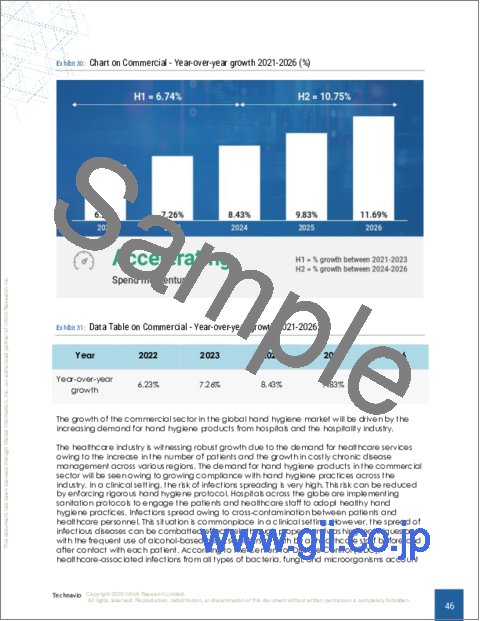
- Exhibits30: Chart on Commercial - Year-over-year growth 2021-2026 (%)
- Exhibits31: Data Table on Commercial - Year-over-year growth 2021-2026 (%)
- Exhibits32: Chart on Industrial - Market size and forecast 2021-2026 ($ million)
- Exhibits33: Data Table on Industrial - Market size and forecast 2021-2026 ($ million)
- Exhibits34: Chart on Industrial - Year-over-year growth 2021-2026 (%)
- Exhibits35: Data Table on Industrial - Year-over-year growth 2021-2026 (%)
- Exhibits36: Chart on Residential - Market size and forecast 2021-2026 ($ million)
- Exhibits37: Data Table on Residential - Market size and forecast 2021-2026 ($ million)
- Exhibits38: Chart on Residential - Year-over-year growth 2021-2026 (%)
- Exhibits39: Data Table on Residential - Year-over-year growth 2021-2026 (%)
- Exhibits40: Market opportunity by End-user ($ million)
- Exhibits41: Analysis of price sensitivity, lifecycle, customer purchase basket, adoption rates, and purchase criteria
- Exhibits42: Chart on Market share By Geographical Landscape 2021-2026 (%)
- Exhibits43: Data Table on Market share By Geographical Landscape 2021-2026 (%)
- Exhibits44: Chart on Geographic comparison
- Exhibits45: Data Table on Geographic comparison
- Exhibits46: Chart on APAC - Market size and forecast 2021-2026 ($ million)
- Exhibits47: Data Table on APAC - Market size and forecast 2021-2026 ($ million)
- Exhibits48: Chart on APAC - Year-over-year growth 2021-2026 (%)
- Exhibits49: Data Table on APAC - Year-over-year growth 2021-2026 (%)
- Exhibits50: Chart on North America - Market size and forecast 2021-2026 ($ million)
- Exhibits51: Data Table on North America - Market size and forecast 2021-2026 ($ million)
- Exhibits52: Chart on North America - Year-over-year growth 2021-2026 (%)
- Exhibits53: Data Table on North America - Year-over-year growth 2021-2026 (%)
- Exhibits54: Chart on Europe - Market size and forecast 2021-2026 ($ million)
- Exhibits55: Data Table on Europe - Market size and forecast 2021-2026 ($ million)
- Exhibits56: Chart on Europe - Year-over-year growth 2021-2026 (%)
- Exhibits57: Data Table on Europe - Year-over-year growth 2021-2026 (%)
- Exhibits58: Chart on South America - Market size and forecast 2021-2026 ($ million)
- Exhibits59: Data Table on South America - Market size and forecast 2021-2026 ($ million)
- Exhibits60: Chart on South America - Year-over-year growth 2021-2026 (%)
- Exhibits61: Data Table on South America - Year-over-year growth 2021-2026 (%)
- Exhibits62: Chart on Middle East and Africa - Market size and forecast 2021-2026 ($ million)
- Exhibits63: Data Table on Middle East and Africa - Market size and forecast 2021-2026 ($ million)
- Exhibits64: Chart on Middle East and Africa - Year-over-year growth 2021-2026 (%)
- Exhibits65: Data Table on Middle East and Africa - Year-over-year growth 2021-2026 (%)
- Exhibits66: Chart on China - Market size and forecast 2021-2026 ($ million)
- Exhibits67: Data Table on China - Market size and forecast 2021-2026 ($ million)
- Exhibits68: Chart on China - Year-over-year growth 2021-2026 (%)
- Exhibits69: Data Table on China - Year-over-year growth 2021-2026 (%)
- Exhibits70: Chart on US - Market size and forecast 2021-2026 ($ million)
- Exhibits71: Data Table on US - Market size and forecast 2021-2026 ($ million)
- Exhibits72: Chart on US - Year-over-year growth 2021-2026 (%)
- Exhibits73: Data Table on US - Year-over-year growth 2021-2026 (%)
- Exhibits74: Chart on India - Market size and forecast 2021-2026 ($ million)
- Exhibits75: Data Table on India - Market size and forecast 2021-2026 ($ million)
- Exhibits76: Chart on India - Year-over-year growth 2021-2026 (%)
- Exhibits77: Data Table on India - Year-over-year growth 2021-2026 (%)
- Exhibits78: Chart on Germany - Market size and forecast 2021-2026 ($ million)
- Exhibits79: Data Table on Germany - Market size and forecast 2021-2026 ($ million)
- Exhibits80: Chart on Germany - Year-over-year growth 2021-2026 (%)
- Exhibits81: Data Table on Germany - Year-over-year growth 2021-2026 (%)
- Exhibits82: Chart on Canada - Market size and forecast 2021-2026 ($ million)
- Exhibits83: Data Table on Canada - Market size and forecast 2021-2026 ($ million)
- Exhibits84: Chart on Canada - Year-over-year growth 2021-2026 (%)
- Exhibits85: Data Table on Canada - Year-over-year growth 2021-2026 (%)
- Exhibits86: Market opportunity By Geographical Landscape ($ million)
- Exhibits87: Impact of drivers and challenges in 2021 and 2026
- Exhibits88: Overview on Criticality of inputs and Factors of differentiation
- Exhibits89: Overview on factors of disruption
- Exhibits90: Impact of key risks on business
- Exhibits91: Vendors covered
- Exhibits92: Matrix on vendor position and classification
- Exhibits93: 3M Co. - Overview
- Exhibits94: 3M Co. - Business segments
- Exhibits95: 3M Co. - Key news
- Exhibits96: 3M Co. - Key offerings
- Exhibits97: 3M Co. - Segment focus
- Exhibits98: Colgate Palmolive Co. - Overview
- Exhibits99: Colgate Palmolive Co. - Business segments
- Exhibits100: Colgate Palmolive Co. - Key offerings
- Exhibits101: Colgate Palmolive Co. - Segment focus
- Exhibits102: EcoHydra Technologies Ltd. - Overview
- Exhibits103: EcoHydra Technologies Ltd. - Product / Service
- Exhibits104: EcoHydra Technologies Ltd. - Key offerings
- Exhibits105: Godrej and Boyce Manufacturing Co. Ltd. - Overview
- Exhibits106: Godrej and Boyce Manufacturing Co. Ltd. - Business segments
- Exhibits107: Godrej and Boyce Manufacturing Co. Ltd. - Key offerings
- Exhibits108: Godrej and Boyce Manufacturing Co. Ltd. - Segment focus
- Exhibits109: GOJO Industries Inc. - Overview
- Exhibits110: GOJO Industries Inc. - Product / Service
- Exhibits111: GOJO Industries Inc. - Key offerings
- Exhibits112: Kimberly Clark Corp. - Overview
- Exhibits113: Kimberly Clark Corp. - Business segments
- Exhibits114: Kimberly Clark Corp. - Key news
- Exhibits115: Kimberly Clark Corp. - Key offerings
- Exhibits116: Kimberly Clark Corp. - Segment focus
- Exhibits117: S.C. Johnson and Son Inc. - Overview
- Exhibits118: S.C. Johnson and Son Inc. - Product / Service
- Exhibits119: S.C. Johnson and Son Inc. - Key offerings
- Exhibits120: The Clorox Co. - Overview
- Exhibits121: The Clorox Co. - Business segments
- Exhibits122: The Clorox Co. - Key news
- Exhibits123: The Clorox Co. - Key offerings
- Exhibits124: The Clorox Co. - Segment focus
- Exhibits125: The Procter and Gamble Co. - Overview
- Exhibits126: The Procter and Gamble Co. - Business segments
- Exhibits127: The Procter and Gamble Co. - Key news
- Exhibits128: The Procter and Gamble Co. - Key offerings
- Exhibits129: The Procter and Gamble Co. - Segment focus
- Exhibits130: Unilever PLC - Overview
- Exhibits131: Unilever PLC - Business segments
- Exhibits132: Unilever PLC - Key news
- Exhibits133: Unilever PLC - Key offerings
- Exhibits134: Unilever PLC - Segment focus
- Exhibits135: Inclusions checklist
- Exhibits136: Exclusions checklist
- Exhibits137: Currency conversion rates for US$
- Exhibits138: Research methodology
- Exhibits139: Validation techniques employed for market sizing
- Exhibits140: Information sources
- Exhibits141: List of abbreviations
Technavio has been monitoring the hand hygiene market and it is poised to grow by $ 3.05 bn during 2022-2026, accelerating at a CAGR of 7.73% during the forecast period. Our report on the hand hygiene market provides a holistic analysis, market size and forecast, trends, growth drivers, and challenges, as well as vendor analysis covering around 25 vendors.
The report offers an up-to-date analysis regarding the current global market scenario, latest trends and drivers, and the overall market environment. The market is driven by increasing use of skin-safe products, growing cases of pandemic diseases, and growing number of hygiene-related campaigns.
The hand hygiene market analysis includes the end-user segment and geographic landscape.
Technavio's hand hygiene market is segmented as below:
By End-user
- Commercial
- Industrial
- Residential
By Geographical Landscape
- APAC
- North America
- Europe
- South America
- Middle East and Africa
This study identifies eco-friendly hand hygiene products as one of the prime reasons driving the hand hygiene market growth during the next few years. Also, the growth of private label brands and increasing research and development investments by vendors will lead to sizable demand in the market.
Technavio presents a detailed picture of the market by the way of study, synthesis, and summation of data from multiple sources by an analysis of key parameters. Our report on hand hygiene market covers the following areas:
- Hand hygiene market sizing
- Hand hygiene market forecast
- Hand hygiene market industry analysis
Technavio's robust vendor analysis is designed to help clients improve their market position, and in line with this, this report provides a detailed analysis of several leading hand hygiene market vendors that include 3M Co., Colgate Palmolive Co., EcoHydra Technologies Ltd., Godrej and Boyce Manufacturing Co. Ltd., GOJO Industries Inc., Kimberly Clark Corp., Kutol Products Co., Medline Industries Inc., Neogen Corp., Reckitt Benckiser Group PLC, S.C. Johnson and Son Inc., Skinvisible Pharmaceuticals Inc., The Clorox Co., The Procter and Gamble Co., Unilever PLC, Cleenol Group Ltd., B4 Brands, Kiilto Family Group, Paul Hartmann AG, and Vi Jon Inc. Also, the hand hygiene market analysis report includes information on upcoming trends and challenges that will influence market growth. This is to help companies strategize and leverage all forthcoming growth opportunities.
The study was conducted using an objective combination of primary and secondary information including inputs from key participants in the industry. The report contains a comprehensive market and vendor landscape in addition to an analysis of the key vendors.
Technavio presents a detailed picture of the market by the way of study, synthesis, and summation of data from multiple sources by an analysis of key parameters such as profit, pricing, competition, and promotions. It presents various market facets by identifying the key industry influencers. The data presented is comprehensive, reliable, and a result of extensive research - both primary and secondary. Technavio's market research reports provide a complete competitive landscape and an in-depth vendor selection methodology and analysis using qualitative and quantitative research to forecast the accurate market growth.
Table of Contents
1 Executive Summary
- 1.1 Market overview
- Exhibit 01: Executive Summary - Chart on Market Overview
- Exhibit 02: Executive Summary - Data Table on Market Overview
- Exhibit 03: Executive Summary - Chart on Global Market Characteristics
- Exhibit 04: Executive Summary - Chart on Market By Geographical Landscape
- Exhibit 05: Executive Summary - Chart on Market Segmentation by End-user
- Exhibit 06: Executive Summary - Chart on Incremental Growth
- Exhibit 07: Executive Summary - Data Table on Incremental Growth
- Exhibit 08: Executive Summary - Chart on Vendor Market Positioning
2 Market Landscape
- 2.1 Market ecosystem
- Exhibit 09: Parent market
- Exhibit 10: Market Characteristics
3 Market Sizing
- 3.1 Market definition
- Exhibit 11: Offerings of vendors included in the market definition
- 3.2 Market segment analysis
- Exhibit 12: Market segments
- 3.3 Market size 2021
- 3.4 Market outlook: Forecast for 2021-2026
- Exhibit 13: Chart on Global - Market size and forecast 2021-2026 ($ million)
- Exhibit 14: Data Table on Global - Market size and forecast 2021-2026 ($ million)
- Exhibit 15: Chart on Global Market: Year-over-year growth 2021-2026 (%)
- Exhibit 16: Data Table on Global Market: Year-over-year growth 2021-2026 (%)
4 Five Forces Analysis
- 4.1 Five forces summary
- Exhibit 17: Five forces analysis - Comparison between 2021 and 2026
- 4.2 Bargaining power of buyers
- Exhibit 18: Chart on Bargaining power of buyers - Impact of key factors 2021 and 2026
- 4.3 Bargaining power of suppliers
- Exhibit 19: Bargaining power of suppliers - Impact of key factors in 2021 and 2026
- 4.4 Threat of new entrants
- Exhibit 20: Threat of new entrants - Impact of key factors in 2021 and 2026
- 4.5 Threat of substitutes
- Exhibit 21: Threat of substitutes - Impact of key factors in 2021 and 2026
- 4.6 Threat of rivalry
- Exhibit 22: Threat of rivalry - Impact of key factors in 2021 and 2026
- 4.7 Market condition
- Exhibit 23: Chart on Market condition - Five forces 2021 and 2026
5 Market Segmentation by End-user
- 5.1 Market segments
- Exhibit 24: Chart on End-user - Market share 2021-2026 (%)
- Exhibit 25: Data Table on End-user - Market share 2021-2026 (%)
- 5.2 Comparison by End-user
- Exhibit 26: Chart on Comparison by End-user
- Exhibit 27: Data Table on Comparison by End-user
- 5.3 Commercial - Market size and forecast 2021-2026
- Exhibit 28: Chart on Commercial - Market size and forecast 2021-2026 ($ million)
- Exhibit 29: Data Table on Commercial - Market size and forecast 2021-2026 ($ million)
- Exhibit 30: Chart on Commercial - Year-over-year growth 2021-2026 (%)
- Exhibit 31: Data Table on Commercial - Year-over-year growth 2021-2026 (%)
- 5.4 Industrial - Market size and forecast 2021-2026
- Exhibit 32: Chart on Industrial - Market size and forecast 2021-2026 ($ million)
- Exhibit 33: Data Table on Industrial - Market size and forecast 2021-2026 ($ million)
- Exhibit 34: Chart on Industrial - Year-over-year growth 2021-2026 (%)
- Exhibit 35: Data Table on Industrial - Year-over-year growth 2021-2026 (%)
- 5.5 Residential - Market size and forecast 2021-2026
- Exhibit 36: Chart on Residential - Market size and forecast 2021-2026 ($ million)
- Exhibit 37: Data Table on Residential - Market size and forecast 2021-2026 ($ million)
- Exhibit 38: Chart on Residential - Year-over-year growth 2021-2026 (%)
- Exhibit 39: Data Table on Residential - Year-over-year growth 2021-2026 (%)
- 5.6 Market opportunity by End-user
- Exhibit 40: Market opportunity by End-user ($ million)
6 Customer Landscape
- 6.1 Customer landscape overview
- Exhibit 41: Analysis of price sensitivity, lifecycle, customer purchase basket, adoption rates, and purchase criteria
7 Geographic Landscape
- 7.1 Geographic segmentation
- Exhibit 42: Chart on Market share By Geographical Landscape 2021-2026 (%)
- Exhibit 43: Data Table on Market share By Geographical Landscape 2021-2026 (%)
- 7.2 Geographic comparison
- Exhibit 44: Chart on Geographic comparison
- Exhibit 45: Data Table on Geographic comparison
- 7.3 APAC - Market size and forecast 2021-2026
- Exhibit 46: Chart on APAC - Market size and forecast 2021-2026 ($ million)
- Exhibit 47: Data Table on APAC - Market size and forecast 2021-2026 ($ million)
- Exhibit 48: Chart on APAC - Year-over-year growth 2021-2026 (%)
- Exhibit 49: Data Table on APAC - Year-over-year growth 2021-2026 (%)
- 7.4 North America - Market size and forecast 2021-2026
- Exhibit 50: Chart on North America - Market size and forecast 2021-2026 ($ million)
- Exhibit 51: Data Table on North America - Market size and forecast 2021-2026 ($ million)
- Exhibit 52: Chart on North America - Year-over-year growth 2021-2026 (%)
- Exhibit 53: Data Table on North America - Year-over-year growth 2021-2026 (%)
- 7.5 Europe - Market size and forecast 2021-2026
- Exhibit 54: Chart on Europe - Market size and forecast 2021-2026 ($ million)
- Exhibit 55: Data Table on Europe - Market size and forecast 2021-2026 ($ million)
- Exhibit 56: Chart on Europe - Year-over-year growth 2021-2026 (%)
- Exhibit 57: Data Table on Europe - Year-over-year growth 2021-2026 (%)
- 7.6 South America - Market size and forecast 2021-2026
- Exhibit 58: Chart on South America - Market size and forecast 2021-2026 ($ million)
- Exhibit 59: Data Table on South America - Market size and forecast 2021-2026 ($ million)
- Exhibit 60: Chart on South America - Year-over-year growth 2021-2026 (%)
- Exhibit 61: Data Table on South America - Year-over-year growth 2021-2026 (%)
- 7.7 Middle East and Africa - Market size and forecast 2021-2026
- Exhibit 62: Chart on Middle East and Africa - Market size and forecast 2021-2026 ($ million)
- Exhibit 63: Data Table on Middle East and Africa - Market size and forecast 2021-2026 ($ million)
- Exhibit 64: Chart on Middle East and Africa - Year-over-year growth 2021-2026 (%)
- Exhibit 65: Data Table on Middle East and Africa - Year-over-year growth 2021-2026 (%)
- 7.8 China - Market size and forecast 2021-2026
- Exhibit 66: Chart on China - Market size and forecast 2021-2026 ($ million)
- Exhibit 67: Data Table on China - Market size and forecast 2021-2026 ($ million)
- Exhibit 68: Chart on China - Year-over-year growth 2021-2026 (%)
- Exhibit 69: Data Table on China - Year-over-year growth 2021-2026 (%)
- 7.9 US - Market size and forecast 2021-2026
- Exhibit 70: Chart on US - Market size and forecast 2021-2026 ($ million)
- Exhibit 71: Data Table on US - Market size and forecast 2021-2026 ($ million)
- Exhibit 72: Chart on US - Year-over-year growth 2021-2026 (%)
- Exhibit 73: Data Table on US - Year-over-year growth 2021-2026 (%)
- 7.10 India - Market size and forecast 2021-2026
- Exhibit 74: Chart on India - Market size and forecast 2021-2026 ($ million)
- Exhibit 75: Data Table on India - Market size and forecast 2021-2026 ($ million)
- Exhibit 76: Chart on India - Year-over-year growth 2021-2026 (%)
- Exhibit 77: Data Table on India - Year-over-year growth 2021-2026 (%)
- 7.11 Germany - Market size and forecast 2021-2026
- Exhibit 78: Chart on Germany - Market size and forecast 2021-2026 ($ million)
- Exhibit 79: Data Table on Germany - Market size and forecast 2021-2026 ($ million)
- Exhibit 80: Chart on Germany - Year-over-year growth 2021-2026 (%)
- Exhibit 81: Data Table on Germany - Year-over-year growth 2021-2026 (%)
- 7.12 Canada - Market size and forecast 2021-2026
- Exhibit 82: Chart on Canada - Market size and forecast 2021-2026 ($ million)
- Exhibit 83: Data Table on Canada - Market size and forecast 2021-2026 ($ million)
- Exhibit 84: Chart on Canada - Year-over-year growth 2021-2026 (%)
- Exhibit 85: Data Table on Canada - Year-over-year growth 2021-2026 (%)
- 7.13 Market opportunity By Geographical Landscape
- Exhibit 86: Market opportunity By Geographical Landscape ($ million)
8 Drivers, Challenges, and Trends
- 8.1 Market drivers
- 8.2 Market challenges
- 8.3 Impact of drivers and challenges
- Exhibit 87: Impact of drivers and challenges in 2021 and 2026
- 8.4 Market trends
9 Vendor Landscape
- 9.1 Overview
- 9.2 Vendor landscape
- Exhibit 88: Overview on Criticality of inputs and Factors of differentiation
- 9.3 Landscape disruption
- Exhibit 89: Overview on factors of disruption
- 9.4 Industry risks
- Exhibit 90: Impact of key risks on business
10 Vendor Analysis
- 10.1 Vendors covered
- Exhibit 91: Vendors covered
- 10.2 Market positioning of vendors
- Exhibit 92: Matrix on vendor position and classification
- 10.3 3M Co.
- Exhibit 93: 3M Co. - Overview
- Exhibit 94: 3M Co. - Business segments
- Exhibit 95: 3M Co. - Key news
- Exhibit 96: 3M Co. - Key offerings
- Exhibit 97: 3M Co. - Segment focus
- 10.4 Colgate Palmolive Co.
- Exhibit 98: Colgate Palmolive Co. - Overview
- Exhibit 99: Colgate Palmolive Co. - Business segments
- Exhibit 100: Colgate Palmolive Co. - Key offerings
- Exhibit 101: Colgate Palmolive Co. - Segment focus
- 10.5 EcoHydra Technologies Ltd.
- Exhibit 102: EcoHydra Technologies Ltd. - Overview
- Exhibit 103: EcoHydra Technologies Ltd. - Product / Service
- Exhibit 104: EcoHydra Technologies Ltd. - Key offerings
- 10.6 Godrej and Boyce Manufacturing Co. Ltd.
- Exhibit 105: Godrej and Boyce Manufacturing Co. Ltd. - Overview
- Exhibit 106: Godrej and Boyce Manufacturing Co. Ltd. - Business segments
- Exhibit 107: Godrej and Boyce Manufacturing Co. Ltd. - Key offerings
- Exhibit 108: Godrej and Boyce Manufacturing Co. Ltd. - Segment focus
- 10.7 GOJO Industries Inc.
- Exhibit 109: GOJO Industries Inc. - Overview
- Exhibit 110: GOJO Industries Inc. - Product / Service
- Exhibit 111: GOJO Industries Inc. - Key offerings
- 10.8 Kimberly Clark Corp.
- Exhibit 112: Kimberly Clark Corp. - Overview
- Exhibit 113: Kimberly Clark Corp. - Business segments
- Exhibit 114: Kimberly Clark Corp. - Key news
- Exhibit 115: Kimberly Clark Corp. - Key offerings
- Exhibit 116: Kimberly Clark Corp. - Segment focus
- 10.9 S.C. Johnson and Son Inc.
- Exhibit 117: S.C. Johnson and Son Inc. - Overview
- Exhibit 118: S.C. Johnson and Son Inc. - Product / Service
- Exhibit 119: S.C. Johnson and Son Inc. - Key offerings
- 10.10 The Clorox Co.
- Exhibit 120: The Clorox Co. - Overview
- Exhibit 121: The Clorox Co. - Business segments
- Exhibit 122: The Clorox Co. - Key news
- Exhibit 123: The Clorox Co. - Key offerings
- Exhibit 124: The Clorox Co. - Segment focus
- 10.11 The Procter and Gamble Co.
- Exhibit 125: The Procter and Gamble Co. - Overview
- Exhibit 126: The Procter and Gamble Co. - Business segments
- Exhibit 127: The Procter and Gamble Co. - Key news
- Exhibit 128: The Procter and Gamble Co. - Key offerings
- Exhibit 129: The Procter and Gamble Co. - Segment focus
- 10.12 Unilever PLC
- Exhibit 130: Unilever PLC - Overview
- Exhibit 131: Unilever PLC - Business segments
- Exhibit 132: Unilever PLC - Key news
- Exhibit 133: Unilever PLC - Key offerings
- Exhibit 134: Unilever PLC - Segment focus
11 Appendix
- 11.1 Scope of the report
- 11.2 Inclusions and exclusions checklist
- Exhibit 135: Inclusions checklist
- Exhibit 136: Exclusions checklist
- 11.3 Currency conversion rates for US$
- Exhibit 137: Currency conversion rates for US$
- 11.4 Research methodology
- Exhibit 138: Research methodology
- Exhibit 139: Validation techniques employed for market sizing
- Exhibit 140: Information sources
- 11.5 List of abbreviations
- Exhibit 141: List of abbreviations