|
|
市場調査レポート
商品コード
1072816
先進機能材料の世界市場(2022年~2026年)Global Advanced Functional Materials Market 2022-2026 |
||||||
|
|
|||||||
|
● お客様のご希望に応じて、既存データの加工や未掲載情報(例:国別セグメント)の追加などの対応が可能です。 詳細はお問い合わせください。 |
|||||||


| 先進機能材料の世界市場(2022年~2026年) |
|
出版日: 2022年04月28日
発行: TechNavio
ページ情報: 英文 120 Pages
納期: 即納可能
|
- 全表示
- 概要
- 図表
- 目次
世界の先進機能材料の市場規模は、予測期間中に9.02%のCAGR推移し、2022年から2026年の間に480億米ドルに達すると予測されています。
同市場は、自動車の規制要件の増加、低燃費の航空機や機関車への需要の高まり、および医療機器や診断機器の技術的進歩によって牽引されています。
当レポートでは、世界の先進機能材料市場を調査し、市場規模・予測、最新動向、成長促進要因、課題などの情報を提供しています。
目次
第1章 エグゼクティブサマリー
- 市場概要
第2章 市場情勢
- 市場のエコシステム
第3章 市場規模
- 市場定義
- 市場セグメント分析
- 市場規模(2021年)
- 市場の見通し:予測(2021年~2026年)
第4章 ファイブフォース分析
- ファイブフォースの要約
- 買い手の交渉力
- 供給企業の交渉力
- 新規参入業者の脅威
- 代替品の脅威
- ライバルの脅威
- 市況
第5章 市場セグメンテーション:タイプ別
- 市場セグメント
- 比較:タイプ別
- 複合材料 - 市場規模と予測(2021年~2026年)
- セラミックス - 市場規模と予測(2021年~2026年)
- エネルギー材料 - 市場規模と予測(2021年~2026年)
- ナノマテリアル - 市場規模と予測(2021年~2026年)
- 導電性ポリマー - 市場規模と予測(2021年~2026年)
- 市場機会:タイプ別
第6章 顧客情勢
- 顧客情勢の概要
第7章 地理的情勢
- 地理的セグメンテーション
- 地理的比較
- アジア太平洋 - 市場規模と予測(2021年~2026年)
- 北米 - 市場規模と予測(2021年~2026年)
- 欧州 - 市場規模と予測(2021年~2026年)
- 南米 - 市場規模と予測(2021年~2026年)
- 中東・アフリカ - 市場規模と予測(2021年~2026年)
- 中国 - 市場規模と予測(2021年~2026年)
- 米国 - 市場規模と予測(2021年~2026年)
- メキシコ - 市場規模と予測(2021年~2026年)
- ドイツ - 市場規模と予測(2021年~2026年)
- インド - 市場規模と予測(2021年~2026年)
- 市場機会:地理的情勢別
第8章 促進要因、課題、動向
- 市場促進要因
- 市場の課題
- 促進要因と課題の影響
- 市場動向
第9章 ベンダー情勢
- 概要
- ベンダー情勢
- 破壊的情勢
- 業界リスク
第10章 ベンダー分析
- 対象ベンダー
- ベンダーの市場ポジショニング
- 3M Corp
- Arkema Group
- BASF SE
- Covestro AG
- CPS Technologies Corp.
- DuPont de Nemours Inc.
- Hexcel Corp.
- Schweiter Technologies
- Sumitomo Chemical Co. Ltd.
- The Dow Chemical Co.
第11章 付録
- 調査範囲
- 包含・除外チェックリスト
- 米ドルの為替レート
- 調査手法
- 略語のリスト
図表:
- 図表1:エグゼクティブサマリー - 市場概要のチャート
- 図表2:エグゼクティブサマリー - 市場概要のデータ表
- 図表3:エグゼクティブサマリー - 世界市場の特徴に関するチャート
- 図表4:エグゼクティブサマリー - 市場チャート:地理的情勢別
- 図表5:エグゼクティブサマリー - 市場セグメンテーションに関するチャート:タイプ別
- 図表6:エグゼクティブサマリー - 増分成長に関するチャート
- 図表7:エグゼクティブサマリー - 増分成長に関するデータ表
- 図表8:エグゼクティブサマリー - ベンダーの市場ポジショニングに関するチャート
- 図表9:親市場
- 図表10:市場の特徴
- 図表11:市場定義に含まれるベンダーの提供
- 図表12:市場セグメント
- 図表13:世界のチャート - 市場規模と予測(2021年~2026年)
- 図表14:世界のデータ表 - 市場規模と予測(2021年~2026年)
- 図表15:世界市場のチャート:前年比成長率(%)(2021年~2026年)
- 図表16:世界市場のデータ表:前年比成長率(%)(2021年~2026年)
- 図表17:ファイブフォース分析 - 比較(2021年と2026年)
- 図表18:買い手の交渉力に関するチャート - 主要な要因の影響(2021年と2026年)
- 図表19:供給企業の交渉力 - 主要な要因の影響(2021年と2026年)
- 図表20:新規参入業者の脅威 - 主要な要因の影響(2021年と2026年)
- 図表21:代替品の脅威 - 主要な要因の影響(2021年と2026年)
- 図表22:ライバルの脅威 - 主要な要因の影響(2021年と2026年)
- 図表23:市況のチャート - ファイブフォース(2021年と2026年)
- 図表24:タイプのチャート - 市場シェア(%)(2021年~2026年)
- 図表25:タイプのデータ表 - 市場シェア(%)(2021年~2026年)
- 図表26:比較のチャート:タイプ別
- 図表27:比較のデータ表:タイプ別
- 図表28:複合材料のチャート - 市場規模と予測(2021年~2026年)
- 図表29:複合材料のデータ表 - 市場規模と予測(2021年~2026年)
- 図表30:複合材料のチャート - 前年比成長率(%)(2021年~2026年)
- 図表31:複合材料のデータ表 - 前年比成長率(%)(2021年~2026年)
- 図表32:セラミックスのチャート - 市場規模と予測(2021年~2026年)
- 図表33:セラミックスのデータ表 - 市場規模と予測(2021年~2026年)
- 図表34:セラミックスのチャート - 前年比成長率(%)(2021年~2026年)
- 図表35:セラミックスのデータ表 - 前年比成長率(%)(2021年~2026年)
- 図表36:エネルギー材料のチャート - 市場規模と予測(2021年~2026年)
- 図表37:エネルギー材料のデータ表 - 市場規模と予測(2021年~2026年)
- 図表38:エネルギー材料のチャート - 前年比成長率(%)(2021年~2026年)
- 図表39:エネルギー材料のデータ表 - 前年比成長率(%)(2021年~2026年)
- 図表40:ナノマテリアルのチャート - 市場規模と予測(2021年~2026年)
- 図表41:ナノマテリアルのデータ表 - 市場規模と予測(2021年~2026年)
- 図表42:ナノマテリアルのチャート - 前年比成長率(%)(2021年~2026年)
- 図表43:ナノマテリアルのデータ表 - 前年比成長率(%)(2021年~2026年)
- 図表44:導電性ポリマーのチャート - 市場規模と予測(2021年~2026年)
- 図表45:導電性ポリマーのデータ表 - 市場規模と予測(2021年~2026年)
- 図表46:導電性ポリマーのチャート - 前年比成長率(%)(2021年~2026年)
- 図表47:導電性ポリマーのデータ表 - 前年比成長率(%)(2021年~2026年)
- 図表48:市場機会:タイプ別
- 図表49:価格感応度、ライフサイクル、顧客購入バスケット、採用率、購入基準の分析
- 図表50:市場シェアのチャート:地理的情勢別(%)(2021年~2026年)
- 図表51:市場シェアのデータ表:地理的情勢別(%)(2021年~2026年)
- 図表52:地理的比較のチャート
- 図表53:地理的比較のデータ表
- 図表54:アジア太平洋のチャート - 市場規模と予測(2021年~2026年)
- 図表55:アジア太平洋のデータ表 - 市場規模と予測(2021年~2026年)
- 図表56:アジア太平洋のチャート - 前年比成長率(%)(2021年~2026年)
- 図表57:アジア太平洋のデータ表 - 前年比成長率(%)(2021年~2026年)
- 図表58:北米のチャート - 市場規模と予測(2021年~2026年)
- 図表59:北米のデータ表 - 市場規模と予測(2021年~2026年)
- 図表60:北米のチャート - 前年比成長率(%)(2021年~2026年)
- 図表61:北米のデータ表 - 前年比成長率(%)(2021年~2026年)
- 図表62:欧州のチャート - 市場規模と予測(2021年~2026年)
- 図表63:欧州のデータ表 - 市場規模と予測(2021年~2026年)
- 図表64:欧州のチャート - 前年比成長率(%)(2021年~2026年)
- 図表65:欧州のデータ表 - 前年比成長率(%)(2021年~2026年)
- 図表66:南米のチャート - 市場規模と予測(2021年~2026年)
- 図表67:南米のデータ表 - 市場規模と予測(2021年~2026年)
- 図表68:南米のチャート - 前年比成長率(%)(2021年~2026年)
- 図表69:南米のデータ表 - 前年比成長率(%)(2021年~2026年)
- 図表70:中東・アフリカのチャート - 市場規模と予測(2021年~2026年)
- 図表71:中東・アフリカのデータ表 - 市場規模と予測(2021年~2026年)
- 図表72:中東・アフリカのチャート - 前年比成長率(%)(2021年~2026年)
- 図表73:中東・アフリカのデータ表 - 前年比成長率(%)(2021年~2026年)
- 図表74:中国のチャート - 市場規模と予測(2021年~2026年)
- 図表75:中国のデータ表 - 市場規模と予測(2021年~2026年)
- 図表76:中国のチャート - 前年比成長率(%)(2021年~2026年)
- 図表77:中国のデータ表 - 前年比成長率(%)(2021年~2026年)
- 図表78:米国のチャート - 市場規模と予測(2021年~2026年)
- 図表79:米国のデータ表 - 市場規模と予測(2021年~2026年)
- 図表80:米国のチャート - 前年比成長率(%)(2021年~2026年)
- 図表81:米国のデータ表 - 前年比成長率(%)(2021年~2026年)
- 図表82:メキシコのチャート - 市場規模と予測(2021年~2026年)
- 図表83:メキシコのデータ表 - 市場規模と予測(2021年~2026年)
- 図表84:メキシコのチャート - 前年比成長率(%)(2021年~2026年)
- 図表85:メキシコのデータ表 - 前年比成長率(%)(2021年~2026年)
- 図表86:ドイツのチャート - 市場規模と予測(2021年~2026年)
- 図表87:ドイツのデータ表 - 市場規模と予測(2021年~2026年)
- 図表88:ドイツのチャート - 前年比成長率(%)(2021年~2026年)
- 図表89:ドイツのデータ表 - 前年比成長率(%)(2021年~2026年)
- 図表90:インドのチャート - 市場規模と予測(2021年~2026年)
- 図表91:インドのデータ表 - 市場規模と予測(2021年~2026年)
- 図表92:インドのチャート - 前年比成長率(%)(2021年~2026年)
- 図表93:インドのデータ表 - 前年比成長率(%)(2021年~2026年)
- 図表94:市場機会:地理的情勢別
- 図表95:促進要因と課題の影響(2021年と2026年)
- 図表96:インプットの重要性と差別化の要因に関する概要
- 図表97:混乱の要因の概要
- 図表98:主要リスクがビジネスに与える影響
- 図表99:対象ベンダー
- 図表100:ベンダーポジションと分類に関するマトリックス
- 図表101:3M Corp - 概要
- 図表102:3M Corp - 事業セグメント
- 図表103:3M Corp - 重要なニュース
- 図表104:3M Corp - 主な製品
- 図表105:3M Corp - セグメントフォーカス
- 図表106:Arkema Group - 概要
- 図表107:Arkema Group - 事業セグメント
- 図表108:Arkema Group - 重要なニュース
- 図表109:Arkema Group - 主な製品
- 図表110:Arkema Group - セグメントフォーカス
- 図表111:BASF SE - 概要
- 図表112:BASF SE - 事業セグメント
- 図表113:BASF SE - 重要なニュース
- 図表114:BASF SE - 主な製品
- 図表115:BASF SE - セグメントフォーカス
- 図表116:Covestro AG - 概要
- 図表117:Covestro AG - 事業セグメント
- 図表118:Covestro AG - 重要なニュース
- 図表119:Covestro AG - 主な製品
- 図表120:Covestro AG - セグメントフォーカス
- 図表121:CPS Technologies Corp. - 概要
- 図表122:CPS Technologies Corp. - 製品/サービス
- 図表123:CPS Technologies Corp. - 主な製品
- 図表124:DuPont de Nemours Inc. - 概要
- 図表125:DuPont de Nemours Inc. - 事業セグメント
- 図表126:DuPont de Nemours Inc. - 主な製品
- 図表127:DuPont de Nemours Inc. - セグメントフォーカス
- 図表128:Hexcel Corp. - 概要
- 図表129:Hexcel Corp. - 事業セグメント
- 図表130:Hexcel Corp. - 重要なニュース
- 図表131:Hexcel Corp. - 主な製品
- 図表132:Hexcel Corp. - セグメントフォーカス
- 図表133:Schweiter Technologies - 概要
- 図表134:Schweiter Technologies - 事業セグメント
- 図表135:Schweiter Technologies - 主な製品
- 図表136:Schweiter Technologies - セグメントフォーカス
- 図表137:Sumitomo Chemical Co. Ltd. - 概要
- 図表138:Sumitomo Chemical Co. Ltd. - 事業セグメント
- 図表139:Sumitomo Chemical Co. Ltd. - 主な製品
- 図表140:Sumitomo Chemical Co. Ltd. - セグメントフォーカス
- 図表141:The Dow Chemical Co. - 概要
- 図表142:The Dow Chemical Co. - 事業セグメント
- 図表143:The Dow Chemical Co. - 重要なニュース
- 図表144:The Dow Chemical Co. - 主な製品
- 図表145:The Dow Chemical Co. - セグメントフォーカス
- 図表146:包含チェックリスト
- 図表147:除外チェックリスト
- 図表148:米ドルの為替レート
- 図表149:調査手法
- 図表150:市場のサイジングに採用された検証手法
- 図表151:情報源
- 図表152:略語のリスト
Exhibits:
- Exhibits1: Executive Summary - Chart on Market Overview
- Exhibits2: Executive Summary - Data Table on Market Overview
- Exhibits3: Executive Summary - Chart on Global Market Characteristics
- Exhibits4: Executive Summary - Chart on Market By Geographical Landscape
- Exhibits5: Executive Summary - Chart on Market Segmentation by Type
- Exhibits6: Executive Summary - Chart on Incremental Growth
- Exhibits7: Executive Summary - Data Table on Incremental Growth
- Exhibits8: Executive Summary - Chart on Vendor Market Positioning
- Exhibits9: Parent market
- Exhibits10: Market Characteristics
- Exhibits11: Offerings of vendors included in the market definition
- Exhibits12: Market segments
- Exhibits13: Chart on Global - Market size and forecast 2021-2026 ($ billion)
- Exhibits14: Data Table on Global - Market size and forecast 2021-2026 ($ billion)
- Exhibits15: Chart on Global Market: Year-over-year growth 2021-2026 (%)
- Exhibits16: Data Table on Global Market: Year-over-year growth 2021-2026 (%)
- Exhibits17: Five forces analysis - Comparison between2021 and 2026
- Exhibits18: Chart on Bargaining power of buyers - Impact of key factors 2021 and 2026
- Exhibits19: Bargaining power of suppliers - Impact of key factors in 2021 and 2026
- Exhibits20: Threat of new entrants - Impact of key factors in 2021 and 2026
- Exhibits21: Threat of substitutes - Impact of key factors in 2021 and 2026
- Exhibits22: Threat of rivalry - Impact of key factors in 2021 and 2026
- Exhibits23: Chart on Market condition - Five forces 2021 and 2026
- Exhibits24: Chart on Type - Market share 2021-2026 (%)
- Exhibits25: Data Table on Type - Market share 2021-2026 (%)
- Exhibits26: Chart on Comparison by Type
- Exhibits27: Data Table on Comparison by Type
- Exhibits28: Chart on Composites - Market size and forecast 2021-2026 ($ billion)
- Exhibits29: Data Table on Composites - Market size and forecast 2021-2026 ($ billion)
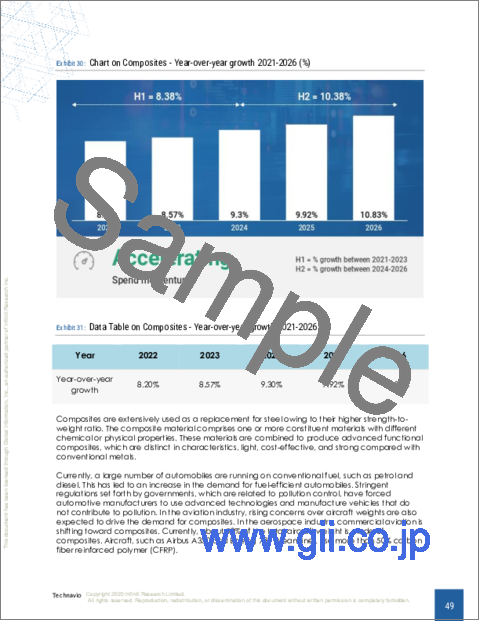
- Exhibits30: Chart on Composites - Year-over-year growth 2021-2026 (%)
- Exhibits31: Data Table on Composites - Year-over-year growth 2021-2026 (%)
- Exhibits32: Chart on Ceramics - Market size and forecast 2021-2026 ($ billion)
- Exhibits33: Data Table on Ceramics - Market size and forecast 2021-2026 ($ billion)
- Exhibits34: Chart on Ceramics - Year-over-year growth 2021-2026 (%)
- Exhibits35: Data Table on Ceramics - Year-over-year growth 2021-2026 (%)
- Exhibits36: Chart on Energy materials - Market size and forecast 2021-2026 ($ billion)
- Exhibits37: Data Table on Energy materials - Market size and forecast 2021-2026 ($ billion)
- Exhibits38: Chart on Energy materials - Year-over-year growth 2021-2026 (%)
- Exhibits39: Data Table on Energy materials - Year-over-year growth 2021-2026 (%)
- Exhibits40: Chart on Nanomaterials - Market size and forecast 2021-2026 ($ billion)
- Exhibits41: Data Table on Nanomaterials - Market size and forecast 2021-2026 ($ billion)
- Exhibits42: Chart on Nanomaterials - Year-over-year growth 2021-2026 (%)
- Exhibits43: Data Table on Nanomaterials - Year-over-year growth 2021-2026 (%)
- Exhibits44: Chart on Conductive polymers - Market size and forecast 2021-2026 ($ billion)
- Exhibits45: Data Table on Conductive polymers - Market size and forecast 2021-2026 ($ billion)
- Exhibits46: Chart on Conductive polymers - Year-over-year growth 2021-2026 (%)
- Exhibits47: Data Table on Conductive polymers - Year-over-year growth 2021-2026 (%)
- Exhibits48: Market opportunity by Type ($ billion)
- Exhibits49: Analysis of price sensitivity, lifecycle, customer purchase basket, adoption rates, and purchase criteria
- Exhibits50: Chart on Market share By Geographical Landscape 2021-2026 (%)
- Exhibits51: Data Table on Market share By Geographical Landscape 2021-2026 (%)
- Exhibits52: Chart on Geographic comparison
- Exhibits53: Data Table on Geographic comparison
- Exhibits54: Chart on APAC - Market size and forecast 2021-2026 ($ billion)
- Exhibits55: Data Table on APAC - Market size and forecast 2021-2026 ($ billion)
- Exhibits56: Chart on APAC - Year-over-year growth 2021-2026 (%)
- Exhibits57: Data Table on APAC - Year-over-year growth 2021-2026 (%)
- Exhibits58: Chart on North America - Market size and forecast 2021-2026 ($ billion)
- Exhibits59: Data Table on North America - Market size and forecast 2021-2026 ($ billion)
- Exhibits60: Chart on North America - Year-over-year growth 2021-2026 (%)
- Exhibits61: Data Table on North America - Year-over-year growth 2021-2026 (%)
- Exhibits62: Chart on Europe - Market size and forecast 2021-2026 ($ billion)
- Exhibits63: Data Table on Europe - Market size and forecast 2021-2026 ($ billion)
- Exhibits64: Chart on Europe - Year-over-year growth 2021-2026 (%)
- Exhibits65: Data Table on Europe - Year-over-year growth 2021-2026 (%)
- Exhibits66: Chart on South America - Market size and forecast 2021-2026 ($ billion)
- Exhibits67: Data Table on South America - Market size and forecast 2021-2026 ($ billion)
- Exhibits68: Chart on South America - Year-over-year growth 2021-2026 (%)
- Exhibits69: Data Table on South America - Year-over-year growth 2021-2026 (%)
- Exhibits70: Chart on Middle East and Africa - Market size and forecast 2021-2026 ($ billion)
- Exhibits71: Data Table on Middle East and Africa - Market size and forecast 2021-2026 ($ billion)
- Exhibits72: Chart on Middle East and Africa - Year-over-year growth 2021-2026 (%)
- Exhibits73: Data Table on Middle East and Africa - Year-over-year growth 2021-2026 (%)
- Exhibits74: Chart on China - Market size and forecast 2021-2026 ($ billion)
- Exhibits75: Data Table on China - Market size and forecast 2021-2026 ($ billion)
- Exhibits76: Chart on China - Year-over-year growth 2021-2026 (%)
- Exhibits77: Data Table on China - Year-over-year growth 2021-2026 (%)
- Exhibits78: Chart on US - Market size and forecast 2021-2026 ($ billion)
- Exhibits79: Data Table on US - Market size and forecast 2021-2026 ($ billion)
- Exhibits80: Chart on US - Year-over-year growth 2021-2026 (%)
- Exhibits81: Data Table on US - Year-over-year growth 2021-2026 (%)
- Exhibits82: Chart on Mexico - Market size and forecast 2021-2026 ($ billion)
- Exhibits83: Data Table on Mexico - Market size and forecast 2021-2026 ($ billion)
- Exhibits84: Chart on Mexico - Year-over-year growth 2021-2026 (%)
- Exhibits85: Data Table on Mexico - Year-over-year growth 2021-2026 (%)
- Exhibits86: Chart on Germany - Market size and forecast 2021-2026 ($ billion)
- Exhibits87: Data Table on Germany - Market size and forecast 2021-2026 ($ billion)
- Exhibits88: Chart on Germany - Year-over-year growth 2021-2026 (%)
- Exhibits89: Data Table on Germany - Year-over-year growth 2021-2026 (%)
- Exhibits90: Chart on India - Market size and forecast 2021-2026 ($ billion)
- Exhibits91: Data Table on India - Market size and forecast 2021-2026 ($ billion)
- Exhibits92: Chart on India - Year-over-year growth 2021-2026 (%)
- Exhibits93: Data Table on India - Year-over-year growth 2021-2026 (%)
- Exhibits94: Market opportunity By Geographical Landscape ($ billion)
- Exhibits95: Impact of drivers and challenges in 2021 and 2026
- Exhibits96: Overview on Criticality of inputs and Factors of differentiation
- Exhibits97: Overview on factors of disruption
- Exhibits98: Impact of key risks on business
- Exhibits99: Vendors covered
- Exhibits100: Matrix on vendor position and classification
- Exhibits101: 3M Corp - Overview
- Exhibits102: 3M Corp - Business segments
- Exhibits103: 3M Corp - Key news
- Exhibits104: 3M Corp - Key offerings
- Exhibits105: 3M Corp - Segment focus
- Exhibits106: Arkema Group - Overview
- Exhibits107: Arkema Group - Business segments
- Exhibits108: Arkema Group - Key news
- Exhibits109: Arkema Group - Key offerings
- Exhibits110: Arkema Group - Segment focus
- Exhibits111: BASF SE - Overview
- Exhibits112: BASF SE - Business segments
- Exhibits113: BASF SE - Key news
- Exhibits114: BASF SE - Key offerings
- Exhibits115: BASF SE - Segment focus
- Exhibits116: Covestro AG - Overview
- Exhibits117: Covestro AG - Business segments
- Exhibits118: Covestro AG - Key news
- Exhibits119: Covestro AG - Key offerings
- Exhibits120: Covestro AG - Segment focus
- Exhibits121: CPS Technologies Corp. - Overview
- Exhibits122: CPS Technologies Corp. - Product / Service
- Exhibits123: CPS Technologies Corp. - Key offerings
- Exhibits124: DuPont de Nemours Inc. - Overview
- Exhibits125: DuPont de Nemours Inc. - Business segments
- Exhibits126: DuPont de Nemours Inc. - Key offerings
- Exhibits127: DuPont de Nemours Inc. - Segment focus
- Exhibits128: Hexcel Corp. - Overview
- Exhibits129: Hexcel Corp. - Business segments
- Exhibits130: Hexcel Corp. - Key news
- Exhibits131: Hexcel Corp. - Key offerings
- Exhibits132: Hexcel Corp. - Segment focus
- Exhibits133: Schweiter Technologies - Overview
- Exhibits134: Schweiter Technologies - Business segments
- Exhibits135: Schweiter Technologies - Key offerings
- Exhibits136: Schweiter Technologies - Segment focus
- Exhibits137: Sumitomo Chemical Co. Ltd. - Overview
- Exhibits138: Sumitomo Chemical Co. Ltd. - Business segments
- Exhibits139: Sumitomo Chemical Co. Ltd. - Key offerings
- Exhibits140: Sumitomo Chemical Co. Ltd. - Segment focus
- Exhibits141: The Dow Chemical Co. - Overview
- Exhibits142: The Dow Chemical Co. - Business segments
- Exhibits143: The Dow Chemical Co. - Key news
- Exhibits144: The Dow Chemical Co. - Key offerings
- Exhibits145: The Dow Chemical Co. - Segment focus
- Exhibits146: Inclusions checklist
- Exhibits147: Exclusions checklist
- Exhibits148: Currency conversion rates for US$
- Exhibits149: Research methodology
- Exhibits150: Validation techniques employed for market sizing
- Exhibits151: Information sources
- Exhibits152: List of abbreviations
Technavio has been monitoring the advanced functional materials market and it is poised to grow by $ 48 bn during 2022-2026, accelerating at a CAGR of 9.02% during the forecast period. Our report on the advanced functional materials market provides a holistic analysis, market size and forecast, trends, growth drivers, and challenges, as well as vendor analysis covering around 25 vendors.
The report offers an up-to-date analysis regarding the current global market scenario, latest trends and drivers, and the overall market environment. The market is driven by increase in automotive regulatory requirements, growing demand for fuel-efficient aircraft and locomotive, and technological advances in medical and diagnostic devices.
The advanced functional materials market analysis includes the type segment and geographic landscape.
Technavio's advanced functional materials market is segmented as below:
By Type
- Composites
- Ceramics
- Energy materials
- Nanomaterials
- Conductive polymers
By Geographical Landscape
- APAC
- North America
- Europe
- South America
- Middle East and Africa
This study identifies the increasing need for miniaturization and microelectronics as one of the prime reasons driving the advanced functional materials market growth during the next few years. Also, innovation and focus on the use of lightweight materials in new energy vehicles and growing demand from APAC will lead to sizable demand in the market.
Technavio presents a detailed picture of the market by the way of study, synthesis, and summation of data from multiple sources by an analysis of key parameters. Our report on advanced functional materials market covers the following areas:
- Advanced functional materials market sizing
- Advanced functional materials market forecast
- Advanced functional materials market industry analysis
Technavio's robust vendor analysis is designed to help clients improve their market position, and in line with this, this report provides a detailed analysis of several leading advanced functional materials market vendors that include 3M Corp, AMETEK Inc., Applied Materials Inc., Arkema Group, BASF SE, CeramTec GmbH, Compagnie de Saint Gobain SA, Covestro AG, CPS Technologies Corp., Deutsche Edelstahlwerke Specialty Steel GmbH and Co. KG, DIC Corp., DuPont de Nemours Inc., Functional Materials Manufacturing Inc., Hexcel Corp., Momentive Performance Materials Inc., NiKKi Fron Co. Ltd., Schweiter Technologies, SHOWA DENKO K.K., Sumitomo Chemical Co. Ltd., and The Dow Chemical Co. Also, the advanced functional materials market analysis report includes information on upcoming trends and challenges that will influence market growth. This is to help companies strategize and leverage all forthcoming growth opportunities.
The study was conducted using an objective combination of primary and secondary information including inputs from key participants in the industry. The report contains a comprehensive market and vendor landscape in addition to an analysis of the key vendors.
Technavio presents a detailed picture of the market by the way of study, synthesis, and summation of data from multiple sources by an analysis of key parameters such as profit, pricing, competition, and promotions. It presents various market facets by identifying the key industry influencers. The data presented is comprehensive, reliable, and a result of extensive research - both primary and secondary. Technavio's market research reports provide a complete competitive landscape and an in-depth vendor selection methodology and analysis using qualitative and quantitative research to forecast the accurate market growth.
Table of Contents
1 Executive Summary
- 1.1 Market overview
- Exhibit 01: Executive Summary - Chart on Market Overview
- Exhibit 02: Executive Summary - Data Table on Market Overview
- Exhibit 03: Executive Summary - Chart on Global Market Characteristics
- Exhibit 04: Executive Summary - Chart on Market By Geographical Landscape
- Exhibit 05: Executive Summary - Chart on Market Segmentation by Type
- Exhibit 06: Executive Summary - Chart on Incremental Growth
- Exhibit 07: Executive Summary - Data Table on Incremental Growth
- Exhibit 08: Executive Summary - Chart on Vendor Market Positioning
2 Market Landscape
- 2.1 Market ecosystem
- Exhibit 09: Parent market
- Exhibit 10: Market Characteristics
3 Market Sizing
- 3.1 Market definition
- Exhibit 11: Offerings of vendors included in the market definition
- 3.2 Market segment analysis
- Exhibit 12: Market segments
- 3.3 Market size 2021
- 3.4 Market outlook: Forecast for 2021-2026
- Exhibit 13: Chart on Global - Market size and forecast 2021-2026 ($ billion)
- Exhibit 14: Data Table on Global - Market size and forecast 2021-2026 ($ billion)
- Exhibit 15: Chart on Global Market: Year-over-year growth 2021-2026 (%)
- Exhibit 16: Data Table on Global Market: Year-over-year growth 2021-2026 (%)
4 Five Forces Analysis
- 4.1 Five forces summary
- Exhibit 17: Five forces analysis - Comparison between2021 and 2026
- 4.2 Bargaining power of buyers
- Exhibit 18: Chart on Bargaining power of buyers - Impact of key factors 2021 and 2026
- 4.3 Bargaining power of suppliers
- Exhibit 19: Bargaining power of suppliers - Impact of key factors in 2021 and 2026
- 4.4 Threat of new entrants
- Exhibit 20: Threat of new entrants - Impact of key factors in 2021 and 2026
- 4.5 Threat of substitutes
- Exhibit 21: Threat of substitutes - Impact of key factors in 2021 and 2026
- 4.6 Threat of rivalry
- Exhibit 22: Threat of rivalry - Impact of key factors in 2021 and 2026
- 4.7 Market condition
- Exhibit 23: Chart on Market condition - Five forces 2021 and 2026
5 Market Segmentation by Type
- 5.1 Market segments
- Exhibit 24: Chart on Type - Market share 2021-2026 (%)
- Exhibit 25: Data Table on Type - Market share 2021-2026 (%)
- 5.2 Comparison by Type
- Exhibit 26: Chart on Comparison by Type
- Exhibit 27: Data Table on Comparison by Type
- 5.3 Composites - Market size and forecast 2021-2026
- Exhibit 28: Chart on Composites - Market size and forecast 2021-2026 ($ billion)
- Exhibit 29: Data Table on Composites - Market size and forecast 2021-2026 ($ billion)
- Exhibit 30: Chart on Composites - Year-over-year growth 2021-2026 (%)
- Exhibit 31: Data Table on Composites - Year-over-year growth 2021-2026 (%)
- 5.4 Ceramics - Market size and forecast 2021-2026
- Exhibit 32: Chart on Ceramics - Market size and forecast 2021-2026 ($ billion)
- Exhibit 33: Data Table on Ceramics - Market size and forecast 2021-2026 ($ billion)
- Exhibit 34: Chart on Ceramics - Year-over-year growth 2021-2026 (%)
- Exhibit 35: Data Table on Ceramics - Year-over-year growth 2021-2026 (%)
- 5.5 Energy materials - Market size and forecast 2021-2026
- Exhibit 36: Chart on Energy materials - Market size and forecast 2021-2026 ($ billion)
- Exhibit 37: Data Table on Energy materials - Market size and forecast 2021-2026 ($ billion)
- Exhibit 38: Chart on Energy materials - Year-over-year growth 2021-2026 (%)
- Exhibit 39: Data Table on Energy materials - Year-over-year growth 2021-2026 (%)
- 5.6 Nanomaterials - Market size and forecast 2021-2026
- Exhibit 40: Chart on Nanomaterials - Market size and forecast 2021-2026 ($ billion)
- Exhibit 41: Data Table on Nanomaterials - Market size and forecast 2021-2026 ($ billion)
- Exhibit 42: Chart on Nanomaterials - Year-over-year growth 2021-2026 (%)
- Exhibit 43: Data Table on Nanomaterials - Year-over-year growth 2021-2026 (%)
- 5.7 Conductive polymers - Market size and forecast 2021-2026
- Exhibit 44: Chart on Conductive polymers - Market size and forecast 2021-2026 ($ billion)
- Exhibit 45: Data Table on Conductive polymers - Market size and forecast 2021-2026 ($ billion)
- Exhibit 46: Chart on Conductive polymers - Year-over-year growth 2021-2026 (%)
- Exhibit 47: Data Table on Conductive polymers - Year-over-year growth 2021-2026 (%)
- 5.8 Market opportunity by Type
- Exhibit 48: Market opportunity by Type ($ billion)
6 Customer Landscape
- 6.1 Customer landscape overview
- Exhibit 49: Analysis of price sensitivity, lifecycle, customer purchase basket, adoption rates, and purchase criteria
7 Geographic Landscape
- 7.1 Geographic segmentation
- Exhibit 50: Chart on Market share By Geographical Landscape 2021-2026 (%)
- Exhibit 51: Data Table on Market share By Geographical Landscape 2021-2026 (%)
- 7.2 Geographic comparison
- Exhibit 52: Chart on Geographic comparison
- Exhibit 53: Data Table on Geographic comparison
- 7.3 APAC - Market size and forecast 2021-2026
- Exhibit 54: Chart on APAC - Market size and forecast 2021-2026 ($ billion)
- Exhibit 55: Data Table on APAC - Market size and forecast 2021-2026 ($ billion)
- Exhibit 56: Chart on APAC - Year-over-year growth 2021-2026 (%)
- Exhibit 57: Data Table on APAC - Year-over-year growth 2021-2026 (%)
- 7.4 North America - Market size and forecast 2021-2026
- Exhibit 58: Chart on North America - Market size and forecast 2021-2026 ($ billion)
- Exhibit 59: Data Table on North America - Market size and forecast 2021-2026 ($ billion)
- Exhibit 60: Chart on North America - Year-over-year growth 2021-2026 (%)
- Exhibit 61: Data Table on North America - Year-over-year growth 2021-2026 (%)
- 7.5 Europe - Market size and forecast 2021-2026
- Exhibit 62: Chart on Europe - Market size and forecast 2021-2026 ($ billion)
- Exhibit 63: Data Table on Europe - Market size and forecast 2021-2026 ($ billion)
- Exhibit 64: Chart on Europe - Year-over-year growth 2021-2026 (%)
- Exhibit 65: Data Table on Europe - Year-over-year growth 2021-2026 (%)
- 7.6 South America - Market size and forecast 2021-2026
- Exhibit 66: Chart on South America - Market size and forecast 2021-2026 ($ billion)
- Exhibit 67: Data Table on South America - Market size and forecast 2021-2026 ($ billion)
- Exhibit 68: Chart on South America - Year-over-year growth 2021-2026 (%)
- Exhibit 69: Data Table on South America - Year-over-year growth 2021-2026 (%)
- 7.7 Middle East and Africa - Market size and forecast 2021-2026
- Exhibit 70: Chart on Middle East and Africa - Market size and forecast 2021-2026 ($ billion)
- Exhibit 71: Data Table on Middle East and Africa - Market size and forecast 2021-2026 ($ billion)
- Exhibit 72: Chart on Middle East and Africa - Year-over-year growth 2021-2026 (%)
- Exhibit 73: Data Table on Middle East and Africa - Year-over-year growth 2021-2026 (%)
- 7.8 China - Market size and forecast 2021-2026
- Exhibit 74: Chart on China - Market size and forecast 2021-2026 ($ billion)
- Exhibit 75: Data Table on China - Market size and forecast 2021-2026 ($ billion)
- Exhibit 76: Chart on China - Year-over-year growth 2021-2026 (%)
- Exhibit 77: Data Table on China - Year-over-year growth 2021-2026 (%)
- 7.9 US - Market size and forecast 2021-2026
- Exhibit 78: Chart on US - Market size and forecast 2021-2026 ($ billion)
- Exhibit 79: Data Table on US - Market size and forecast 2021-2026 ($ billion)
- Exhibit 80: Chart on US - Year-over-year growth 2021-2026 (%)
- Exhibit 81: Data Table on US - Year-over-year growth 2021-2026 (%)
- 7.10 Mexico - Market size and forecast 2021-2026
- Exhibit 82: Chart on Mexico - Market size and forecast 2021-2026 ($ billion)
- Exhibit 83: Data Table on Mexico - Market size and forecast 2021-2026 ($ billion)
- Exhibit 84: Chart on Mexico - Year-over-year growth 2021-2026 (%)
- Exhibit 85: Data Table on Mexico - Year-over-year growth 2021-2026 (%)
- 7.11 Germany - Market size and forecast 2021-2026
- Exhibit 86: Chart on Germany - Market size and forecast 2021-2026 ($ billion)
- Exhibit 87: Data Table on Germany - Market size and forecast 2021-2026 ($ billion)
- Exhibit 88: Chart on Germany - Year-over-year growth 2021-2026 (%)
- Exhibit 89: Data Table on Germany - Year-over-year growth 2021-2026 (%)
- 7.12 India - Market size and forecast 2021-2026
- Exhibit 90: Chart on India - Market size and forecast 2021-2026 ($ billion)
- Exhibit 91: Data Table on India - Market size and forecast 2021-2026 ($ billion)
- Exhibit 92: Chart on India - Year-over-year growth 2021-2026 (%)
- Exhibit 93: Data Table on India - Year-over-year growth 2021-2026 (%)
- 7.13 Market opportunity By Geographical Landscape
- Exhibit 94: Market opportunity By Geographical Landscape ($ billion)
8 Drivers, Challenges, and Trends
- 8.1 Market drivers
- 8.2 Market challenges
- 8.3 Impact of drivers and challenges
- Exhibit 95: Impact of drivers and challenges in 2021 and 2026
- 8.4 Market trends
9 Vendor Landscape
- 9.1 Overview
- 9.2 Vendor landscape
- Exhibit 96: Overview on Criticality of inputs and Factors of differentiation
- 9.3 Landscape disruption
- Exhibit 97: Overview on factors of disruption
- 9.4 Industry risks
- Exhibit 98: Impact of key risks on business
10 Vendor Analysis
- 10.1 Vendors covered
- Exhibit 99: Vendors covered
- 10.2 Market positioning of vendors
- Exhibit 100: Matrix on vendor position and classification
- 10.3 3M Corp
- Exhibit 101: 3M Corp - Overview
- Exhibit 102: 3M Corp - Business segments
- Exhibit 103: 3M Corp - Key news
- Exhibit 104: 3M Corp - Key offerings
- Exhibit 105: 3M Corp - Segment focus
- 10.4 Arkema Group
- Exhibit 106: Arkema Group - Overview
- Exhibit 107: Arkema Group - Business segments
- Exhibit 108: Arkema Group - Key news
- Exhibit 109: Arkema Group - Key offerings
- Exhibit 110: Arkema Group - Segment focus
- 10.5 BASF SE
- Exhibit 111: BASF SE - Overview
- Exhibit 112: BASF SE - Business segments
- Exhibit 113: BASF SE - Key news
- Exhibit 114: BASF SE - Key offerings
- Exhibit 115: BASF SE - Segment focus
- 10.6 Covestro AG
- Exhibit 116: Covestro AG - Overview
- Exhibit 117: Covestro AG - Business segments
- Exhibit 118: Covestro AG - Key news
- Exhibit 119: Covestro AG - Key offerings
- Exhibit 120: Covestro AG - Segment focus
- 10.7 CPS Technologies Corp.
- Exhibit 121: CPS Technologies Corp. - Overview
- Exhibit 122: CPS Technologies Corp. - Product / Service
- Exhibit 123: CPS Technologies Corp. - Key offerings
- 10.8 DuPont de Nemours Inc.
- Exhibit 124: DuPont de Nemours Inc. - Overview
- Exhibit 125: DuPont de Nemours Inc. - Business segments
- Exhibit 126: DuPont de Nemours Inc. - Key offerings
- Exhibit 127: DuPont de Nemours Inc. - Segment focus
- 10.9 Hexcel Corp.
- Exhibit 128: Hexcel Corp. - Overview
- Exhibit 129: Hexcel Corp. - Business segments
- Exhibit 130: Hexcel Corp. - Key news
- Exhibit 131: Hexcel Corp. - Key offerings
- Exhibit 132: Hexcel Corp. - Segment focus
- 10.10 Schweiter Technologies
- Exhibit 133: Schweiter Technologies - Overview
- Exhibit 134: Schweiter Technologies - Business segments
- Exhibit 135: Schweiter Technologies - Key offerings
- Exhibit 136: Schweiter Technologies - Segment focus
- 10.11 Sumitomo Chemical Co. Ltd.
- Exhibit 137: Sumitomo Chemical Co. Ltd. - Overview
- Exhibit 138: Sumitomo Chemical Co. Ltd. - Business segments
- Exhibit 139: Sumitomo Chemical Co. Ltd. - Key offerings
- Exhibit 140: Sumitomo Chemical Co. Ltd. - Segment focus
- 10.12 The Dow Chemical Co.
- Exhibit 141: The Dow Chemical Co. - Overview
- Exhibit 142: The Dow Chemical Co. - Business segments
- Exhibit 143: The Dow Chemical Co. - Key news
- Exhibit 144: The Dow Chemical Co. - Key offerings
- Exhibit 145: The Dow Chemical Co. - Segment focus
11 Appendix
- 11.1 Scope of the report
- 11.2 Inclusions and exclusions checklist
- Exhibit 146: Inclusions checklist
- Exhibit 147: Exclusions checklist
- 11.3 Currency conversion rates for US$
- Exhibit 148: Currency conversion rates for US$
- 11.4 Research methodology
- Exhibit 149: Research methodology
- Exhibit 150: Validation techniques employed for market sizing
- Exhibit 151: Information sources
- 11.5 List of abbreviations
- Exhibit 152: List of abbreviations