|
|
市場調査レポート
商品コード
1076941
水耕栽培用栄養剤の世界市場:2022年~2026年Global Hydroponic Nutrients Market 2022-2026 |
||||||
|
|
|||||||
|
● お客様のご希望に応じて、既存データの加工や未掲載情報(例:国別セグメント)の追加などの対応が可能です。 詳細はお問い合わせください。 |
|||||||


| 水耕栽培用栄養剤の世界市場:2022年~2026年 |
|
出版日: 2022年05月16日
発行: TechNavio
ページ情報: 英文 120 Pages
納期: 即納可能
|
- 全表示
- 概要
- 図表
- 目次
世界の水耕栽培用栄養剤の市場規模は、2022年~2026年の間に23億5,000万米ドルの増加が見込まれ、予測期間中にCAGRで12.52%の成長が予測されています。
市場は、耕作地の減少、水耕栽培を促進するための政府の補助金、世界の食糧輸出の増加によって牽引されています。
当レポートでは、世界の水耕栽培用栄養剤市場について調査分析し、市場規模・予測、動向、促進要因、課題、さらに約25社のベンダーを網羅したベンダー分析などを提供しています。
目次
第1章 エグゼクティブサマリー
- 市場概要
第2章 市場情勢
- 市場のエコシステム
第3章 市場規模
- 市場の定義
- 市場セグメント分析
- 市場規模:2021年
- 市場の見通し:2021年~2026年の予測
第4章 ファイブフォース分析
- ファイブフォースの要約
- 買い手の交渉力
- サプライヤーの交渉力
- 新興企業の脅威
- 代替品の脅威
- 競合企業関係の脅威
- 市況
第5章 市場セグメンテーション:タイプ別
- 市場セグメント
- 比較:タイプ別
- 主要栄養素 - 市場規模と予測:2021年~2026年
- 微量栄養素 - 市場規模と予測:2021年~2026年
- 市場機会:タイプ別
第6章 顧客情勢
- 顧客情勢の概要
第7章 地域別情勢
- 地域別セグメンテーション
- 地域別比較
- アジア太平洋 - 市場規模と予測:2021年~2026年
- 北米 - 市場規模と予測:2021年~2026年
- 欧州 - 市場規模と予測:2021年~2026年
- 南米 - 市場規模と予測:2021年~2026年
- 中東とアフリカ - 市場規模と予測:2021年~2026年
- 米国 - 市場規模と予測:2021年~2026年
- インド - 市場規模と予測:2021年~2026年
- 日本 - 市場規模と予測:2021年~2026年
- オーストラリア - 市場規模と予測:2021年~2026年
- オランダ - 市場規模と予測:2021年~2026年
- 市場機会:地域情勢別
第8章 促進要因、課題、および動向
- 市場促進要因
- 市場の課題
- 促進要因と課題の影響
- 市場動向
第9章 ベンダー情勢
- 概要
- ベンダー情勢
- 混乱の状況
- 業界のリスク
第10章 ベンダー分析
- 対象ベンダー
- ベンダーの市場ポジショニング
- 3G Green Garden Group LLC
- Advanced Nutrients Ltd.
- Better Organix OU
- Canna Continental
- FoxFarm Soil and Fertilizer Co.
- Growth Technology Ltd.
- HGI Worldwide Inc.
- HS Supplies LLC
- Master Garden Nutrients Ltd.
- The Scotts Miracle Gro Co.
第11章 付録
Exhibits:
- Exhibits1: Executive Summary - Chart on Market Overview
- Exhibits2: Executive Summary - Data Table on Market Overview
- Exhibits3: Executive Summary - Chart on Global Market Characteristics
- Exhibits4: Executive Summary - Chart on Market By Geographical Landscape
- Exhibits5: Executive Summary - Chart on Market Segmentation by Type
- Exhibits6: Executive Summary - Chart on Incremental Growth
- Exhibits7: Executive Summary - Data Table on Incremental Growth
- Exhibits8: Executive Summary - Chart on Vendor Market Positioning
- Exhibits9: Parent market
- Exhibits10: Market Characteristics
- Exhibits11: Offerings of vendors included in the market definition
- Exhibits12: Market segments
- Exhibits13: Chart on Global - Market size and forecast 2021-2026 ($ million)
- Exhibits14: Data Table on Global - Market size and forecast 2021-2026 ($ million)
- Exhibits15: Chart on Global Market: Year-over-year growth 2021-2026 (%)
- Exhibits16: Data Table on Global Market: Year-over-year growth 2021-2026 (%)
- Exhibits17: Five forces analysis - Comparison between 2021 and 2026
- Exhibits18: Chart on Bargaining power of buyers - Impact of key factors 2021 and 2026
- Exhibits19: Bargaining power of suppliers - Impact of key factors in 2021 and 2026
- Exhibits20: Threat of new entrants - Impact of key factors in 2021 and 2026
- Exhibits21: Threat of substitutes - Impact of key factors in 2021 and 2026
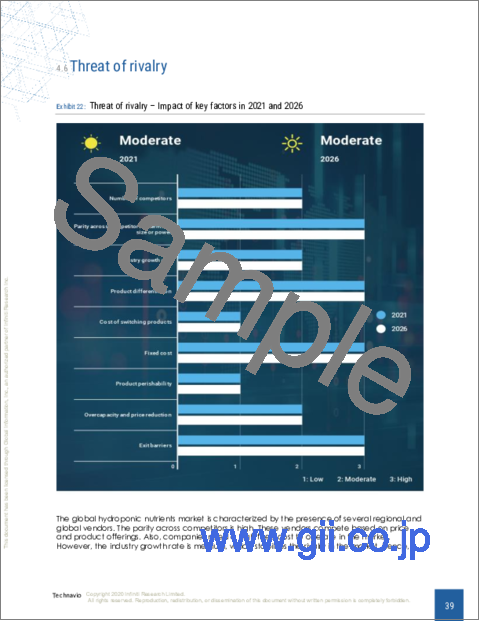
- Exhibits22: Threat of rivalry - Impact of key factors in 2021 and 2026
- Exhibits23: Chart on Market condition - Five forces 2021 and 2026
- Exhibits24: Chart on Type - Market share 2021-2026 (%)
- Exhibits25: Data Table on Type - Market share 2021-2026 (%)
- Exhibits26: Chart on Comparison by Type
- Exhibits27: Data Table on Comparison by Type
- Exhibits28: Chart on Macronutrients - Market size and forecast 2021-2026 ($ million)
- Exhibits29: Data Table on Macronutrients - Market size and forecast 2021-2026 ($ million)
- Exhibits30: Chart on Macronutrients - Year-over-year growth 2021-2026 (%)
- Exhibits31: Data Table on Macronutrients - Year-over-year growth 2021-2026 (%)
- Exhibits32: Chart on Micronutrients - Market size and forecast 2021-2026 ($ million)
- Exhibits33: Data Table on Micronutrients - Market size and forecast 2021-2026 ($ million)
- Exhibits34: Chart on Micronutrients - Year-over-year growth 2021-2026 (%)
- Exhibits35: Data Table on Micronutrients - Year-over-year growth 2021-2026 (%)
- Exhibits36: Market opportunity by Type ($ million)
- Exhibits37: Analysis of price sensitivity, lifecycle, customer purchase basket, adoption rates, and purchase criteria
- Exhibits38: Chart on Market share By Geographical Landscape 2021-2026 (%)
- Exhibits39: Data Table on Market share By Geographical Landscape 2021-2026 (%)
- Exhibits40: Chart on Geographic comparison
- Exhibits41: Data Table on Geographic comparison
- Exhibits42: Chart on APAC - Market size and forecast 2021-2026 ($ million)
- Exhibits43: Data Table on APAC - Market size and forecast 2021-2026 ($ million)
- Exhibits44: Chart on APAC - Year-over-year growth 2021-2026 (%)
- Exhibits45: Data Table on APAC - Year-over-year growth 2021-2026 (%)
- Exhibits46: Chart on North America - Market size and forecast 2021-2026 ($ million)
- Exhibits47: Data Table on North America - Market size and forecast 2021-2026 ($ million)
- Exhibits48: Chart on North America - Year-over-year growth 2021-2026 (%)
- Exhibits49: Data Table on North America - Year-over-year growth 2021-2026 (%)
- Exhibits50: Chart on Europe - Market size and forecast 2021-2026 ($ million)
- Exhibits51: Data Table on Europe - Market size and forecast 2021-2026 ($ million)
- Exhibits52: Chart on Europe - Year-over-year growth 2021-2026 (%)
- Exhibits53: Data Table on Europe - Year-over-year growth 2021-2026 (%)
- Exhibits54: Chart on South America - Market size and forecast 2021-2026 ($ million)
- Exhibits55: Data Table on South America - Market size and forecast 2021-2026 ($ million)
- Exhibits56: Chart on South America - Year-over-year growth 2021-2026 (%)
- Exhibits57: Data Table on South America - Year-over-year growth 2021-2026 (%)
- Exhibits58: Chart on Middle East and Africa - Market size and forecast 2021-2026 ($ million)
- Exhibits59: Data Table on Middle East and Africa - Market size and forecast 2021-2026 ($ million)
- Exhibits60: Chart on Middle East and Africa - Year-over-year growth 2021-2026 (%)
- Exhibits61: Data Table on Middle East and Africa - Year-over-year growth 2021-2026 (%)
- Exhibits62: Chart on US - Market size and forecast 2021-2026 ($ million)
- Exhibits63: Data Table on US - Market size and forecast 2021-2026 ($ million)
- Exhibits64: Chart on US - Year-over-year growth 2021-2026 (%)
- Exhibits65: Data Table on US - Year-over-year growth 2021-2026 (%)
- Exhibits66: Chart on India - Market size and forecast 2021-2026 ($ million)
- Exhibits67: Data Table on India - Market size and forecast 2021-2026 ($ million)
- Exhibits68: Chart on India - Year-over-year growth 2021-2026 (%)
- Exhibits69: Data Table on India - Year-over-year growth 2021-2026 (%)
- Exhibits70: Chart on Japan - Market size and forecast 2021-2026 ($ million)
- Exhibits71: Data Table on Japan - Market size and forecast 2021-2026 ($ million)
- Exhibits72: Chart on Japan - Year-over-year growth 2021-2026 (%)
- Exhibits73: Data Table on Japan - Year-over-year growth 2021-2026 (%)
- Exhibits74: Chart on Australia - Market size and forecast 2021-2026 ($ million)
- Exhibits75: Data Table on Australia - Market size and forecast 2021-2026 ($ million)
- Exhibits76: Chart on Australia - Year-over-year growth 2021-2026 (%)
- Exhibits77: Data Table on Australia - Year-over-year growth 2021-2026 (%)
- Exhibits78: Chart on The Netherlands - Market size and forecast 2021-2026 ($ million)
- Exhibits79: Data Table on The Netherlands - Market size and forecast 2021-2026 ($ million)
- Exhibits80: Chart on The Netherlands - Year-over-year growth 2021-2026 (%)
- Exhibits81: Data Table on The Netherlands - Year-over-year growth 2021-2026 (%)
- Exhibits82: Market opportunity By Geographical Landscape ($ million)
- Exhibits83: Impact of drivers and challenges in 2021 and 2026
- Exhibits84: Overview on Criticality of inputs and Factors of differentiation
- Exhibits85: Overview on factors of disruption
- Exhibits86: Impact of key risks on business
- Exhibits87: Vendors covered
- Exhibits88: Matrix on vendor position and classification
- Exhibits89: 3G Green Garden Group LLC - Overview
- Exhibits90: 3G Green Garden Group LLC - Product / Service
- Exhibits91: 3G Green Garden Group LLC - Key offerings
- Exhibits92: Advanced Nutrients Ltd. - Overview
- Exhibits93: Advanced Nutrients Ltd. - Product / Service
- Exhibits94: Advanced Nutrients Ltd. - Key offerings
- Exhibits95: Better Organix OU - Overview
- Exhibits96: Better Organix OU - Product / Service
- Exhibits97: Better Organix OU - Key offerings
- Exhibits98: Canna Continental - Overview
- Exhibits99: Canna Continental - Product / Service
- Exhibits100: Canna Continental - Key offerings
- Exhibits101: FoxFarm Soil and Fertilizer Co. - Overview
- Exhibits102: FoxFarm Soil and Fertilizer Co. - Product / Service
- Exhibits103: FoxFarm Soil and Fertilizer Co. - Key offerings
- Exhibits104: Growth Technology Ltd. - Overview
- Exhibits105: Growth Technology Ltd. - Product / Service
- Exhibits106: Growth Technology Ltd. - Key offerings
- Exhibits107: HGI Worldwide Inc. - Overview
- Exhibits108: HGI Worldwide Inc. - Product / Service
- Exhibits109: HGI Worldwide Inc. - Key offerings
- Exhibits110: HS Supplies LLC - Overview
- Exhibits111: HS Supplies LLC - Product / Service
- Exhibits112: HS Supplies LLC - Key offerings
- Exhibits113: Master Garden Nutrients Ltd. - Overview
- Exhibits114: Master Garden Nutrients Ltd. - Product / Service
- Exhibits115: Master Garden Nutrients Ltd. - Key offerings
- Exhibits116: The Scotts Miracle Gro Co. - Overview
- Exhibits117: The Scotts Miracle Gro Co. - Business segments
- Exhibits118: The Scotts Miracle Gro Co. - Key offerings
- Exhibits119: The Scotts Miracle Gro Co. - Segment focus
- Exhibits120: Inclusions checklist
- Exhibits121: Exclusions checklist
- Exhibits122: Currency conversion rates for US$
- Exhibits123: Research methodology
- Exhibits124: Validation techniques employed for market sizing
- Exhibits125: Information sources
- Exhibits126: List of abbreviations
Technavio has been monitoring the hydroponic nutrients market and it is poised to grow by $ 2.35 bn during 2022-2026, accelerating at a CAGR of 12.52% during the forecast period. Our report on the hydroponic nutrients market provides a holistic analysis, market size and forecast, trends, growth drivers, and challenges, as well as vendor analysis covering around 25 vendors.
The report offers an up-to-date analysis regarding the current global market scenario, latest trends and drivers, and the overall market environment. The market is driven by the reduction in arable land, government subsidies to promote hydroponic farming, and growing food export across the world.
The hydroponic nutrients market analysis includes the type segment and geographic landscaspe.
Technavio's hydroponic nutrients market is segmented as below:
By Type
- Macronutrients
- Micronutrients
By Geographical Landscape
- APAC
- North America
- Europe
- South America
- Middle East and Africa
This study identifies the growing application of hydroponics in vertical farming as one of the prime reasons driving the hydroponic nutrients market growth during the next few years. Also, production capacity expansion by vendors and growing number of m and a will lead to sizable demand in the market.
Technavio presents a detailed picture of the market by the way of study, synthesis, and summation of data from multiple sources by an analysis of key parameters. Our report on hydroponic nutrients market covers the following areas:
- Hydroponic nutrients market sizing
- Hydroponic nutrients market forecast
- Hydroponic nutrients market industry analysis
Technavio's robust vendor analysis is designed to help clients improve their market position, and in line with this, this report provides a detailed analysis of several leading hydroponic nutrients market vendors that include 3G Green Garden Group LLC, Advanced Nutrients Ltd., Better Organix OU, BrightFarms Inc., Canna Continental, FoxFarm Soil and Fertilizer Co., Growth Technology Ltd., HGI Worldwide Inc., HS Supplies LLC, Hydrodynamics International Inc., LumiGrow Inc., Master Garden Nutrients Ltd., Masterblend International Tyler Enterprises, Nutriculture UK Ltd., The Scotts Miracle Gro Co., and Village Farms International Inc. Also, the hydroponic nutrients market analysis report includes information on upcoming trends and challenges that will influence market growth. This is to help companies strategize and leverage all forthcoming growth opportunities.
The study was conducted using an objective combination of primary and secondary information including inputs from key participants in the industry. The report contains a comprehensive market and vendor landscape in addition to an analysis of the key vendors.
Technavio presents a detailed picture of the market by the way of study, synthesis, and summation of data from multiple sources by an analysis of key parameters such as profit, pricing, competition, and promotions. It presents various market facets by identifying the key industry influencers. The data presented is comprehensive, reliable, and a result of extensive research - both primary and secondary. Technavio's market research reports provide a complete competitive landscape and an in-depth vendor selection methodology and analysis using qualitative and quantitative research to forecast the accurate market growth.
Table of Contents
1 Executive Summary
- 1.1 Market overview
- Exhibit 01: Executive Summary - Chart on Market Overview
- Exhibit 02: Executive Summary - Data Table on Market Overview
- Exhibit 03: Executive Summary - Chart on Global Market Characteristics
- Exhibit 04: Executive Summary - Chart on Market By Geographical Landscape
- Exhibit 05: Executive Summary - Chart on Market Segmentation by Type
- Exhibit 06: Executive Summary - Chart on Incremental Growth
- Exhibit 07: Executive Summary - Data Table on Incremental Growth
- Exhibit 08: Executive Summary - Chart on Vendor Market Positioning
2 Market Landscape
- 2.1 Market ecosystem
- Exhibit 09: Parent market
- Exhibit 10: Market Characteristics
3 Market Sizing
- 3.1 Market definition
- Exhibit 11: Offerings of vendors included in the market definition
- 3.2 Market segment analysis
- Exhibit 12: Market segments
- 3.3 Market size 2021
- 3.4 Market outlook: Forecast for 2021-2026
- Exhibit 13: Chart on Global - Market size and forecast 2021-2026 ($ million)
- Exhibit 14: Data Table on Global - Market size and forecast 2021-2026 ($ million)
- Exhibit 15: Chart on Global Market: Year-over-year growth 2021-2026 (%)
- Exhibit 16: Data Table on Global Market: Year-over-year growth 2021-2026 (%)
4 Five Forces Analysis
- 4.1 Five forces summary
- Exhibit 17: Five forces analysis - Comparison between 2021 and 2026
- 4.2 Bargaining power of buyers
- Exhibit 18: Chart on Bargaining power of buyers - Impact of key factors 2021 and 2026
- 4.3 Bargaining power of suppliers
- Exhibit 19: Bargaining power of suppliers - Impact of key factors in 2021 and 2026
- 4.4 Threat of new entrants
- Exhibit 20: Threat of new entrants - Impact of key factors in 2021 and 2026
- 4.5 Threat of substitutes
- Exhibit 21: Threat of substitutes - Impact of key factors in 2021 and 2026
- 4.6 Threat of rivalry
- Exhibit 22: Threat of rivalry - Impact of key factors in 2021 and 2026
- 4.7 Market condition
- Exhibit 23: Chart on Market condition - Five forces 2021 and 2026
5 Market Segmentation by Type
- 5.1 Market segments
- Exhibit 24: Chart on Type - Market share 2021-2026 (%)
- Exhibit 25: Data Table on Type - Market share 2021-2026 (%)
- 5.2 Comparison by Type
- Exhibit 26: Chart on Comparison by Type
- Exhibit 27: Data Table on Comparison by Type
- 5.3 Macronutrients - Market size and forecast 2021-2026
- Exhibit 28: Chart on Macronutrients - Market size and forecast 2021-2026 ($ million)
- Exhibit 29: Data Table on Macronutrients - Market size and forecast 2021-2026 ($ million)
- Exhibit 30: Chart on Macronutrients - Year-over-year growth 2021-2026 (%)
- Exhibit 31: Data Table on Macronutrients - Year-over-year growth 2021-2026 (%)
- 5.4 Micronutrients - Market size and forecast 2021-2026
- Exhibit 32: Chart on Micronutrients - Market size and forecast 2021-2026 ($ million)
- Exhibit 33: Data Table on Micronutrients - Market size and forecast 2021-2026 ($ million)
- Exhibit 34: Chart on Micronutrients - Year-over-year growth 2021-2026 (%)
- Exhibit 35: Data Table on Micronutrients - Year-over-year growth 2021-2026 (%)
- 5.5 Market opportunity by Type
- Exhibit 36: Market opportunity by Type ($ million)
6 Customer Landscape
- 6.1 Customer landscape overview
- Exhibit 37: Analysis of price sensitivity, lifecycle, customer purchase basket, adoption rates, and purchase criteria
7 Geographic Landscape
- 7.1 Geographic segmentation
- Exhibit 38: Chart on Market share By Geographical Landscape 2021-2026 (%)
- Exhibit 39: Data Table on Market share By Geographical Landscape 2021-2026 (%)
- 7.2 Geographic comparison
- Exhibit 40: Chart on Geographic comparison
- Exhibit 41: Data Table on Geographic comparison
- 7.3 APAC - Market size and forecast 2021-2026
- Exhibit 42: Chart on APAC - Market size and forecast 2021-2026 ($ million)
- Exhibit 43: Data Table on APAC - Market size and forecast 2021-2026 ($ million)
- Exhibit 44: Chart on APAC - Year-over-year growth 2021-2026 (%)
- Exhibit 45: Data Table on APAC - Year-over-year growth 2021-2026 (%)
- 7.4 North America - Market size and forecast 2021-2026
- Exhibit 46: Chart on North America - Market size and forecast 2021-2026 ($ million)
- Exhibit 47: Data Table on North America - Market size and forecast 2021-2026 ($ million)
- Exhibit 48: Chart on North America - Year-over-year growth 2021-2026 (%)
- Exhibit 49: Data Table on North America - Year-over-year growth 2021-2026 (%)
- 7.5 Europe - Market size and forecast 2021-2026
- Exhibit 50: Chart on Europe - Market size and forecast 2021-2026 ($ million)
- Exhibit 51: Data Table on Europe - Market size and forecast 2021-2026 ($ million)
- Exhibit 52: Chart on Europe - Year-over-year growth 2021-2026 (%)
- Exhibit 53: Data Table on Europe - Year-over-year growth 2021-2026 (%)
- 7.6 South America - Market size and forecast 2021-2026
- Exhibit 54: Chart on South America - Market size and forecast 2021-2026 ($ million)
- Exhibit 55: Data Table on South America - Market size and forecast 2021-2026 ($ million)
- Exhibit 56: Chart on South America - Year-over-year growth 2021-2026 (%)
- Exhibit 57: Data Table on South America - Year-over-year growth 2021-2026 (%)
- 7.7 Middle East and Africa - Market size and forecast 2021-2026
- Exhibit 58: Chart on Middle East and Africa - Market size and forecast 2021-2026 ($ million)
- Exhibit 59: Data Table on Middle East and Africa - Market size and forecast 2021-2026 ($ million)
- Exhibit 60: Chart on Middle East and Africa - Year-over-year growth 2021-2026 (%)
- Exhibit 61: Data Table on Middle East and Africa - Year-over-year growth 2021-2026 (%)
- 7.8 US - Market size and forecast 2021-2026
- Exhibit 62: Chart on US - Market size and forecast 2021-2026 ($ million)
- Exhibit 63: Data Table on US - Market size and forecast 2021-2026 ($ million)
- Exhibit 64: Chart on US - Year-over-year growth 2021-2026 (%)
- Exhibit 65: Data Table on US - Year-over-year growth 2021-2026 (%)
- 7.9 India - Market size and forecast 2021-2026
- Exhibit 66: Chart on India - Market size and forecast 2021-2026 ($ million)
- Exhibit 67: Data Table on India - Market size and forecast 2021-2026 ($ million)
- Exhibit 68: Chart on India - Year-over-year growth 2021-2026 (%)
- Exhibit 69: Data Table on India - Year-over-year growth 2021-2026 (%)
- 7.10 Japan - Market size and forecast 2021-2026
- Exhibit 70: Chart on Japan - Market size and forecast 2021-2026 ($ million)
- Exhibit 71: Data Table on Japan - Market size and forecast 2021-2026 ($ million)
- Exhibit 72: Chart on Japan - Year-over-year growth 2021-2026 (%)
- Exhibit 73: Data Table on Japan - Year-over-year growth 2021-2026 (%)
- 7.11 Australia - Market size and forecast 2021-2026
- Exhibit 74: Chart on Australia - Market size and forecast 2021-2026 ($ million)
- Exhibit 75: Data Table on Australia - Market size and forecast 2021-2026 ($ million)
- Exhibit 76: Chart on Australia - Year-over-year growth 2021-2026 (%)
- Exhibit 77: Data Table on Australia - Year-over-year growth 2021-2026 (%)
- 7.12 The Netherlands - Market size and forecast 2021-2026
- Exhibit 78: Chart on The Netherlands - Market size and forecast 2021-2026 ($ million)
- Exhibit 79: Data Table on The Netherlands - Market size and forecast 2021-2026 ($ million)
- Exhibit 80: Chart on The Netherlands - Year-over-year growth 2021-2026 (%)
- Exhibit 81: Data Table on The Netherlands - Year-over-year growth 2021-2026 (%)
- 7.13 Market opportunity By Geographical Landscape
- Exhibit 82: Market opportunity By Geographical Landscape ($ million)
8 Drivers, Challenges, and Trends
- 8.1 Market drivers
- 8.2 Market challenges
- 8.3 Impact of drivers and challenges
- Exhibit 83: Impact of drivers and challenges in 2021 and 2026
- 8.4 Market trends
9 Vendor Landscape
- 9.1 Overview
- 9.2 Vendor landscape
- Exhibit 84: Overview on Criticality of inputs and Factors of differentiation
- 9.3 Landscape disruption
- Exhibit 85: Overview on factors of disruption
- 9.4 Industry risks
- Exhibit 86: Impact of key risks on business
10 Vendor Analysis
- 10.1 Vendors covered
- Exhibit 87: Vendors covered
- 10.2 Market positioning of vendors
- Exhibit 88: Matrix on vendor position and classification
- 10.3 3G Green Garden Group LLC
- Exhibit 89: 3G Green Garden Group LLC - Overview
- Exhibit 90: 3G Green Garden Group LLC - Product / Service
- Exhibit 91: 3G Green Garden Group LLC - Key offerings
- 10.4 Advanced Nutrients Ltd.
- Exhibit 92: Advanced Nutrients Ltd. - Overview
- Exhibit 93: Advanced Nutrients Ltd. - Product / Service
- Exhibit 94: Advanced Nutrients Ltd. - Key offerings
- 10.5 Better Organix OU
- Exhibit 95: Better Organix OU - Overview
- Exhibit 96: Better Organix OU - Product / Service
- Exhibit 97: Better Organix OU - Key offerings
- 10.6 Canna Continental
- Exhibit 98: Canna Continental - Overview
- Exhibit 99: Canna Continental - Product / Service
- Exhibit 100: Canna Continental - Key offerings
- 10.7 FoxFarm Soil and Fertilizer Co.
- Exhibit 101: FoxFarm Soil and Fertilizer Co. - Overview
- Exhibit 102: FoxFarm Soil and Fertilizer Co. - Product / Service
- Exhibit 103: FoxFarm Soil and Fertilizer Co. - Key offerings
- 10.8 Growth Technology Ltd.
- Exhibit 104: Growth Technology Ltd. - Overview
- Exhibit 105: Growth Technology Ltd. - Product / Service
- Exhibit 106: Growth Technology Ltd. - Key offerings
- 10.9 HGI Worldwide Inc.
- Exhibit 107: HGI Worldwide Inc. - Overview
- Exhibit 108: HGI Worldwide Inc. - Product / Service
- Exhibit 109: HGI Worldwide Inc. - Key offerings
- 10.10 HS Supplies LLC
- Exhibit 110: HS Supplies LLC - Overview
- Exhibit 111: HS Supplies LLC - Product / Service
- Exhibit 112: HS Supplies LLC - Key offerings
- 10.11 Master Garden Nutrients Ltd.
- Exhibit 113: Master Garden Nutrients Ltd. - Overview
- Exhibit 114: Master Garden Nutrients Ltd. - Product / Service
- Exhibit 115: Master Garden Nutrients Ltd. - Key offerings
- 10.12 The Scotts Miracle Gro Co.
- Exhibit 116: The Scotts Miracle Gro Co. - Overview
- Exhibit 117: The Scotts Miracle Gro Co. - Business segments
- Exhibit 118: The Scotts Miracle Gro Co. - Key offerings
- Exhibit 119: The Scotts Miracle Gro Co. - Segment focus
11 Appendix
- 11.1 Scope of the report
- 11.2 Inclusions and exclusions checklist
- Exhibit 120: Inclusions checklist
- Exhibit 121: Exclusions checklist
- 11.3 Currency conversion rates for US$
- Exhibit 122: Currency conversion rates for US$
- 11.4 Research methodology
- Exhibit 123: Research methodology
- Exhibit 124: Validation techniques employed for market sizing
- Exhibit 125: Information sources
- 11.5 List of abbreviations
- Exhibit 126: List of abbreviations